. 2021 Feb 17;10(2):413.
doi: 10.3390/cells10020413.

Oligomeric Aβ1-42 Induces an AMD-Like Phenotype and Accumulates in Lysosomes to Impair RPE Function

Affiliations

Oligomeric Aβ1-42 Induces an AMD-Like Phenotype and Accumulates in Lysosomes to Impair RPE Function

Savannah A Lynn et al. Cells. .

Abstract

Alzheimer's disease-associated amyloid beta (Aβ) proteins accumulate in the outer retina with increasing age and in eyes of age-related macular degeneration (AMD) patients. To study Aβ-induced retinopathy, wild-type mice were injected with nanomolar human oligomeric Aβ1-42, which recapitulate the Aβ burden reported in human donor eyes. In vitro studies investigated the cellular effects of Aβ in endothelial and retinal pigment epithelial (RPE) cells. Results show subretinal Aβ-induced focal AMD-like pathology within 2 weeks. Aβ exposure caused endothelial cell migration, and morphological and barrier alterations to the RPE. Aβ co-localized to late-endocytic compartments of RPE cells, which persisted despite attempts to clear it through upregulation of lysosomal cathepsin B, revealing a novel mechanism of lysosomal impairment in retinal degeneration. The rapid upregulation of cathepsin B was out of step with the prolonged accumulation of Aβ within lysosomes, and contrasted with enzymatic responses to internalized photoreceptor outer segments (POS). Furthermore, RPE cells exposed to Aβ were identified as deficient in cargo-carrying lysosomes at time points that are critical to POS degradation. These findings imply that Aβ accumulation within late-endocytic compartments, as well as lysosomal deficiency, impairs RPE function over time, contributing to visual defects seen in aging and AMD eyes.

Keywords: age-related macular degeneration (AMD); aging; amyloid beta (Aβ); autophagy–lysosomal pathway; retinal pigment epithelium (RPE); sight loss.


Conflict of interest statement

The authors declare no competing interest.

Figures
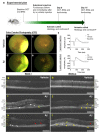
Figure 1
Figure 1
Subretinal Aβ effects in retinas of living mouse eyes. (a) Schematic plan showing experimental sequence. (b) Representative color fundus photograph (CFP) of mouse eye injected with vehicle immediately after and (c) 8 days following subretinal injection. Note, the appearance of a retinal bleb following a successful transscleral subretinal injection, which subsequently resolves. (d) Representative CFP of mouse eye injected with human oligomeric Aβ1-42 immediately after and (e) 8 days later. Note superficial evidence of retinal pathology following exposure to Aβ. (f) Average scotopic ERG responses in mice injected with vehicle (n = 6) or human oligomeric Aβ1-42 (n = 7) after 1 and 2 weeks. No significant differences in retinal function were observed between eyes injected with Aβ vs. controls by Mann–Whitney U test (two tailed). (g) Representative optical coherence tomography (OCT) images of vehicle and (i,k) human oligomeric Aβ1-42-injected eyes after 1 week. We observed areas of localized pathology in eyes exposed Aβ1-42 consisting of RPE disruption (red arrows), subretinal fluid accumulation (white arrows) and hyper-reflective material (asterisk). There was also evidence of occasional hypo-reflective spaces (yellow arrows). However, by week 2, subretinal fluid accumulation appeared to have been largely resolved (j,l), but there was increasing evidence of hypo-reflective spaces. We also observed disrupted RPE and subretinal hyper-reflective material persisting in week 2. There was no evidence of pathogenic features in eyes injected with vehicle at either 1 or 2 weeks (g,h). Scale bars correspond to 200 μm.
Figure 2
Figure 2
Quantification of Aβ-induced GA-like lesions in living mouse retinae. Optical coherence tomography (OCT) scans of mice subretinally injected with 625 nM human oligomeric Aβ1-42 revealed the presence of a discernable focal lesion. (a) The maximal height and width of the lesion was measured using the caliper tool function as shown in the sample OCT image and (b) presented as volumetric measurements at 1 and 2 week post-injection. The average lesion volume measured 0.52 mm3 ± 0.12 SEM at 1 week and 0.45 mm3 ± 0.16 SEM at 2 weeks. n = 7 mice (p = 0.78) Two-tailed Student’s t-test. No significant differences in lesion sizes were observed between weeks 1 and 2.
Figure 3
Figure 3
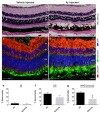
AMD-like histopathology in the outer retina of mouse eyes exposed to human oligomeric Aβ1-42 at one week post-injection. (a) Hematoxylin and eosin (H&E) staining of tissues from vehicle-injected mouse eyes showed a healthy retina compared to (b) eyes exposed to Aβ, where we observed evidence of significant outer retinal disruption. This included diminished inner segments, absence of photoreceptor outer segments as well as a disorganized/atrophic RPE and choroid in a localized area. We also observed the appearance of cystic-like spaces (arrows), which perhaps correspond to areas of subretinal fluid accumulation seen in OCT scans. Scale bars correspond to 50 μm. (c) Retinal cross-sections were also probed with anti-rhodopsin to label outer segments (green) and β3-tubulin which labelled retinal neurons (red). (d) These studies confirmed the extent of photoreceptor-RPE disruption observed in H&E sections of Aβ-exposed eyes. In contrast, vehicle-injected eyes showed no evidence of any pathology (c). Scale bars correspond to 50 μm. Next, we performed line-scan analysis of H&E sections to quantify the extent of Aβ-mediated retinal pathology which is shown as histograms for percentage abnormality on an arbitrary scale. Pathology in Aβ- vs. vehicle-injected eyes was assessed using an unpaired Student’s t-test which revealed no differences in (e) inner segments, p = 0.71 or (f) outer segments, p = 0.26. (g) However, compared to vehicle-treated eyes, we observed a significant level of disruption in the RPE-choroid, p = 0.03 in Aβ-exposed eyes. Measurements in n = 6 mice for vehicle-injected and n = 7 mice for Aβ injected. Error bars represent S.E.M. * denotes a significance of p ˂ 0.05.
Figure 4
Figure 4
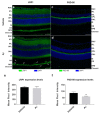
Effects of subretinally injected Aβ on LRP1 and PSD-95 expression in mouse retinas at two weeks post-injection. Mouse eyes injected with human oligomeric Aβ1-42 (n = 3) or vehicle (n = 3) were analyzed to determine potential changes to expression of the Aβ clearance receptor LRP1 and the post-synaptic density marker PSD-95. Two weeks after subretinal injections, animals were culled and ocular cross-sections assessed by confocal immunofluorescence microscopy. (a) Representative image shows LRP1 expression in vehicle-injected eye compared to (b) eye injected with Aβ. Note, how staining reveals evidence of disrupted OS, RPE/BrM and choroid after Aβ exposure (arrows). (c) Representative image shows PSD-95 expression in vehicle-injected eye compared to (d) eye injected with Aβ. Structure of the OPL and adjacent layers of the neuroretina appears to be unaffected by subretinal Aβ exposure. Scale bars correspond to 50 mm. (ef) The mean pixel intensity was quantified for all layers (retina, RPE/BrM and choroid) and presented as a combined value for each treatment. No changes was observed in LRP1 expression between Aβ and vehicle-injected eyes (unpaired Student’s t-test, p = 0.67, two tailed). By contrast, expression of PSD-95 was significantly diminished 2 weeks after Aβ treatment compared to control eyes (p = 0.04, two tailed). Error bars represent S.E.M. * denotes a significance of p ˂ 0.05.
Figure 5
Figure 5
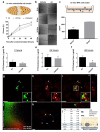
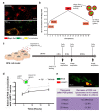
Human oligomeric Aβ1-42 directly targets choroidal endothelial and RPE cells. (a) The consequences of Aβ exposure on choroidal endothelial cells were studied using a scratch assay. (b) Representative bright filed images showing closure of the scratch between 0, 6, 24 and 48 h after treatment with either 1 μM of human oligomeric Aβ1-42 or vehicle. Exposure to Aβ resulted in a significantly rapid closure of the scratch at 24 and 48 h compared to vehicle or untreated controls (n = 4). One-way ANOVA with Tukey’s multiple comparisons test, where * denotes a significance of p ˂ 0.05. (c) As the RPE is a major source of retinal Aβ, we next quantified total soluble Aβ1-x levels in an in vitro model. Significantly higher amounts of Aβ was preferentially secreted via the basolateral RPE surface compared to Aβ levels secreted apically (n = 3 from 3 independent experiments). Unpaired Student’s t-test, where *** denotes a significance of p ˂ 0.001. To determine whether exposure to elevated Aβ impaired integrity of the RPE barrier, we quantified the passage of a FITC-dextran substrate from the apical to the basal Transwell chamber at (d) 2 h, (e) 24 h and (f) 48 h. Exposure to 1 μM human oligomeric Aβ1-42 resulted in a markedly increased paracellular permeability at 48 h compared to vehicle-treated controls (n = 3). Mann–Whitney U test where * denotes a significance of p ˂ 0.05. Next, we studied whether exposure to Aβ resulted in its internalization by RPE cells. Representative confocal micrographs showing (g) Alex Fluor 488-tagged Aβ1-42 (green) with (h) LysoSensor DND-160 (red) (i) co-localizing in merged en face image (yellow: in white arrows) 24 h after Aβ exposure. Orthogonal views are shown alongside. Scale bars correspond to 40 μm. (j) Representative 2D scatter plot (cell 2 in (l)) generated by Costes analysis where thresholds are indicated in black along an axis providing a qualitative indication of co-localization. Manders split coefficients are shown in the bottom right. (k) 3D projection of cultured RPE cells showing Alex Fluor 488-tagged Aβ1-42 in green co-localizing with LysoSensor probe in red. Scale bar corresponds to 40 μm. (l) Costes overlap coefficients M1 and M2 indicating percentage of red co-localizing with green, and green co-localizing with red, respectively. Therefore, ~26% (0.259) of lysosomes were positive for Aβ, whilst 40.7% (0.407) of the Aβ signal co-localized to lysosomes. Measurements in n = 6 cells across three fields of view. Quantification was performed using Volocity software. (m) Schematic showing late-endocytic perinuclear compartments in RPE cells, which were labelled with Aβ1-42 in these experiments.
Figure 6
Figure 6
Effect of Aβ on RPE lysosomal size. (a) The diameter of LysoSensor-positive vesicles was quantified in RPE cells that were untreated, treated with vehicle or human Aβ1-42, 24 h after Aβ exposure. (b,c) Results show a significant increase in vesicle dimeter in compartments containing Aβ compared to those in the same cell without Aβ cargo or in vehicle-treated or untreated RPE cells. Scale bars in b correspond to 10 μm. The 25 vesicles measured in six random images from three separate experiments per treatment group. A significance of p ˂ 0.01 (denoted by **) was observed when the size of Aβ-positive vesicles was compared to vesicle dimeters in all other conditions. One-way ANOVA with Tukey’s multiple comparisons test (F3,20 = 8.73).
Figure 7
Figure 7
The cellular response to Aβ cargos in RPE lysosomes and transcriptional assessment of cathepsin B activity. (a) Schematic showing experimental plan where cultured RPE were exposed to 1 μM oligomeric Aβ1-42 for 3 h, following the removal of which Magic Red was used to obtain readouts of lysosomal cathepsin B activity at different time points. (b) Schematic showing arrangement of fluorophores in experiment where Aβ-Alexa Fluor 488 (green) and Magic Red (cathepsin B enzymatic activity) can be simultaneously quantified. Time course showing intensity of Magic Red fluorescence at (c) 0.5 h, (d) 3 h, (e) 24 h and (f) 48 h following exposure to Aβ, vehicle or untreated controls. Significant differences were observed in Magic Red intensity between Aβ vs. vehicle-treated controls as well as untreated sister cultures at 0.5 and 3 h, which diminished thereafter to baseline levels. n = 40 for Aβ1-42, vehicle and n = 30 for untreated cultures across four biological replicates (10 images analyzed per treatment/experiment). Kruskal–Wallis with Dunn’s multiple comparisons where ** denotes a significance of p ˂ 0.01, whilst **** indicate p ˂ 0.0001. (g) A summary table showing Magic Red activity in response to Aβ cargo as a percentage change over vehicle, compared to responses for POS cargo. (h) Quantitative PCR analysis of cathepsin B (CSTB) mRNA expression in relation to the EIF4A2 reference gene as fold change in expression, n = 3. No significant differences in cathepsin B mRNA levels were detected between Aβ-treated vs. vehicle or untreated cultures.
Figure 8
Figure 8
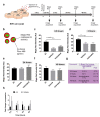
The pattern of Aβ aggregation in RPE lysosomes and consequences to RPE function. (a) Representative confocal immunofluorescence image showing a high proportion of late-endocytic compartments positive for Aβ1-42 (green), which co-localize with Magic Red to appear yellow. Scale bars correspond to 40 μm. (b) Dynamics of Aβ1-42 entry into lysosomes of RPE cells shown relative to vehicle-treated cultures, which reached an arbitrary point of maximal aggregation after 24 h. Only minimal degradation of the Aβ fluorescence signal was observed after 24 h following maximal aggregation (or by 48 h after initial Aβ exposure). Consequently, ˃80% of Aβ present at the 24 h time point remained sequestered with RPE lysosomes a day later. Data from three biological replicates. (c) Schematic showing experimental plan where RPE cultures exposed to either Aβ1-42 or vehicle were fed with POS a day later, and co-localization with LAMP1 vesicles quantified thereafter at 4, 8 and 20 h. (d) Graph showing extent of POS co-localization in LAMP1 vesicles after POS feeding. Two-tailed unpaired Student’s t-test. Data from three biological replicates, where * denotes a significance of p ˂ 0.05, whilst *** indicate p ˂ 0.001. (e) Representative confocal-immunofluorescence image showing POS-FITC (green) co-localizing with LAMP1 compartments (red) and appear yellow. Scale bar corresponds to 20 μm. Summary table showing percentage decrease in LAMP1-positive vesicles with POS cargos at different time points after POS feeding in Aβ-treated cells relative to vehicle. Aβ-exposed RPE had significantly fewer lysosomes capable to trafficking POS cargos after 8 h.
Figure 9
Figure 9
Summary diagram of Aβ-induced pathology in the retina. The age-related Aβ accumulation reported in sub-RPE/drusen, POS and choroid of donor AMD tissues and in animal models is recapitulated by Aβ-injected mice and by in vitro studies. (a) Development of localized retinal pathology with GA-like features alongside synaptic loss in the OPL following subretinal Aβ injection in living mouse eyes. (b) Impaired RPE barrier with development of contracted RPE foci following exposure to human oligomeric Aβ1-42. (c) Choroidal pathology in the form of increased endothelial cell migration after Aβ exposure. Aβ effects appear to be mediated directly rather than via upregulation of VEGF. (d) Aβ is internalized by RPE lysosomes, which become swollen. An insufficient lysosomal cathepsin B response contributes to Aβ accumulating in RPE lysosomes. RPE exposed to oligomeric Aβ exhibit lysosomal deficits affecting the capacity to traffic/degrade POS cargos, which over time, could contribute to developing visual defects.

Similar articles

Cited by

References

    1. Ferrington D.A., Sinha D., Kaarniranta K. Defects in retinal pigment epithelial cell proteolysis and the pathology associated with age-related macular degeneration. Prog. Retin. Eye Res. 2016;51:69–89. doi: 10.1016/j.preteyeres.2015.09.002. - DOI - PMC - PubMed
    1. Sparrow J.R., Gregory-Roberts E., Yamamoto K., Blonska A., Ghosh S.K., Ueda K., Zhou J. The bisretinoids of retinal pigment epithelium. Prog. Retin. Eye Res. 2012;31:121–135. doi: 10.1016/j.preteyeres.2011.12.001. - DOI - PMC - PubMed
    1. Holz F.G., Sadda S.R., Staurenghi G., Lindner M., Bird A.C., Blodi B.A., Bottoni F., Chakravarthy U., Chew E.Y., Csaky K., et al. Imaging Protocols in Clinical Studies in Advanced Age-Related Macular Degeneration: Recommendations from Classification of Atrophy Consensus Meetings. Ophthalmology. 2017;124:464–478. doi: 10.1016/j.ophtha.2016.12.002. - DOI - PubMed
    1. Holz F.G., Bindewald-Wittich A., Fleckenstein M., Dreyhaupt J., Scholl H.P., Schmitz-Valckenberg S. Progression of geographic atrophy and impact of fundus autofluorescence patterns in age-related macular degeneration. Am. J. Ophthalmol. 2007;143:463–472. doi: 10.1016/j.ajo.2006.11.041. - DOI - PubMed
    1. Rudolf M., Clark M.E., Chimento M.F., Li C.M., Medeiros N.E., Curcio C.A. Prevalence and morphology of druse types in the macula and periphery of eyes with age-related maculopathy. Investig. Ophthalmol. Vis. Sci. 2008;49:1200–1209. doi: 10.1167/iovs.07-1466. - DOI - PMC - PubMed

Publication types

LinkOut - more resources