. 2021 Feb 17;10(2):414.
doi: 10.3390/cells10020414.

Renal Proximal Tubule Cell Cannabinoid-1 Receptor Regulates Bone Remodeling and Mass via a Kidney-to-Bone Axis

Affiliations

Renal Proximal Tubule Cell Cannabinoid-1 Receptor Regulates Bone Remodeling and Mass via a Kidney-to-Bone Axis

Saja Baraghithy et al. Cells. .

Abstract

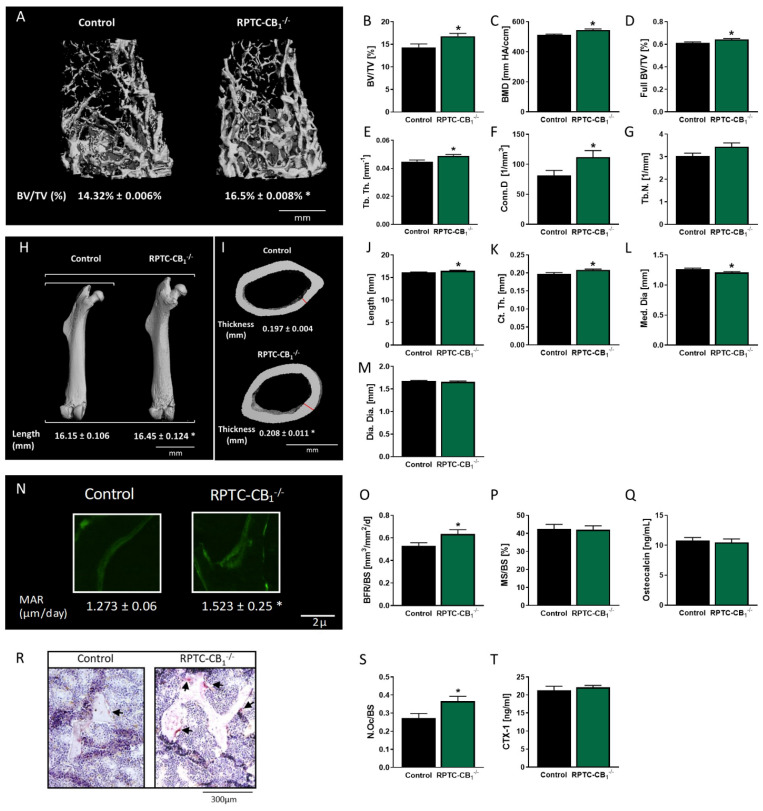
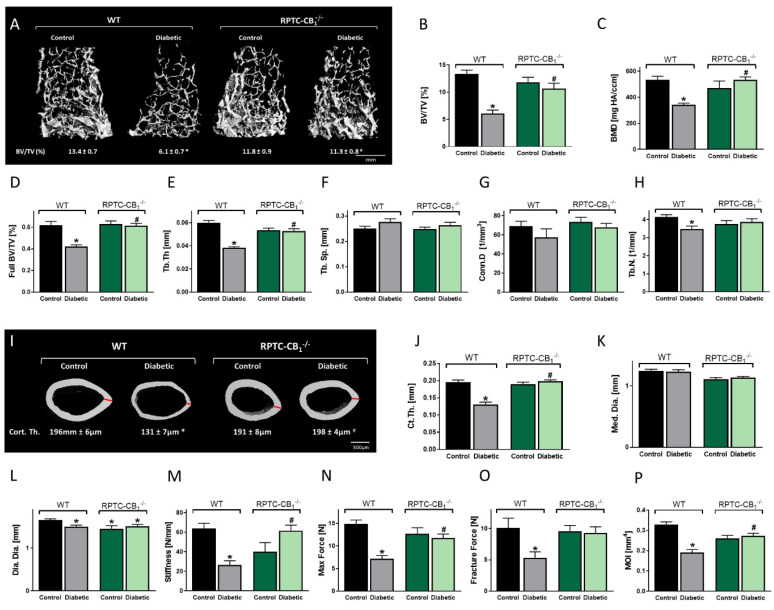
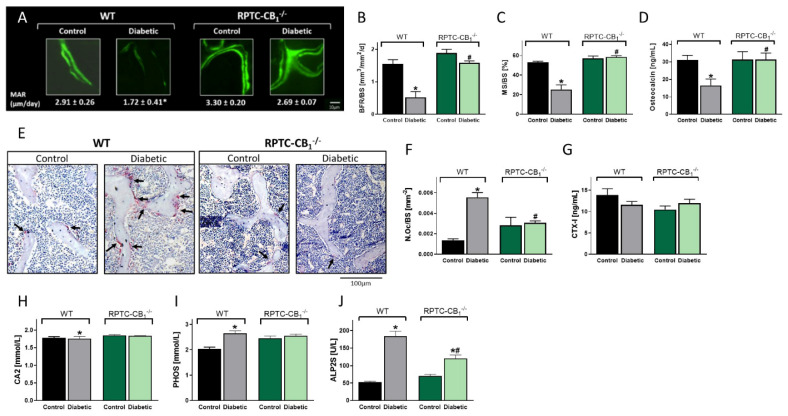
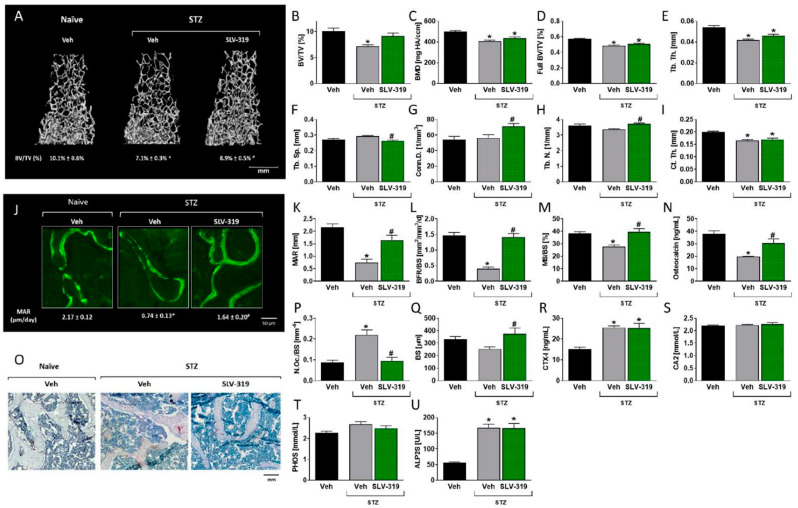
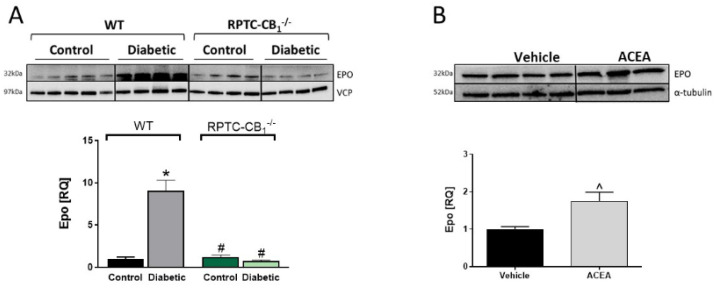
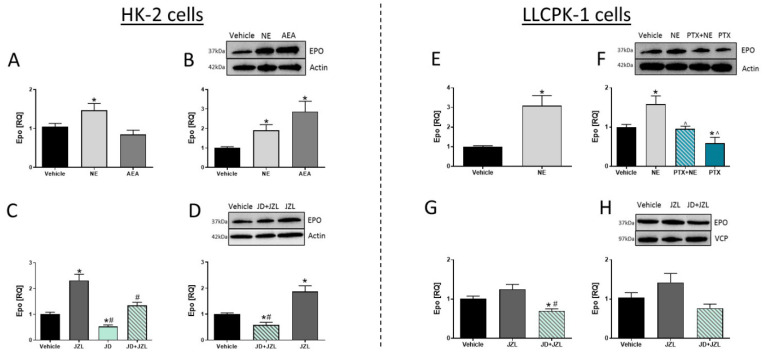
The renal proximal tubule cells (RPTCs), well-known for maintaining glucose and mineral homeostasis, play a critical role in the regulation of kidney function and bone remodeling. Deterioration in RPTC function may therefore lead to the development of diabetic kidney disease (DKD) and osteoporosis. Previously, we have shown that the cannabinoid-1 receptor (CB1R) modulates both kidney function as well as bone remodeling and mass via its direct role in RPTCs and bone cells, respectively. Here we employed genetic and pharmacological approaches that target CB1R, and found that its specific nullification in RPTCs preserves bone mass and remodeling both under normo- and hyper-glycemic conditions, and that its chronic blockade prevents the development of diabetes-induced bone loss. These protective effects of negatively targeting CB1R specifically in RPTCs were associated with its ability to modulate erythropoietin (EPO) synthesis, a hormone known to affect bone mass and remodeling. Our findings highlight a novel molecular mechanism by which CB1R in RPTCs remotely regulates skeletal homeostasis via a kidney-to-bone axis that involves EPO.

Keywords: CB1 receptor; erythropoietin; osteoporosis; type 1 diabetes.


Conflict of interest statement

The authors declare no conflict of interest.

Figures

Figure 1
Figure 1
Main endocannabinoid receptor (CB1R) in renal proximal tubule cells (RPTCs) modulates bone mass and function under normoglycemic conditions. 3D images of the distal femoral metaphysis of RPTC-CB1−/− mice and their littermate wild-type (WT) controls with median bone volume density (BV/TV) values (A,B), bone mineral density (BMD; C), full bone BV/TV (D), trabecular thickness (Tb.Th; E), connectivity density (Conn.D; F), and trabecular number (Tb.N; G). 3D images of the femora of RPTC-CB1−/− mice and their littermate WT controls with median values of length for each group (Length; H,J). 3D images of the femoral mid-diaphysis of mice with median values of cortical thickness (Ct.Th) for each group (I,K), medullary diameter (Med.Dia; L), and diaphyseal diameter (Dia.Dia; M). Histomorphometric analysis of the bone formation parameters. Representative images of calcein-labeled mineralized fronts with mineral apposition rate (MAR) values (N), the bone formation rate (BFR/BS; O), mineralizing surface (MS/BS; P), and serum osteocalcin levels (Q). Images of TRAP+ osteoclasts (R), the number of osteoclasts per trabecular surface area (N.Oc/BS; S), and the serum levels of CTX-1 (T). Data represent the mean ± SEM from 10–14 animals per group, * p < 0.05 relative to the corresponding control group.
Figure 2
Figure 2
Nullification of CB1R in RPTCs protects against diabetes-induced bone loss. 3D images of the distal femoral metaphysis of RPTC-CB1−/− mice and their littermate WT controls with median bone volume fraction (BV/TV) values (A,B), bone mineral density (BMD; C), full bone BV/TV (D), trabecular thickness (Tb.Th; E), trabecular spacing (Tb.Sp; F), connectivity density (Conn.D; G), and trabecular number (Tb.N; H). 3D images of the femoral mid-diaphysis of mice with median values of cortical thickness (Ct.Th) for each group (I), cortical thickness (Ct. Th; J), medullary diameter (Med.Dia; K), diaphyseal diameter (Dia.Dia; L), stiffness (M), maximal force (N), fracture force (O), and moment of inertia (MOI; P). Data represent the mean ± SEM from 8–13 animals per group, * p < 0.05 vs. non-diabetic WT control mice, # p < 0.05 vs. diabetic WT mice.
Figure 3
Figure 3
Nullification of CB1R in RPTCs prevents diabetes-induced inhibition of bone formation and upregulation in osteoclastogenesis. Representative images of calcein-labeled mineralized fronts with mineral apposition rate (MAR) values (A). Bone formation rate (BFR/BS; B), mineralizing surface (MS/BS; C), and osteocalcin serum levels (D). Images of TRAP+ osteoclasts (E), the number of osteoclasts per trabecular surface area (N.Oc/BS; F), and the serum levels of CTX-1 (G). The levels of the circulating biochemical markers, calcium (CA2; H), phosphate (PHOS; I), and alkaline phosphatase (ALP2S; J). Data represent the mean ± SEM from 8–13 animals per group, * p < 0.05 vs. non-diabetic WT control mice, # p < 0.05 vs. diabetic WT mice.
Figure 4
Figure 4
Chronic CB1R blockade prevents T1D-induced bone loss. 3D representative images of the distal femoral metaphysis of mice with median bone volume density (BV/TV) values (A,B). Bone mineral density (BMD; C), full bone BV/TV (D), trabecular thickness (Tb.Th; E), trabecular spacing (Tb.Sp.; F), connectivity density (Conn.D; G), trabecular number (Tb.N; H), and cortical thickness (Ct.Th; I). Histomorphometric and biochemical analysis of bone remodeling parameters reveals a rescue of diabetes-induced bone loss by SLV-319. Representative images of calcein-labeled mineralized fronts (J), the mineral apposition rate (MAR; K), the bone formation rate (BFR/BS; L), the mineralizing surface (M), and the serum osteocalcin levels (N). Images of TRAP+ osteoclasts (O) show the number of osteoclasts per trabecular surface area (N.Oc/BS; P), the bone surface (BS; Q), and the serum levels of CTX-1 (R), as well as the levels of biochemical markers, calcium (CA2; S), phosphate (PHOS; T), and alkaline phosphatase (ALP2S; U). Data represent the mean ± SEM from 8–10 mice per group, * p < 0.05 relative to the corresponding control group treated with Veh, # p < 0.05 relative to the corresponding streptozotocin (STZ) group treated with Veh.
Figure 5
Figure 5
Renal EPO levels are elevated during diabetes or by activation of CB1R. Representative Western blots and quantification of the protein levels of EPO in kidney samples collected from normal and diabetic WT and RPTC-CB1−/− mice (A), representative Western blots and quantification of renal protein levels of EPO in mice treated acutely with arachidonyl-2′-chloroethylamide (ACEA) (10 mg/kg, IP; B). Data represent the mean ± SEM from 8–13 animals per group, * p < 0.05 vs. non-diabetic control WT mice, # p < 0.05 vs. diabetic WT mice, ^ p < 0.05 vs. vehicle-treated mice.
Figure 6
Figure 6
CB1R modulates EPO levels in vitro. mRNA expression levels of EPO in HK-2 cells (A,C). Representative Western blots and quantification of EPO in HK-2 cells (B,D). mRNA expression levels of EPO in LLCPK-1 (E,G). Representative Western blots and quantification of EPO in LLCPK-1 cells (F,H). Data represent the mean ± SEM from 2–4 independent experiments conducted in 6 replicates in each treatment group, * p < 0.05 vs. vehicle, # p < 0.05 vs. JZL-195, ^ p < 0.05 vs. noladin ether (NE).

Similar articles

Cited by

References

    1. Obri A., Khrimian L., Karsenty G., Oury F. Osteocalcin in the brain: From embryonic development to age-related decline in cognition. Nat. Rev. Endocrinol. 2018;14:174–182. doi: 10.1038/nrendo.2017.181. - DOI - PMC - PubMed
    1. Han Y., You X., Xing W., Zhang Z., Zou W. Paracrine and endocrine actions of bone—the functions of secretory proteins from osteoblasts, osteocytes, and osteoclasts. Bone Res. 2018;6:1–11. doi: 10.1038/s41413-018-0019-6. - DOI - PMC - PubMed
    1. Penido M.G.M.G., Alon U.S. Phosphate homeostasis and its role in bone health. Pediatr. Nephrol. 2012;27:2039–2048. doi: 10.1007/s00467-012-2175-z. - DOI - PMC - PubMed
    1. Gattineni J., Baum M. Regulation of phosphate transport by fibroblast growth factor 23 (FGF23): Implications for disorders of phosphate metabolism. Pediatr. Nephrol. 2010;25:591–601. doi: 10.1007/s00467-009-1273-z. - DOI - PMC - PubMed
    1. Pi M., Quarles L.D. Novel bone endocrine networks integrating mineral and energy metabolism. Curr. Osteoporos. Rep. 2013;11:391–399. doi: 10.1007/s11914-013-0178-8. - DOI - PMC - PubMed

Publication types