. 2021 Feb 17;9(2):163.
doi: 10.3390/vaccines9020163.

Non-Lethal Sequential Individual Monitoring of Viremia in Relation to DNA Vaccination in Fish-Example Using a Salmon Alphavirus DNA Vaccine in Atlantic Salmon Salmo salar

Affiliations

Non-Lethal Sequential Individual Monitoring of Viremia in Relation to DNA Vaccination in Fish-Example Using a Salmon Alphavirus DNA Vaccine in Atlantic Salmon Salmo salar

Catherine Collins et al. Vaccines (Basel). .

Abstract

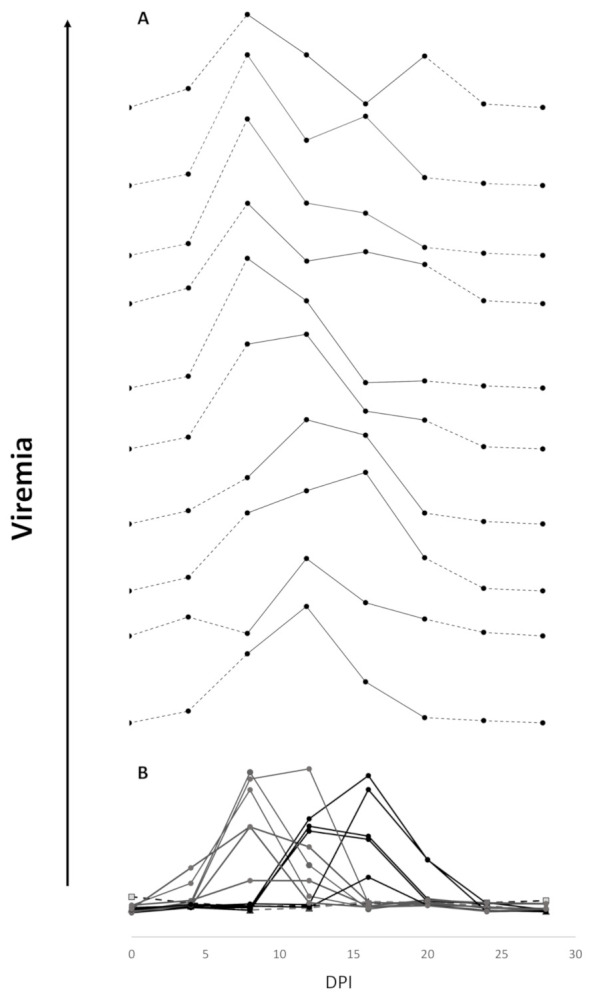
Traditionally, commercial testing for vaccine efficacy has relied on the mass infection of vaccinated and unvaccinated animals and the comparison of mortality prevalence and incidence. For some infection models where disease does not cause mortality this approach to testing vaccine efficacy is not useful. Additionally, in fish experimental studies on vaccine efficacy and immune response the norm is that several individuals are lethally sampled at sequential timepoints, and results are extrapolated to represent the kinetics of immune and disease parameters of an individual fish over the entire experimental infection period. In the present study we developed a new approach to vaccine testing for viremic viruses in fish by following the same individuals over the course of a DNA vaccination and experimental infection through repeated blood collection and analyses. Injectable DNA vaccines are particularly efficient against viral disease in fish. To date, two DNA vaccines have been authorised for use in fish farming, one in Canada against Infectious Haemorrhagic Necrotic virus and more recently one in Europe against Salmon Pancreatic Disease virus (SPDv) subtype 3. In the current study we engineered and used an experimental DNA vaccine against SPDv subtype 1. We measured viremia using a reporter cell line system and demonstrated that the viremia phase was completely extinguished following DNA vaccination. Differences in viremia infection kinetics between fish in the placebo group could be related to subsequent antibody levels in the individual fish, with higher antibody levels at terminal sampling in fish showing earlier viremia peaks. The results indicate that sequential non-lethal sampling can highlight associations between infection traits and immune responses measured at asynchronous timepoints and, can provide biological explanations for variation in data. Similar to results observed for the SPDv subtype 3 DNA vaccine, the SPDv subtype 1 DNA vaccine also induced an interferon type 1 response after vaccination and provided high protection against SPDv under laboratory conditions when fish were challenged at 7 weeks post-vaccination.

Keywords: DNA vaccine; SAV1; Viremia; individual fish monitoring; reporter assay; salmon.


Conflict of interest statement

The authors declare no conflict of interest.

Figures

Figure 1
Figure 1
Overview of experimental design for Salmon Pancreatic Disease virus (SPDv) DNA vaccination of salmon. (A). Experiment 1 (lethal sampling, vaccination only, no viral challenge). (B). Experiment 2 (non-lethal sampling, vaccination followed by immersion challenge). Numbers in bold correspond to days post-vaccination, numbers in italic correspond to days post infection, grey upward arrows correspond to non-lethal blood collections, and black downward arrows correspond to lethal tissue sampling. ppG is the DNA vaccine (pcDNA3.1-Hyg-mEGFP-pp4640 plasmid containing SPDv structural polyprotein), and 3.1H is the empty vector control (pcDNA3.1-mEGFP).
Figure 2
Figure 2
Kinetics of gene expression from the lethal experiment (Exp 1) in animals injected (i.m.) with PBS, vector only (3.1H), or the DNA vaccine (ppG) in the muscle tissue at the site of injection (A), in the head kidney (B), or in the blood cells (C), for mx, gip, cd8, or cd83. Individual data are represented as well as the average (horizontal line) (n = 6), the time point is indicated as day post-vaccination (dpv), and the fold change in gene expression in ppG and 3.1H groups relative to the PBS group is given.
Figure 2
Figure 2
Kinetics of gene expression from the lethal experiment (Exp 1) in animals injected (i.m.) with PBS, vector only (3.1H), or the DNA vaccine (ppG) in the muscle tissue at the site of injection (A), in the head kidney (B), or in the blood cells (C), for mx, gip, cd8, or cd83. Individual data are represented as well as the average (horizontal line) (n = 6), the time point is indicated as day post-vaccination (dpv), and the fold change in gene expression in ppG and 3.1H groups relative to the PBS group is given.
Figure 3
Figure 3
(A). Individual SPDv viremia following immersion infection measured by the RTG-P1 method. Fish were injected with PBS (Fish 1–5), 3.1H (empty vector, Fish 6–20) or ppG (SPDv vaccine, Fish 21–30). Data are individual viremia (fish number in the second column) at different days post-infection (DPI) relative to the individual’s viremia at 0 dpi and are represented as a heatmap. The time scale in relation to days post-vaccination (DPV) is also indicated. The column named “qPCR” gives the relative level of viral load assessed by quantitative RT-PCR in a pool of heart and muscle tissue RNA from the terminal sampling point (DPI 28). The column labelled “Histo H” indicates the histopathological score in the heart at dpi 28. “*” indicates a non-inflammatory lesion. (B). Compact and spongy myocardium: Histological images of samples from group 3.1H for animals F20 (Grade 0, left) and F13 (Grade 3, right) at terminal sampling date (dpv 77/dpi 28). These samples were chosen to illustrate the differences between the two extremes of the histological presentation (i.e., 0 and 3). Please note that intermediate grades vary in the frequency and severity of the lesions, but not in the specific patterns associated with these lesions. Briefly, the tissue in grade 0 is histologically normal, while the tissue in grade 3 features cardiomyocyte necrosis/degeneration (black arrowheads) and inflammatory infiltration by mononuclear cells (black arrows). These patterns are visible in both the compact and spongy layers. Haematoxylin and Eosin, ×200. Scale bar = 100 µm).
Figure 4
Figure 4
Individual kinetics of viremia in PBS-injected-uninfected (A), 3.1H-injected-infected (B), and ppG-injected-infected fish (C). Statistical analysis using an R-script designed for analysis of individual kinetics (Collet al., 2015) comparing viremia in ppG-injected-infected fish (open circles) and 3.1H-injected-infected groups (close circles) (D) and between ppG-injected-infected fish (open circle) and PBS-injected-uninfected groups (close circle) (E). The discontinued lines represent the 95% confidence intervals and values outwith these are statistically significant. Two representative individual viremia kinetics are shown in (D). 3.3. Viremia Kinetics: Individual Non-Lethal Fish Sampling Versus Simulated Lethal Sampling
Figure 5
Figure 5
(A) Ten theoretical viremia kinetics constructed by randomly resampling individual non-lethal data to model a lethally sampled dataset (n = average of viremia levels from 3 different fish for each dpi 7–20). (B) Viremia kinetics from actual non-lethal sequentially sampled fish (n = 13).
Figure 6
Figure 6
Individual kinetics of mx gene expression in blood cells at 3 and 7 dpv and corresponding viremia at dpv 49–77/dpi 0–28 (experiment 2) in the PBS-injected-uninfected group (F1, F2, F3, F4; bottom), 3.1H-injected-infected group (F6, F8, F9, F10; middle) and ppG-injected-infected group (F21, F22, F23, F24, F25; top). The pre-infection data are the relative level of mx gene expression in the blood cells expressed as fold change to dpv 0 (pre-vaccination) measured by qPCR (left side, dpv 3 and 7). The post-infection data are the viremia measured in the plasma by the RTG-P1 reporter assay and expressed as fold change to the pre-infected level (dpv 49/dpi 0). The Y-axis scale is logarithmic and is identical between the three groups, which have been separated to allow for visualisation of individual kinetics. Minor marker labels indicate an increment of 0.6 (0.6, 1.2, 1.8, 2.4, 3.0, 3.6, 4.2, 4.8, 5.4, and 6.0). Within each group, individuals are uniquely identified by a distinctive marker.
Figure 7
Figure 7
Neutralising activity of the plasma collected at 28 days post-infection (DPI). (A) Neutralising antibody levels are indicatedfor. groups: PBS-injected-uninfected group (F4-5, white), 3.1H-injected-infected group (F6-20, grey) and ppG-injected-infected group (F22-35, black). *: animal displaying early peak in viremia (B) Correlation between the level of neutralisation at dpi 28 and day (dpi) of viremia peak. The amplitude of the observed viremia peak is indicated on the plot alongside individual fish number in brackets (F). The linear regression is indicated by the dotted line with probability and R squared value.
Figure 8
Figure 8
Comparison of the kinetics of the relative amount of plasmid at the site of injection in 3.1H and ppG-injected groups in experiment 1. Data represent average ± standard deviation (n = 6) of level of plasmid relative to the host genomic DNA. The scale is logarithmic. PCMV: CMV promoter, present in plasmid).

Similar articles

Cited by

References

    1. Jansen M.D., Jensen B.B., McLoughlin M.F., Rodger H.D., Taksdal T., Sindre H., Graham D.A., Lillehaug A. The epidemiology of pancreas disease in salmonid aquaculture: Asummary of the current state of knowledge. J. Fish Dis. 2016;40:141–155. doi: 10.1111/jfd.12478. - DOI - PubMed
    1. Brudeseth B.E., Wiulsrød R., Fredriksen B.N., Lindmo K., Løkling K.-E., Bordevik M., Steine N., Klevan A., Gravningen K. Status and future perspectives of vaccines for industrialised fin-fish farming. Fish Shellfish Immunol. 2013;35:1759–1768. doi: 10.1016/j.fsi.2013.05.029. - DOI - PubMed
    1. Evensen Ø., Leong J.-A.C. DNA vaccines against viral diseases of farmed fish. Fish Shellfish Immunol. 2013;35:1751–1758. doi: 10.1016/j.fsi.2013.10.021. - DOI - PubMed
    1. Hølvold L.B., Myhr A.I., Dalmo R.A. Strategies and hurdles using DNA vaccines to fish. Veter. Res. 2014;45:21. doi: 10.1186/1297-9716-45-21. - DOI - PMC - PubMed
    1. Lund V., Espelid S., Mikkelsen H. Vaccine efficacy in spotted wolffish Anarhichas minor: Relationship to molecular variation in A-layer protein of atypical Aeromonas salmoncida. Dis. Aquat. Org. 2003;56:31–42. doi: 10.3354/dao056031. - DOI - PubMed

LinkOut - more resources