. 2021 Feb 17;13(4):833.
doi: 10.3390/cancers13040833.

Mapping of Genomic Vulnerabilities in the Post-Translational Ubiquitination, SUMOylation and Neddylation Machinery in Breast Cancer

Affiliations

Mapping of Genomic Vulnerabilities in the Post-Translational Ubiquitination, SUMOylation and Neddylation Machinery in Breast Cancer

Jesús Fuentes-Antrás et al. Cancers (Basel). .

Abstract

The dysregulation of post-translational modifications (PTM) transversally impacts cancer hallmarks and constitutes an appealing vulnerability for drug development. In breast cancer there is growing preclinical evidence of the role of ubiquitin and ubiquitin-like SUMO and Nedd8 peptide conjugation to the proteome in tumorigenesis and drug resistance, particularly through their interplay with estrogen receptor signaling and DNA repair. Herein we explored genomic alterations in these processes using RNA-seq and mutation data from TCGA and METABRIC datasets, and analyzed them using a bioinformatic pipeline in search of those with prognostic and predictive capability which could qualify as subjects of drug research. Amplification of UBE2T, UBE2C, and BIRC5 conferred a worse prognosis in luminal A/B and basal-like tumors, luminal A/B tumors, and luminal A tumors, respectively. Higher UBE2T expression levels were predictive of a lower rate of pathological complete response in triple negative breast cancer patients following neoadjuvant chemotherapy, whereas UBE2C and BIRC5 expression was higher in luminal A patients with tumor relapse within 5 years of endocrine therapy or chemotherapy. The transcriptomic signatures of USP9X and USP7 gene mutations also conferred worse prognosis in luminal A, HER2-enriched, and basal-like tumors, and in luminal A tumors, respectively. In conclusion, we identified and characterized the clinical value of a group of genomic alterations in ubiquitination, SUMOylation, and neddylation enzymes, with potential for drug development in breast cancer.

Keywords: SUMOylation; biomarkers; breast cancer; neddylation; post-translational modification; prognosis; ubiquitination.


Conflict of interest statement

The authors declare no conflict of interest.

Figures

Figure 1
Figure 1
Common genomic alterations in ubiquitination, SUMOylation, and neddylation in breast cancer. (a) Flow chart showing the interrogation of the Reactome database to identify genes involved in post-translational protein modifications, particularly ubiquitination, SUMOylation, and neddylation. (b) Bar graph summarizing the number of genes participating in each process. Only UCHL3 participated in both ubiquitination and neddylation. (c) Bar graph showing the GO molecular function of the genes previously identified for each process, sorted by the combined score in the EnrichR database. (d) Heatmap presenting the frequency of patients from the TCGA and METABRIC datasets with amplifications, mutations, and deletions, of the genes involved in each process. Only genes with a frequency of amplifications higher than 2% are displayed, those under 2% can be found in Figure S1.
Figure 2
Figure 2
Filtering of gene amplifications. (a) Regression analysis of amplification frequencies in the TCGA and METABRIC datasets, highlighting gene amplifications that occur in more than 2% of patients in both. (b) Distribution of the frequency of the selected amplified genes across intrinsic subtypes in patients from the TCGA dataset. Population is limited to those patients in which the intrinsic subtype is available in cBioPortal for stratification.
Figure 3
Figure 3
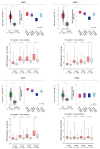
Expression levels of the most frequently amplified genes. Statistically significant differences in gene expression between tumor and healthy samples, along with the distribution of expression levels across intrinsic subtypes (upper part). Association of the amplification status with expression levels across intrinsic subtypes (lower part). Single asterisk denotes p < 0.05 and double asterisk denotes p < 0.01 using the Mann-Whitney test.
Figure 4
Figure 4
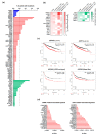
Association between gene expression and a worse relapse-free survival in breast cancer patients. (a) Survival analysis for individual genes correlated with poor relapse-free survival among the frequently amplified genes. (b) Co-occurrence of mutations in the analyzed population calculated by the odds ratio method. (c) Protein-protein interaction map displaying the significant functional network integrated by the selected genes. Line thickness denotes the strength of the association.
Figure 4
Figure 4
Association between gene expression and a worse relapse-free survival in breast cancer patients. (a) Survival analysis for individual genes correlated with poor relapse-free survival among the frequently amplified genes. (b) Co-occurrence of mutations in the analyzed population calculated by the odds ratio method. (c) Protein-protein interaction map displaying the significant functional network integrated by the selected genes. Line thickness denotes the strength of the association.
Figure 5
Figure 5
Association between gene expression and a worse relapse-free survival across intrinsic subtypes of breast cancer. (a) Filtering of gene amplifications with prognostic capability using the following criteria: statistical significance p < 0.05, FDR < 5%, HR of RFS > 1.5. (b) Survival analysis for the selected genes correlated with poor relapse-free survival across different intrinsic subtypes of breast cancer.
Figure 5
Figure 5
Association between gene expression and a worse relapse-free survival across intrinsic subtypes of breast cancer. (a) Filtering of gene amplifications with prognostic capability using the following criteria: statistical significance p < 0.05, FDR < 5%, HR of RFS > 1.5. (b) Survival analysis for the selected genes correlated with poor relapse-free survival across different intrinsic subtypes of breast cancer.
Figure 6
Figure 6
Association between gene expression and response to anti-tumor therapies. (a) Difference in gene expression of UBE2T in TNBC patients according to the achievement of a pathological complete response (pCR) after neoadjuvant therapy. ROC curve displaying the predictive capability of pCR of UBE2T. (b) Difference in gene expression of UBE2C and BIRC5 in luminal A patients according to the achievement of 5 years of RFS after adjuvant chemotherapy. ROC curve displaying the predictive capability of 5 years RFS of UBE2C and BIRC5. (c) Difference in gene expression of UBE2C and BIRC5 in luminal A patients according to the achievement of 5 years of RFS with adjuvant endocrine therapy. ROC curve displaying the predictive capability of 5 years RFS of UBE2T and BIRC5. Companion graphs for ESR1 are included as control and help apprehend the potential clinical relevance of the predictive associations.
Figure 6
Figure 6
Association between gene expression and response to anti-tumor therapies. (a) Difference in gene expression of UBE2T in TNBC patients according to the achievement of a pathological complete response (pCR) after neoadjuvant therapy. ROC curve displaying the predictive capability of pCR of UBE2T. (b) Difference in gene expression of UBE2C and BIRC5 in luminal A patients according to the achievement of 5 years of RFS after adjuvant chemotherapy. ROC curve displaying the predictive capability of 5 years RFS of UBE2C and BIRC5. (c) Difference in gene expression of UBE2C and BIRC5 in luminal A patients according to the achievement of 5 years of RFS with adjuvant endocrine therapy. ROC curve displaying the predictive capability of 5 years RFS of UBE2T and BIRC5. Companion graphs for ESR1 are included as control and help apprehend the potential clinical relevance of the predictive associations.
Figure 7
Figure 7
Mutational landscape and prognostic implications. (a) Frequency of gene mutations in breast cancer patients from the TCGA dataset. (b) Distribution of the frequencies of gene mutations over 0.5% across intrinsic subtypes. Population is limited to those patients in which the intrinsic subtype is available in cBioPortal for stratification. (c) Significant associations between the transcriptomic signatures of USP9X and UP7 mutations and overall survival across intrinsic subtypes. (d) Top USP9X and USP7-associated transcriptomic signature components, sorted by p-value.
Figure 8
Figure 8
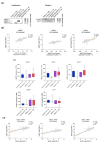
In vitro correlates of the genomic vulnerabilities identified in the SUN machinery in BC. (a) Heatmap showing the frequency of UBE2T, UBE2C, and BIRC5 amplifications, and USP9X and USP7 mutations, across cell lines of different intrinsic subtypes. (b) Positive dependance between copy number and gene expression in BC cell lines. (c) Distribution of gene expression across cell lines of the different intrinsic subtypes. (d) Positive correlation between the expression levels of UBE2T, UBE2C, and BIRC5, and proliferation marker MKi67.

References

    1. Lord S.J., Kiely B.E., Pearson S.-A., Daniels B., O’Connell D.L., Beith J., Bulsara M.K., Houssami N. Metastatic Breast Cancer Incidence, Site and Survival in Australia, 2001–2016: A Population-Based Health Record Linkage Study Protocol. BMJ Open. 2019;9 doi: 10.1136/bmjopen-2018-026414. - DOI - PMC - PubMed
    1. International Cancer Genome Consortium. Hudson T.J., Anderson W., Artez A., Barker A.D., Bell C., Bernabé R.R., Bhan M.K., Calvo F., Eerola I., et al. International Network of Cancer Genome Projects. Nature. 2010;464:993–998. doi: 10.1038/nature08987. - DOI - PMC - PubMed
    1. Cancer Genome Atlas Network Comprehensive Molecular Portraits of Human Breast Tumours. Nature. 2012;490:61–70. doi: 10.1038/nature11412. - DOI - PMC - PubMed
    1. Weinstein J.N., Collisson E.A., Mills G.B., Shaw K.M., Ozenberger B.A., Ellrott K., Shmulevich I., Sander C., Stuart J.M. The Cancer Genome Atlas Pan-Cancer Analysis Project. Nat Genet. 2013;45:1113–1120. doi: 10.1038/ng.2764. - DOI - PMC - PubMed
    1. Pereira B., Chin S.-F., Rueda O.M., Vollan H.-K.M., Provenzano E., Bardwell H.A., Pugh M., Jones L., Russell R., Sammut S.-J., et al. The Somatic Mutation Profiles of 2433 Breast Cancers Refine Their Genomic and Transcriptomic Landscapes. Nat. Commun. 2016;7:11479. doi: 10.1038/ncomms11479. - DOI - PMC - PubMed