

Pharmacokinetics of the CYP3A4 and CYP2B6 Inducer Carbamazepine and Its Drug-Drug Interaction Potential: A Physiologically Based Pharmacokinetic Modeling Approach
- PMID: 33671323
- PMCID: PMC7922031
- DOI: 10.3390/pharmaceutics13020270
Pharmacokinetics of the CYP3A4 and CYP2B6 Inducer Carbamazepine and Its Drug-Drug Interaction Potential: A Physiologically Based Pharmacokinetic Modeling Approach
Abstract
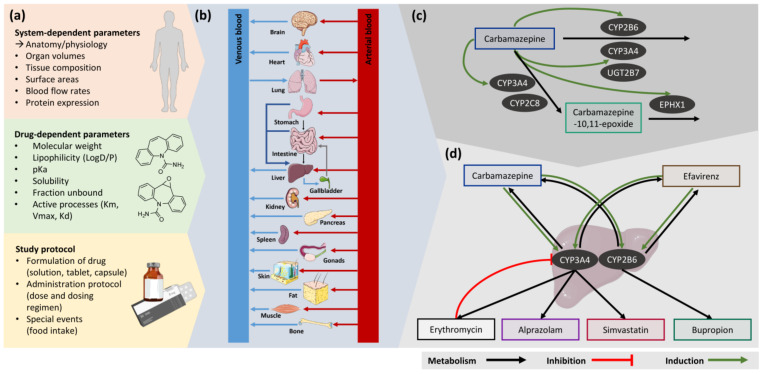
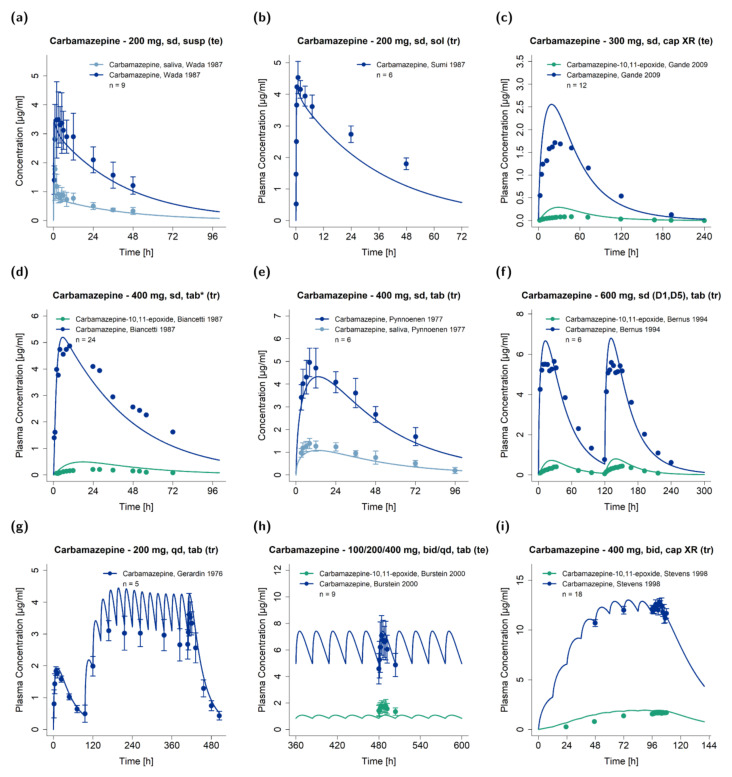
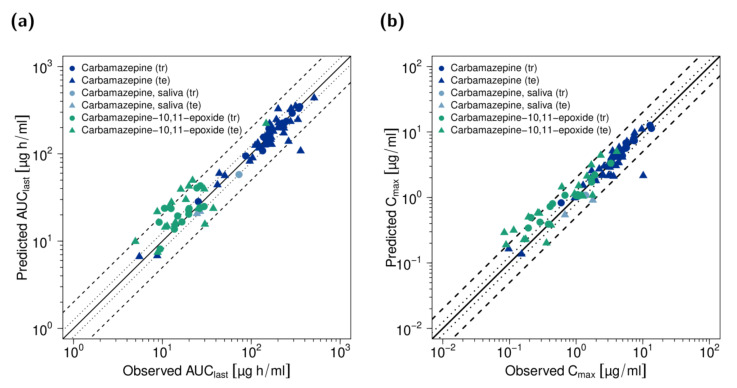
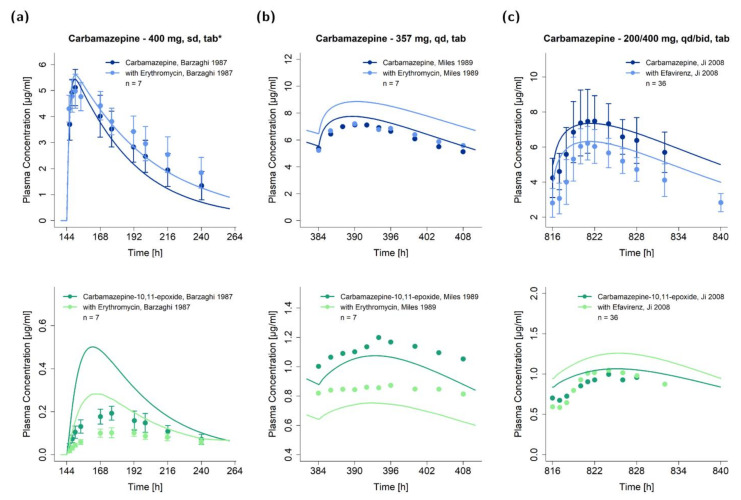
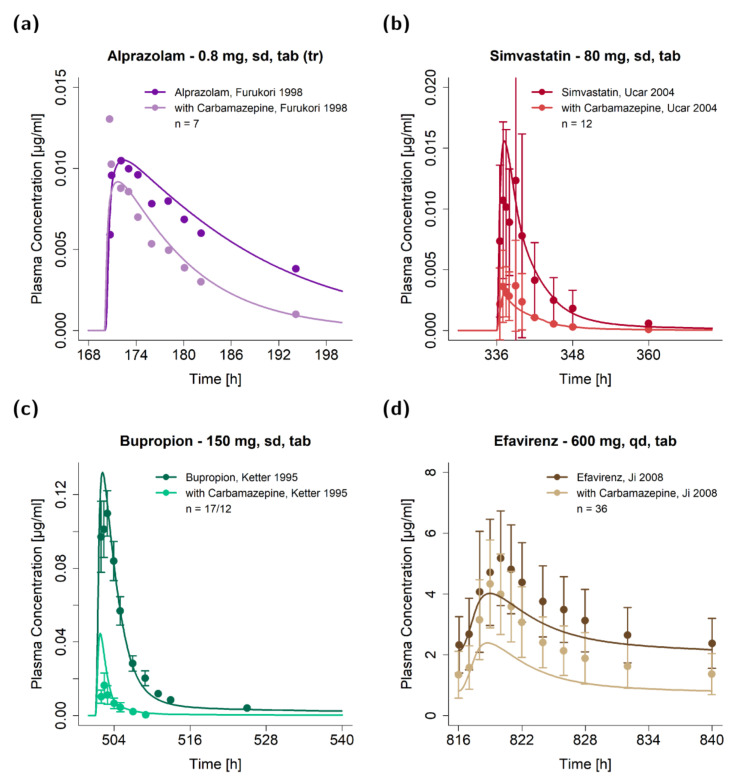
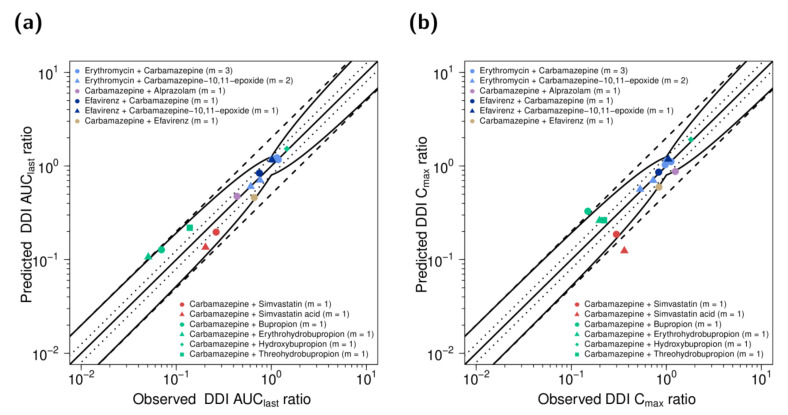
The anticonvulsant carbamazepine is frequently used in the long-term therapy of epilepsy and is a known substrate and inducer of cytochrome P450 (CYP) 3A4 and CYP2B6. Carbamazepine induces the metabolism of various drugs (including its own); on the other hand, its metabolism can be affected by various CYP inhibitors and inducers. The aim of this work was to develop a physiologically based pharmacokinetic (PBPK) parent-metabolite model of carbamazepine and its metabolite carbamazepine-10,11-epoxide, including carbamazepine autoinduction, to be applied for drug-drug interaction (DDI) prediction. The model was developed in PK-Sim, using a total of 92 plasma concentration-time profiles (dosing range 50-800 mg), as well as fractions excreted unchanged in urine measurements. The carbamazepine model applies metabolism by CYP3A4 and CYP2C8 to produce carbamazepine-10,11-epoxide, metabolism by CYP2B6 and UDP-glucuronosyltransferase (UGT) 2B7 and glomerular filtration. The carbamazepine-10,11-epoxide model applies metabolism by epoxide hydroxylase 1 (EPHX1) and glomerular filtration. Good DDI performance was demonstrated by the prediction of carbamazepine DDIs with alprazolam, bupropion, erythromycin, efavirenz and simvastatin, where 14/15 DDI AUClast ratios and 11/15 DDI Cmax ratios were within the prediction success limits proposed by Guest et al. The thoroughly evaluated model will be freely available in the Open Systems Pharmacology model repository.
Keywords: carbamazepine; carbamazepine-10,11-epoxide; cytochrome P450 2B6 (CYP2B6); cytochrome P450 3A4 (CYP3A4); drug–drug interactions (DDIs); induction; physiologically based pharmacokinetic (PBPK) modeling.
Conflict of interest statement
Thorsten Lehr has received research grants from the German Federal Ministry of Education and Research (grant 031L0161C). Laura Maria Fuhr, Fatima Zahra Marok, Nina Hanke and Dominik Selzer declare no conflict of interest. The funders had no role in the design of the study; in the collection, analyses, or interpretation of data; in the writing of the manuscript, or in the decision to publish the results.
Figures
Similar articles
-
A Physiologically Based Pharmacokinetic and Pharmacodynamic Model of the CYP3A4 Substrate Felodipine for Drug-Drug Interaction Modeling.Pharmaceutics. 2022 Jul 15;14(7):1474. doi: 10.3390/pharmaceutics14071474. Pharmaceutics. 2022. PMID: 35890369 Free PMC article.
-
Applying Physiologically Based Pharmacokinetic Modeling to Interpret Carbamazepine's Nonlinear Pharmacokinetics and Its Induction Potential on Cytochrome P450 3A4 and Cytochrome P450 2C9 Enzymes.Pharmaceutics. 2024 May 30;16(6):737. doi: 10.3390/pharmaceutics16060737. Pharmaceutics. 2024. PMID: 38931859 Free PMC article.
-
Physiologically Based Pharmacokinetic (PBPK) Modeling of Clopidogrel and Its Four Relevant Metabolites for CYP2B6, CYP2C8, CYP2C19, and CYP3A4 Drug-Drug-Gene Interaction Predictions.Pharmaceutics. 2022 Apr 22;14(5):915. doi: 10.3390/pharmaceutics14050915. Pharmaceutics. 2022. PMID: 35631502 Free PMC article.
-
Prediction of drug-drug interaction potential using physiologically based pharmacokinetic modeling.Arch Pharm Res. 2017 Dec;40(12):1356-1379. doi: 10.1007/s12272-017-0976-0. Epub 2017 Oct 27. Arch Pharm Res. 2017. PMID: 29079968 Review.
-
Drug interactions between emergency contraceptive drugs and cytochrome inducers: literature review and quantitative prediction.Fundam Clin Pharmacol. 2021 Apr;35(2):208-216. doi: 10.1111/fcp.12601. Epub 2020 Sep 7. Fundam Clin Pharmacol. 2021. PMID: 32813881 Review.
Cited by
-
A 5-Year Study of Antiseizure Medications (ASMs) Monitoring in Patients with Neuropsychiatric Disorders in an Italian Clinical Center.Pharmaceuticals (Basel). 2023 Jun 29;16(7):945. doi: 10.3390/ph16070945. Pharmaceuticals (Basel). 2023. PMID: 37513857 Free PMC article.
-
A Physiologically Based Pharmacokinetic and Pharmacodynamic Model of the CYP3A4 Substrate Felodipine for Drug-Drug Interaction Modeling.Pharmaceutics. 2022 Jul 15;14(7):1474. doi: 10.3390/pharmaceutics14071474. Pharmaceutics. 2022. PMID: 35890369 Free PMC article.
-
Alternatives to rifampicin: A review and perspectives on the choice of strong CYP3A inducers for clinical drug-drug interaction studies.Clin Transl Sci. 2022 Sep;15(9):2075-2095. doi: 10.1111/cts.13357. Epub 2022 Jul 25. Clin Transl Sci. 2022. PMID: 35722783 Free PMC article. Review.
-
The use of therapeutic drug monitoring to highlight an over-looked drug-drug interaction leading to imatinib treatment failure.Daru. 2023 Dec;31(2):267-272. doi: 10.1007/s40199-023-00465-z. Epub 2023 Jun 15. Daru. 2023. PMID: 37318715 Free PMC article.
-
A Unique In Vitro Assay to Investigate ABCB4 Transport Function.Int J Mol Sci. 2023 Feb 24;24(5):4459. doi: 10.3390/ijms24054459. Int J Mol Sci. 2023. PMID: 36901890 Free PMC article.
References
-
- U.S. Food and Drug Administration Drug Development and Drug Interactions. [(accessed on 3 March 2020)]; Available online: https://www.fda.gov/drugs/drug-interactions-labeling/drug-development-an....
-
- Pelkonen O., Myllynen P., Taavitsainen P., Boobis A.R., Watts P., Lake B.G., Price R.J., Renwick A.B., Gómez-Lechón M.J., Castell J.V., et al. Carbamazepine: A “blind” assessment of CYP-associated metabolism and interactions in human liver-derived in vitro systems. Xenobiotica. 2001;31:321–343. doi: 10.1080/00498250110055479. - DOI - PubMed
-
- Shahzadi A., Javed I., Aslam B., Muhammad F., Asi M.R., Ashraf M.Y., Ur-Rahman Z. Therapeutic effects of ciprofloxacin on the pharmacokinetics of carbamazepine in healthy adult male volunteers. Pak. J. Pharm. Sci. 2011;24:63–68. - PubMed
Grants and funding
LinkOut - more resources
Full Text Sources
Other Literature Sources
Miscellaneous
