. 2021 Feb 17;22(4):1989.
doi: 10.3390/ijms22041989.

Transcriptome Analysis of Subcutaneous Adipose Tissue from Severely Obese Patients Highlights Deregulation Profiles in Coding and Non-Coding Oncogenes

Affiliations

Transcriptome Analysis of Subcutaneous Adipose Tissue from Severely Obese Patients Highlights Deregulation Profiles in Coding and Non-Coding Oncogenes

Federica Rey et al. Int J Mol Sci. .

Abstract

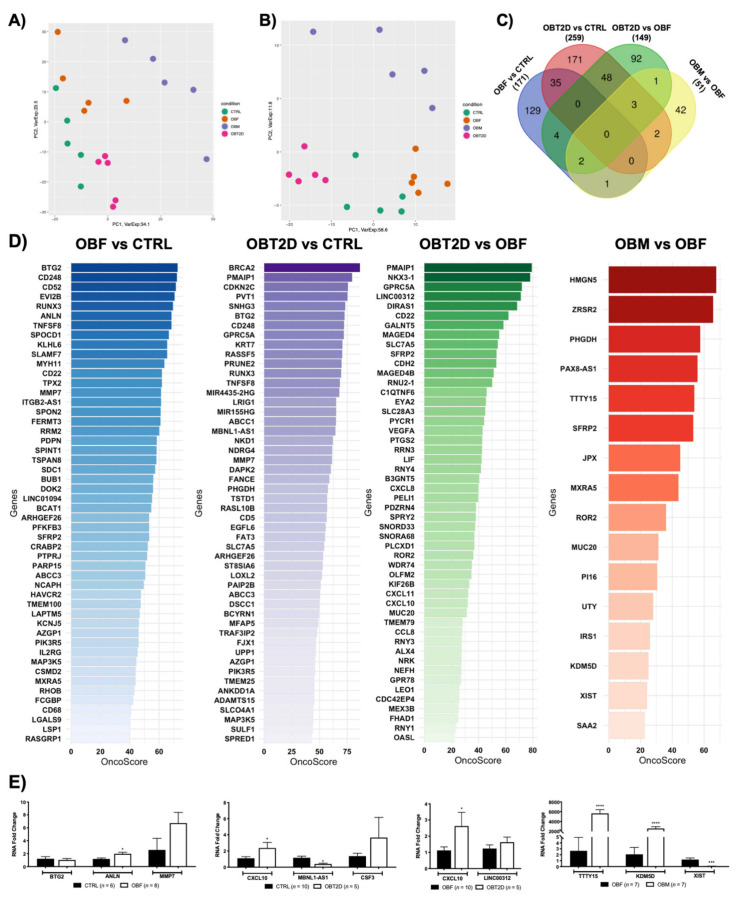
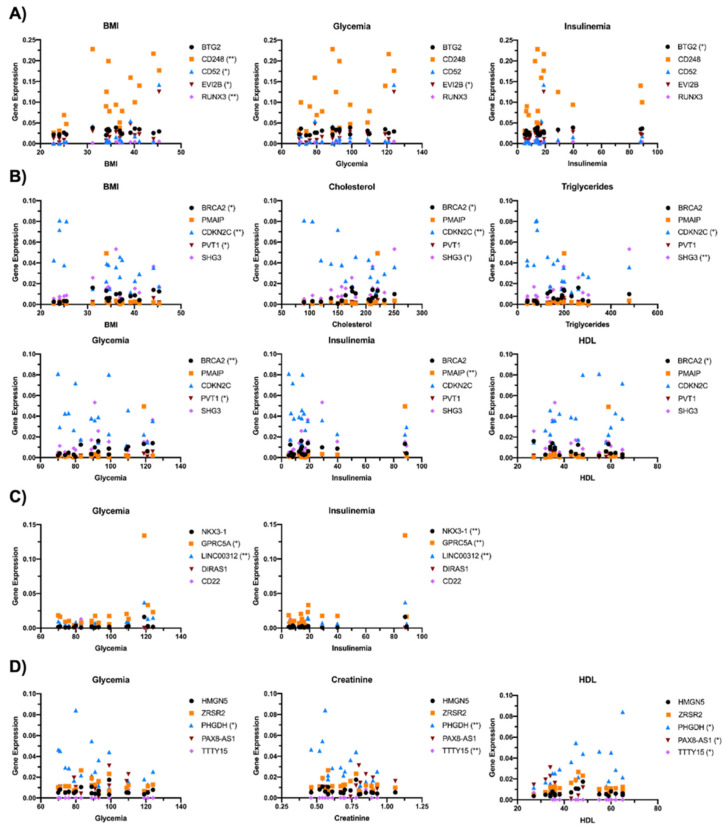
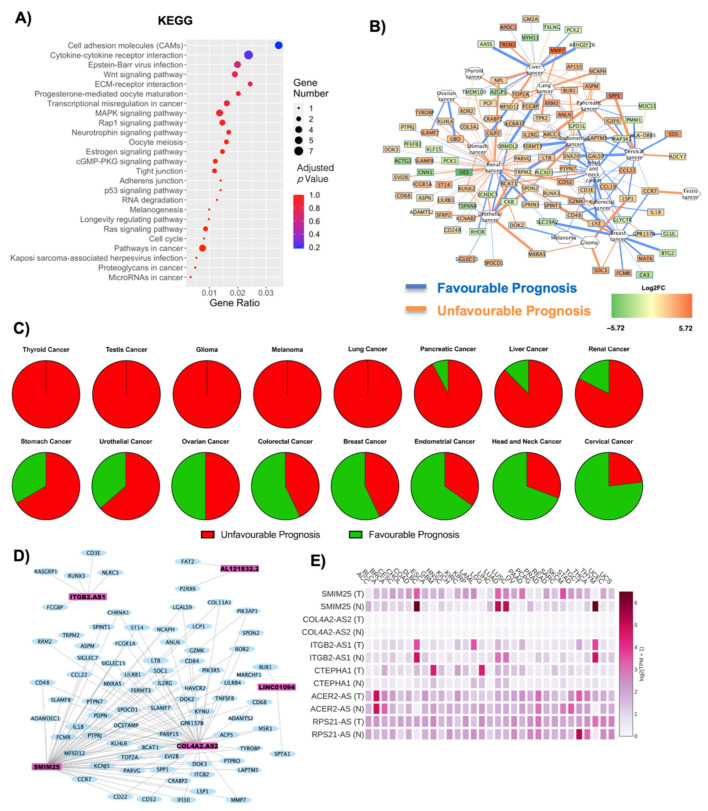
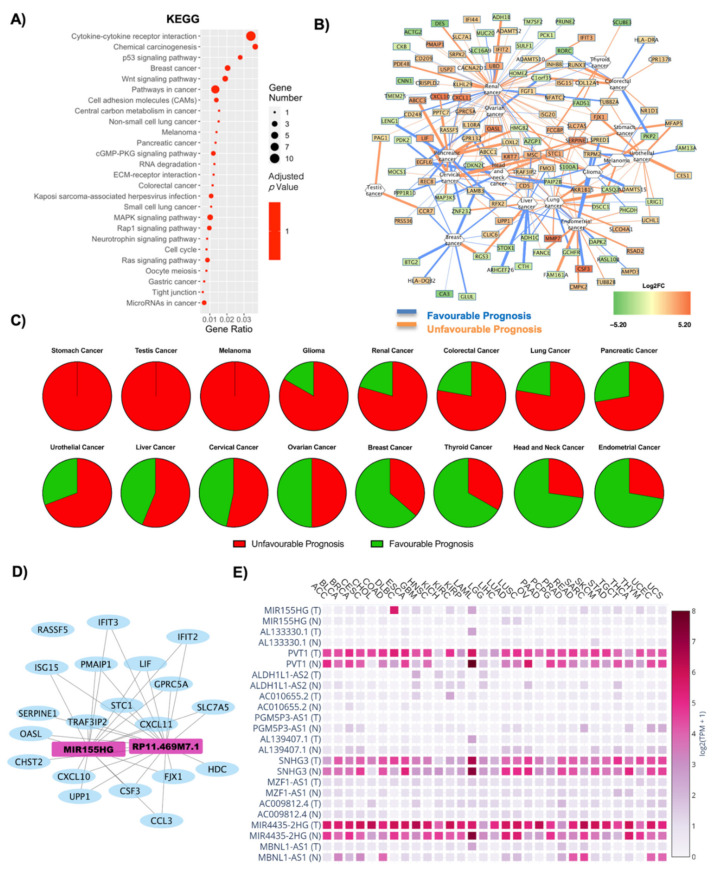
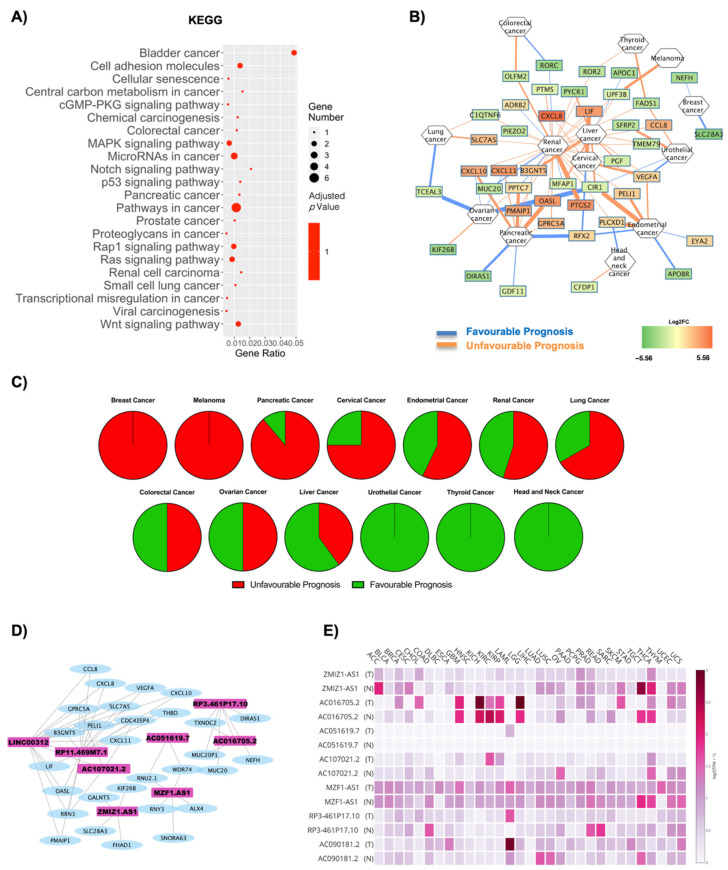
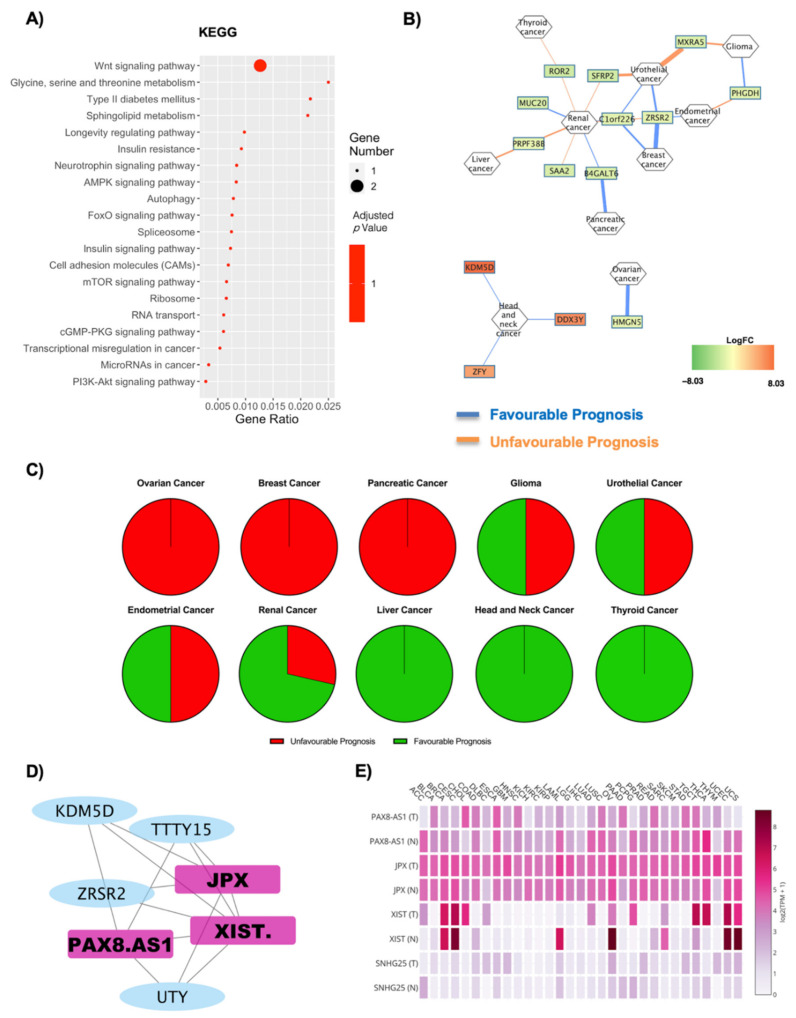
Obesity is a major risk factor for a large number of secondary diseases, including cancer. Specific insights into the role of gender differences and secondary comorbidities, such as type 2 diabetes (T2D) and cancer risk, are yet to be fully identified. The aim of this study is thus to find a correlation between the transcriptional deregulation present in the subcutaneous adipose tissue of obese patients and the oncogenic signature present in multiple cancers, in the presence of T2D, and considering gender differences. The subcutaneous adipose tissue (SAT) of five healthy, normal-weight women, five obese women, five obese women with T2D and five obese men were subjected to RNA-sequencing, leading to the identification of deregulated coding and non-coding RNAs, classified for their oncogenic score. A panel of DE RNAs was validated via Real-Time PCR and oncogene expression levels correlated the oncogenes with anthropometrical parameters, highlighting significant trends. For each analyzed condition, we identified the deregulated pathways associated with cancer, the prediction of possible prognosis for different cancer types and the lncRNAs involved in oncogenic networks and tissues. Our results provided a comprehensive characterization of oncogenesis correlation in SAT, providing specific insights into the possible molecular targets implicated in this process. Indeed, the identification of deregulated oncogenes also in SAT highlights hypothetical targets implicated in the increased oncogenic risk in highly obese subjects. These results could shed light on new molecular targets to be specifically modulated in obesity and highlight which cancers should receive the most attention in terms of better prevention in obesity-affected patients.

Keywords: cancer; gender; lncRNAs; obesity; oncogenes; transcriptional deregulation; type 2 diabetes.


Conflict of interest statement

The authors declare no conflict of interest.

Figures

Figure 1
Figure 1
Transcriptome analysis highlights different expression profiles in SAT (Subcutaneous Adipose Tissue) of obese patients. Samples from 5 healthy, normal-weight women (CTRL), 5 obese women (OBF), 5 obese women with T2D (OBT2D) and 5 obese men (OBM) were obtained and four conditions (OBF vs. CTRL, OBT2D vs. CTRL, OBT2D vs. OBF and OBF vs. OBM) were analyzed. (A) Principal Component Analysis (PCA) of differentially expressed genes (DE RNAs) in the four conditions. (B) PCA of non-coding DE RNAs. (C) 171 DE RNAs were identified for OBF vs. CTRL, 259 DE RNAs were identified for OBT2D vs. CTRL, 149 DE RNAs were identified for OBT2D vs. OBF and 51 DE RNAs were identified for OBF vs. OBM. The Venn diagram displays how many genes are shared amongst conditions (http://bioinformatics.psb.ugent.be/webtools/Venn/, last accessed on 15 February 2021). (D) The OncoScore library was used to detect which genes, amongst the DE RNAs for each condition, were correlated with cancer. The y-axis represents the name of the DE RNAs related to cancer, the x-axis represents the OncoScore, and the color fades as the genes decrease in ranking. (E) mRNA expression levels were evaluated by Real-Time PCR in the different datasets for CTRL vs. OBF, CTRL vs. OBT2D, OBF vs. OBT2D and OBF vs. OBM. Data are expressed as mean ± SEM. The number of patients analyzed for each condition is reported in the figure. * p <0.05, **** p <0.0001 vs. the respective control condition.
Figure 2
Figure 2
Correlation between the top 5 genes with the highest OncoScore and the subject’s anthropometrical parameters. The top 5 ranking oncogenes were correlated with Body Mass Index (BMI), cholesterol, triglycerides, glycemia, insulinemia, creatinine and High-Density Lipoproteins (HDL) (A) for obese women (OBF) vs. healthy controls (CTRL) (* p < 0.05; ** p < 0.01 vs. CTRL), (B) for obese women with type 2 diabetes (OBT2D) vs. CTRL (* p < 0.05; ** p < 0.01 vs. CTRL), (C) for OBT2D vs. OBF (* p < 0.05; ** p < 0.01 vs. OBF) and (D) for obese males (OBM) vs. OBF (* p < 0.05; ** p < 0.01 vs. OBF).
Figure 3
Figure 3
Cancer and oncogene correlations in OBF vs. CTRL conditions. (A) Dotplot of deregulated oncogenic pathways from KEGG analysis. The y-axis represents the name of the pathway, the x-axis represents the gene ratio, dot size represents the number of different genes and the color indicates the adjusted p-value. (B) Relationship between DE RNAs and the possibility of a cancer diagnosis. Nodes are DE RNAs and are ranked according to fold change whereas edges indicate disease prognosis and are colored according to favorable (light blue) and unfavorable (orange) prognosis. (C) Pie graph displays the overall unfavorable or favorable prognosis. (D) Co-interaction network between lncRNAs in OBF vs. CTRL and the oncogenes highlighted after OncoScore analysis. Light blue nodes are coding genes whereas pink nodes are lncRNAs. The coding and non-coding RNAs form 4 main networks of interaction, the largest of which includes both COL4A2-AS2 and SMIM25. On the contrary, ITGB2-AS1, LINC0194 (CTEPHA1) and AL121832.2 (RPS21-AS) formed each one separate interaction network. (E) The GEPIA2 database displays the specific annotated expression of each lncRNA in tumoral and normal tissues.
Figure 4
Figure 4
Cancer pathways and oncogene analysis in OBT2D vs. CTRL condition. (A) Dotplot of deregulated oncogenic pathways from KEGG analysis. The y-axis represents the name of the pathway, the x-axis represents the gene ratio, dot size represents the number of different genes and the color indicates the adjusted p-value. (B) Correlation network highlights the relationship between DE RNAs and the possibility of a cancer diagnosis. Nodes are DE RNAs and are ranked according to fold change whereas edges indicate disease prognosis and are colored according to favorable (light blue) and unfavorable (orange) prognosis. (C) Pie graph displays the overall unfavorable or favorable prognosis. (D) Co-interaction network between lncRNAs on OBT2D vs. CTRL and the oncogenes highlighted after OncoScore analysis. Light blue nodes are coding genes whereas pink nodes are lncRNAs. (D) The GEPIA2 database displays the specific annotated expression of each lncRNA in tumoral and normal tissues.
Figure 5
Figure 5
Cancer pathways and oncogene analysis in OBT2D vs. OBF. (A) Dotplot of deregulated oncogenic pathways from KEGG analysis. The y-axis represents the name of the pathway, the x-axis represents the gene ratio, dot size represents the number of different genes and the color indicates the adjusted p-value. (B) Nodes are DE RNAs and are ranked according to fold change whereas edges indicate disease prognosis and are colored according to favorable (light blue) and unfavorable (orange) prognosis. (C) Pie graph displays the overall unfavorable or favorable prognosis. (D) Co-interaction network between lncRNAs on OBT2D vs. OBF and the oncogenes highlighted after OncoScore analysis. Four networks were built, including a total of 8 lncRNAs. (E) The GEPIA2 database displays the specific annotated expression of each lncRNA in tumoral and normal tissues.
Figure 6
Figure 6
Cancer pathways and oncogene analysis concerning gender differences. (A) Dotplot of deregulated oncogenic pathways from KEGG analysis. The y-axis represents the name of the pathway, the x-axis represents the gene ratio, dot size represents the number of different genes and the color indicates the adjusted p-value. (B) Nodes are DE RNAs and are ranked according to fold change whereas edges indicate disease prognosis and are colored according to favorable (light blue) and unfavorable (orange) prognosis. (C) Pie graph displays the overall unfavorable or favorable prognosis. (D) Co-interaction network between lncRNAs on OBT2D vs. OBF and the oncogenes highlighted after OncoScore analysis. One main network was built, including a total of 3 lncRNAs: XIST, PAX8-AS1 and JPX. (E) The GEPIA2 database displays the specific annotated expression of each lncRNA in tumoral and normal tissues.

References

    1. WHO Obesity and Overweight. [(accessed on 15 February 2021)]; Available online: https://www.who.int/news-room/fact-sheets/detail/obesity-and-overweight.
    1. Jaacks L.M., Vandevijvere S., Pan A., McGowan C.J., Wallace C., Imamura F., Mozaffarian D., Swinburn B., Ezzati M. The obesity transition: Stages of the global epidemic. Lancet Diabetes Endocrinol. 2019;7:231–240. doi: 10.1016/S2213-8587(19)30026-9. - DOI - PMC - PubMed
    1. Haslam D., Sattar N., Lean M. ABC of obesity. Obesity—Time to wake up. BMJ. 2006;333:640–642. doi: 10.1136/bmj.333.7569.640. - DOI - PMC - PubMed
    1. Lawrence V.J., Kopelman P.G. Medical consequences of obesity. Clin. Derm. 2004;22:296–302. doi: 10.1016/j.clindermatol.2004.01.012. - DOI - PubMed
    1. De Pergola G., Silvestris F. Obesity as a major risk factor for cancer. J. Obes. 2013;2013:291546. doi: 10.1155/2013/291546. - DOI - PMC - PubMed

MeSH terms

Substances