. 2021 Feb 17;22(4):1995.
doi: 10.3390/ijms22041995.

G-Quadruplex Structures Colocalize with Transcription Factories and Nuclear Speckles Surrounded by Acetylated and Dimethylated Histones H3

Affiliations

G-Quadruplex Structures Colocalize with Transcription Factories and Nuclear Speckles Surrounded by Acetylated and Dimethylated Histones H3

Denisa Komůrková et al. Int J Mol Sci. .

Abstract

G-quadruplexes (G4s) are four-stranded helical structures that regulate several nuclear processes, including gene expression and telomere maintenance. We observed that G4s are located in GC-rich (euchromatin) regions and outside the fibrillarin-positive compartment of nucleoli. Genomic regions around G4s were preferentially H3K9 acetylated and H3K9 dimethylated, but H3K9me3 rarely decorated G4 structures. We additionally observed the variability in the number of G4s in selected human and mouse cell lines. We found the highest number of G4s in human embryonic stem cells. We observed the highest degree of colocalization between G4s and transcription factories, positive on the phosphorylated form of RNA polymerase II (RNAP II). Similarly, a high colocalization rate was between G4s and nuclear speckles, enriched in pre-mRNA splicing factor SC-35. PML bodies, the replication protein SMD1, and Cajal bodies colocalized with G4s to a lesser extent. Thus, G4 structures seem to appear mainly in nuclear compartments transcribed via RNAP II, and pre-mRNA is spliced via the SC-35 protein. However, α-amanitin, an inhibitor of RNAP II, did not affect colocalization between G4s and transcription factories as well as G4s and SC-35-positive domains. In addition, irradiation by γ-rays did not change a mutual link between G4s and DNA repair proteins (G4s/γH2AX, G4s/53BP1, and G4s/MDC1), accumulated into DNA damage foci. Described characteristics of G4s seem to be the manifestation of pronounced G4s stability that is likely maintained not only via a high-order organization of these structures but also by a specific histone signature, including H3K9me2, responsible for chromatin compaction.

Keywords: DNA repair; G-quadruplex structure; epigenetics; nuclear bodies; nuclear speckles; transcription factories.


Conflict of interest statement

The authors have declared that there are no conflict of interest.

Figures

Figure 1
Figure 1
Optimization of G-quadruplexes (G4s) detection. Samples were treated by (A) Turbo-DNAse or (B) RNase for 30 min at 37 °C, and after immunofluorescence (Anti-DNA G-quadruplex (G4) Antibody, clone 1H6 was used), the presence/absence of G4s structures (red) was analyzed inside interphase nuclei (blue). In both panels, cells were additionally visualized in transmission light (the bright field microscopy). Scale bars indicate 20 µm.
Figure 2
Figure 2
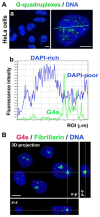
G4 structures (green) were located in (Aa) 4’,6-diamidino-2-phenylindole (DAPI)-poor chromatin (blue), as it was quantified according to (Ab) fluorescence intensity by the Leica LAS X software. (B) G4 structures (red) do not colocalize with the fibrillarin-positive region of nucleoli (green). DAPI (blue) staining was used for visualization of the cell nuclei that are shown in the 3D-projection of the confocal image. Scale bars show 10 μm.
Figure 3
Figure 3
Histone signature of G4 structures in HeLa cells. (A) G4s (red) structures were associated with acetylated histones H4 (green). (B) G4s (red) and H3K9ac (green). (C) G4s (red) and H3K9me2 (green). (D) G4s (red) and H3K9me3 (green). DAPI (blue) was used as a counterstaining of the cell nucleus. Scale bars represent 3 µm in panels A, C and 1 μm in panels B, D. Arrows show enlarged selected cells or selected regions inside cell nuclei. Panels show the rate of colocalization between G4s and H4ac, G4s and H3K9ac, G4s and H3K9me2, G4s and H3K9me3. Panel (E) illustrates data documenting colocalization rate and its average values. Panel (F) shows the colocalization rate in terms of median values. Data are presented as a colocalization rate with standard errors (S.E.). The normality test (Shapiro–Wilk) passed for comparison of G4s/H4ac and G4s/H3K9me3. In this case, the difference in the mean values of the two groups was greater than would be expected by chance; there is a statistically significant difference between the input groups (p ≤ 0.001). The Student’s t-test revealed statistically significant differences, as indicated by asterisks (*). As reference values, the colocalization rates of G4s/H3K9me3 were used. The normality test (Shapiro–Wilk) failed for H3K9ac (H3K9me2) and H3K9me3, but the Mann–Whitney rank sum test showed that the difference in the median values between the two groups was greater than would be expected by chance; there was a statistically significant difference (p ≤ 0.001).
Figure 4
Figure 4
Nuclear distribution of G4s in distinct cell types. (A) Confocal microscopy of G4s in the following cell types: HaCaT, HeLa, hESCs, and MEFs. (B) Analysis of the number of G4s per nuclear volume of individual cells studied in panel (A). For analysis, we used 30–40 cell nuclei (experiments were repeated three times). Leica LAS X software was used for data analysis. Lines inside box plots show medians; 50% of the data is inside the box plots, and line segments show border values. Data are shown as the average number of G4s foci ± standard errors (S.E.). Bars show the lowest and highest value. When using the Student’s t-test, the normality test (Shapiro–Wilk) failed (p < 0.050), but the Mann–Whitney rank sum test revealed that the difference in the median values between the two groups (HaCaT and hESCs) is greater than would be expected by chance; there was a statistically significant difference (p ≤ 0.001). A statistically significant difference is indicated by an asterisk (*). As a reference value, the number of G4s in HaCaT cells was used.
Figure 5
Figure 5
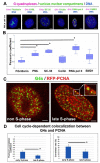
The spatial relationship between G4s and nucleoli, PML bodies, SC35-positive nuclear speckles, Cajal bodies, RNAP II-positive transcription factories, and PCNA-positive replication foci. (A) The nuclear distribution pattern of G4s (red) and fibrillarin (green), PML nuclear bodies (green), the SC35 protein (green), the coilin protein (green), phosphorylated form of RNAP II (green), and the SMD1 protein is shown. (B) Analysis of a degree of colocalization between G4s and nuclear compartments. In the cases indicated by an asterisk (*), the equal variance test (Brown–Forsythe) passed, similarly, the normality test (Shapiro–Wilk), so that the Student’s t-test showed the difference in the mean values of the two groups as greater than would be expected by chance; there is a statistically significant difference between the input groups (p ≤ 0.001). As a reference, the Pearson’s correlation coefficient was used for those observed for G4s and fibrillarin. Bars show the lowest and highest level of the Pearson’s correlation coefficient. Data in panel B represent the median of the Pearson’s correlation coefficient with minimal and maximal values. (C) The reciprocal link between G4s and PCNA-positive foci in non-S phase cells and the late S-phase of the cell cycle. Data originate from 30–40 nuclei analyzed for each experimental event. In panel (D), the Mann–Whitney U test was used for the statistical analysis, showing differences between G4s colocalization with PCNA-positive replication foci in the early S-phase and the late S-phase of the cell cycle. Asterisks indicate statistically significant differences at α = 0.05.
Figure 6
Figure 6
Colocalization between G4s and SC35-positive nuclear speckles or G4s and RNAP II-positive transcription factories was not affected by the inhibitor of RNAP II, α-amanitin. Data are shown as the median of the Pearson’s correlation coefficient with minimal and maximal values. Bars show the lowest and highest values of the Pearson’s correlation coefficient. The Mann–Whitney U test was used for the statistical analysis. The test revealed that differences between measurements are not statistically significant.
Figure 7
Figure 7
Irradiation by γ-rays does not change the γH2AX-, 53BP1-, MDC1-positivity in G4 structures, as shown in panels (AC), in HeLa and HaCaT cells. Data in panels (A,B) originate from experiments performed by the use of BG4 antibody, and for data in panels (C,D), we used 1H6 antibody. Panel (D) shows the number of G4s/nuclear volume calculated in nonirradiated and γ-irradiated cells. Scale bars show 5 µm. The Mann–Whitney U test was used for the statistical analysis, but no significant differences were observed in G4s and DNA repair proteins studied in nonirradiated and γ-irradiated cells. The difference in the median values between the two groups (nonirradiated and irradiated cells) is not great enough to exclude the possibility that the difference is due to random sampling variability; there were no statistically significant differences (p = 1.000).
Figure 8
Figure 8
Example of the degree of colocalization between shelterin protein TRF1 (green), associated with telomeres, and G4 (red) structures in HeLa cells. Data were analyzed by Leica LAS X software and originate from one selected confocal section; thus, only several telomeres (green) are visible. (A) Confocal images show the distribution profile of GFP-tagged TRF1 (green) and G4s structures (red). Scale bar shows 5 μm. (B) The scatter plot (Leica LAS X software) shows a low degree of colocalization between the TRF1 protein and G4s.

Similar articles

Cited by

References

    1. Gellert M., Lipsett M.N., Davies D.R. Helix Formation by Guanylic Acid. Proc. Natl. Acad. Sci. USA. 1962;48:2013–2018. doi: 10.1073/pnas.48.12.2013. - DOI - PMC - PubMed
    1. Sen D., Gilbert W. Formation of Parallel Four-Stranded Complexes by Guanine-Rich Motifs in DNA and Its Implications for Meiosis. Nature. 1988;334:364–366. doi: 10.1038/334364a0. - DOI - PubMed
    1. Burge S., Parkinson G.N., Hazel P., Todd A.K., Neidle S. Quadruplex DNA: Sequence, Topology and Structure. Nucleic Acids Res. 2006;34:5402–5415. doi: 10.1093/nar/gkl655. - DOI - PMC - PubMed
    1. Moye A.L., Porter K.C., Cohen S.B., Phan T., Zyner K.G., Sasaki N., Lovrecz G.O., Beck J.L., Bryan T.M. Telomeric G-Quadruplexes Are a Substrate and Site of Localization for Human Telomerase. Nat. Commun. 2015;6:7643. doi: 10.1038/ncomms8643. - DOI - PMC - PubMed
    1. Fajkus P., Peška V., Závodník M., Fojtová M., Fulnečková J., Dobias Š., Kilar A., Dvořáčková M., Zachová D., Nečasová I., et al. Telomerase RNAs in Land Plants. Nucleic Acids Res. 2019;47:9842–9856. doi: 10.1093/nar/gkz695. - DOI - PMC - PubMed

LinkOut - more resources