. 2021 Feb 17;22(4):1997.
doi: 10.3390/ijms22041997.

Activation of Apoptosis in a βB1-CTGF Transgenic Mouse Model

Affiliations

Activation of Apoptosis in a βB1-CTGF Transgenic Mouse Model

Maximilian Weiss et al. Int J Mol Sci. .

Abstract

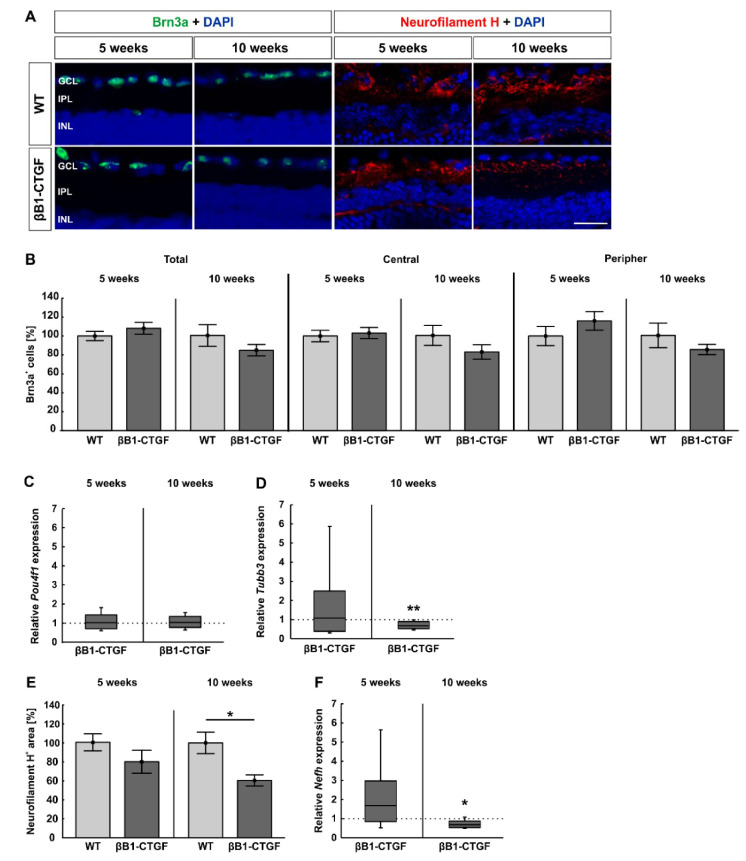
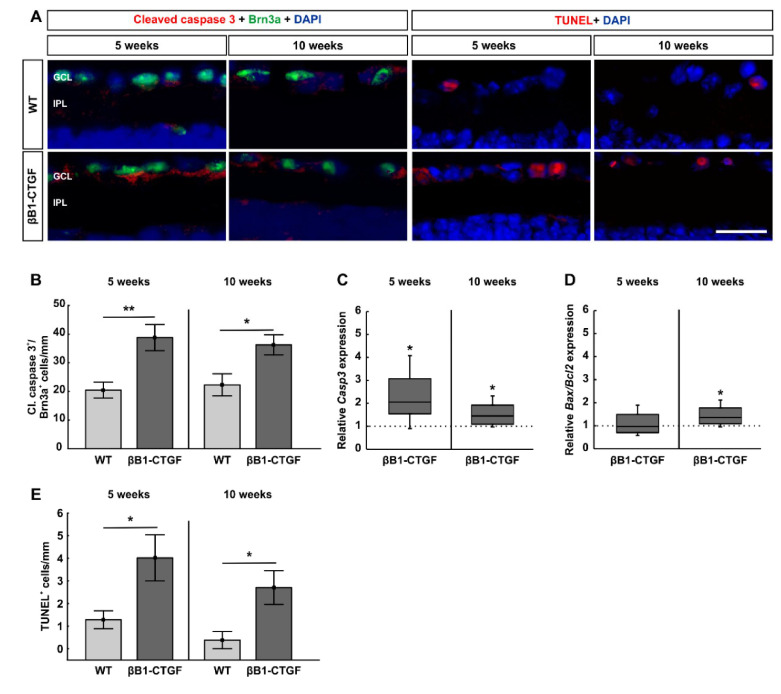
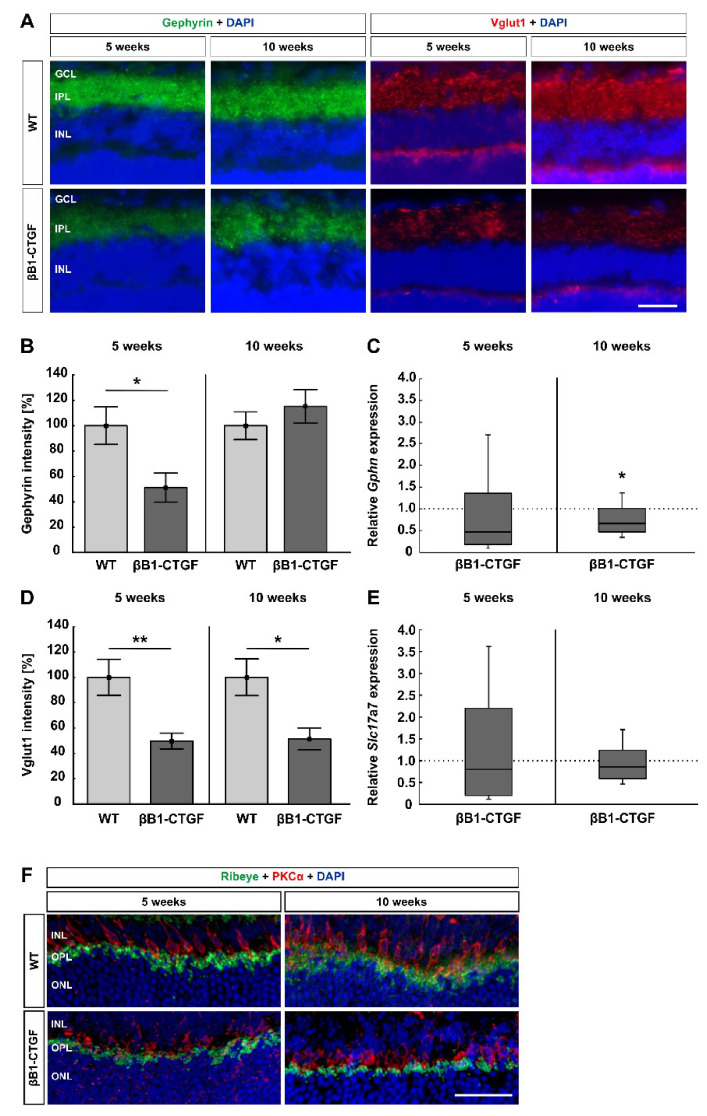
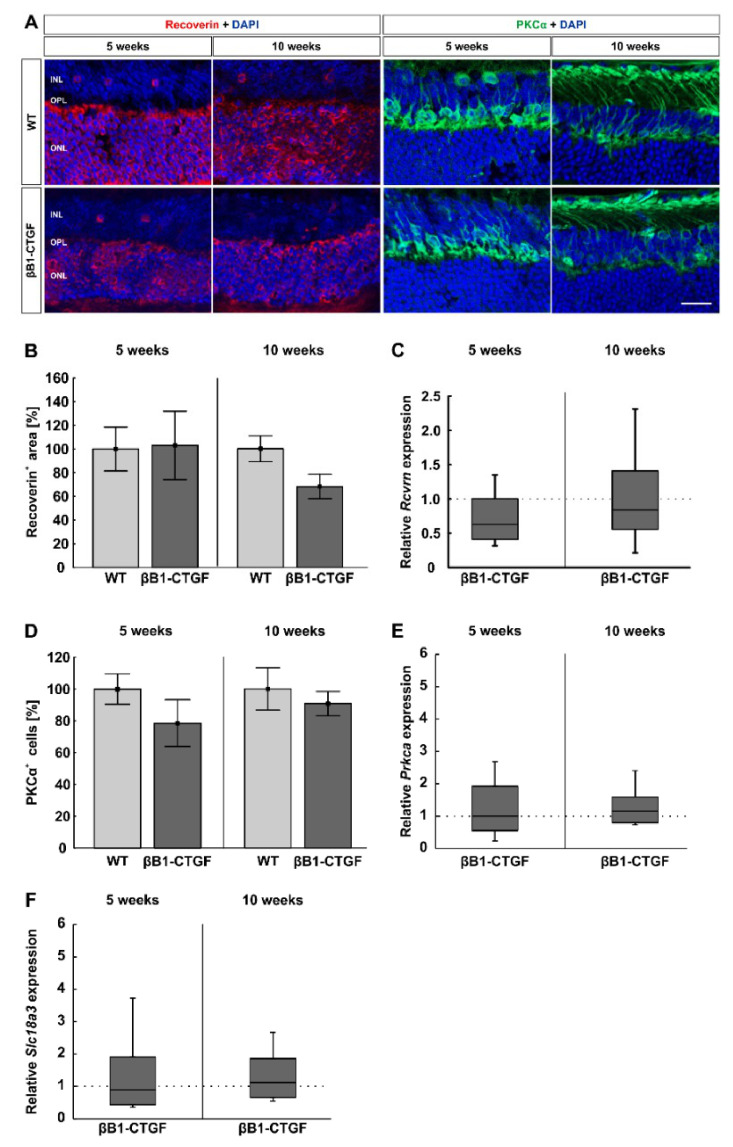
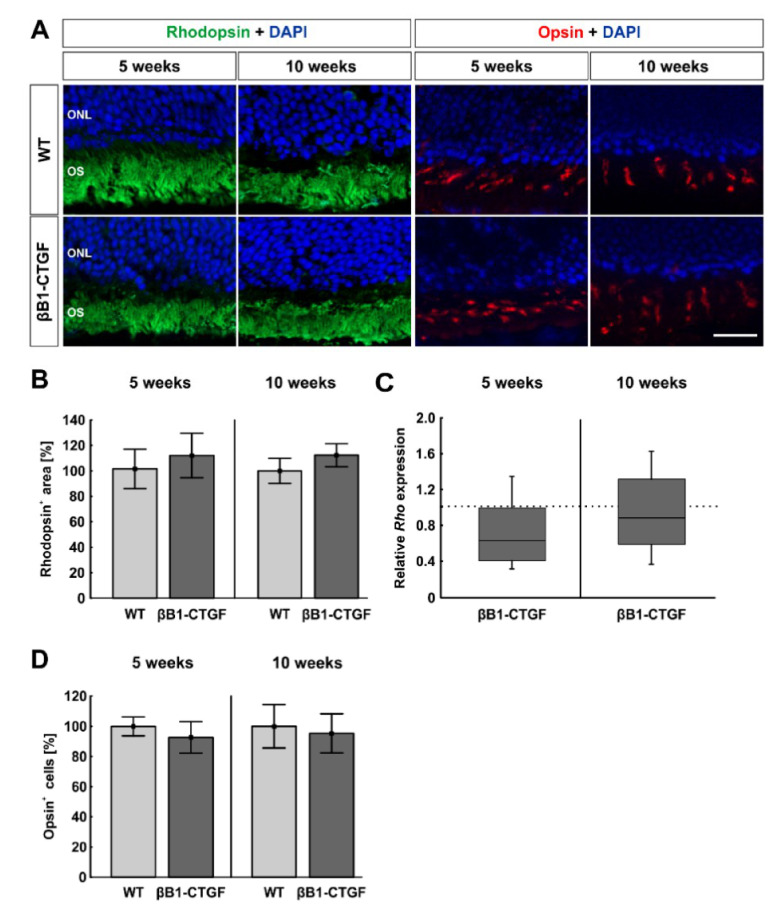
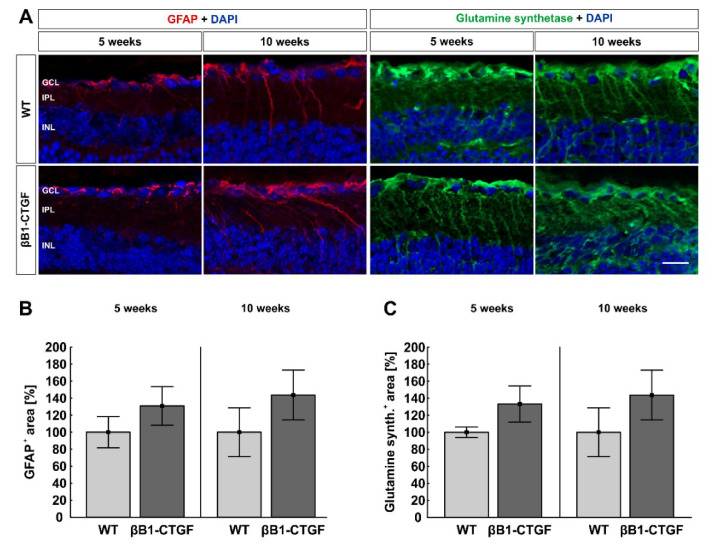
To reveal the pathomechanisms of glaucoma, a common cause of blindness, suitable animal models are needed. As previously shown, retinal ganglion cell and optic nerve degeneration occur in βB1-CTGF mice. Here, we aimed to determine possible apoptotic mechanisms and degeneration of different retinal cells. Hence, retinae were processed for immunohistology (n = 5-9/group) and quantitative real-time PCR analysis (n = 5-7/group) in 5- and 10-week-old βB1-CTGF and wildtype controls. We noted significantly more cleaved caspase 3+ cells in βB1-CTGF retinae at 5 (p = 0.005) and 10 weeks (p = 0.02), and a significant upregulation of Casp3 and Bax/Bcl2 mRNA levels (p < 0.05). Furthermore, more terminal deoxynucleotidyl transferase-mediated dUTP nick end labeling (TUNEL+) cells were detected in transgenic mice at 5 (p = 0.03) and 10 weeks (p = 0.02). Neurofilament H staining (p = 0.01) as well as Nefh (p = 0.02) and Tubb3 (p = 0.009) mRNA levels were significantly decreased at 10 weeks. GABAergic synapse intensity was lower at 5 weeks, while no alterations were noted at 10 weeks. The glutamatergic synapse intensity was decreased at 5 (p = 0.007) and 10 weeks (p = 0.01). No changes were observed for bipolar cells, photoreceptors, and macroglia. We conclude that apoptotic processes and synapse loss precede neuronal death in this model. This slow progression rate makes the βB1-CTGF mice a suitable model to study primary open-angle glaucoma.

Keywords: Bax/Bcl2; apoptosis; caspase 3; neurofilament H; primary open-angle glaucoma; synapse; βB1-CTGF.


Conflict of interest statement

The authors declare no conflict of interest.

Figures

Figure 1
Figure 1
Loss of neurofilament H. (A) Retinae were stained with antibodies against Brn-3a (green) and neurofilament H (red) at 5 and 10 weeks (n = 5–8/group). Cell nuclei were visualized with 4′,6 diamidino-2-phenylindole (DAPI) (blue). (B) The number of Brn3a+ cells remained unaltered in βB1-CTGF retinae in comparison to wildtype (WT) at 5 and 10 weeks of age in the total as well as in the central and peripheral retina. (C) RT-qPCR analyses were performed regarding the mRNA expression levels of the retinal ganglion cell (RGC) marker Pou4f1 at both ages (n = 5–7/group). In accordance with the immunohistological results, no alterations in Pou4f1 expression levels were noted in βB1-CTGF animals at the age of 5 and 10 weeks compared to in WT. (D) RT-qPCR analyses of Tubb3 were performed in 5- and 10-week-old βB1-CTGF and WT mice (n = 5/group). At 5 weeks, no changes were seen in Tubb3 mRNA expression levels. In contrast, a significant downregulation of Tubb3 mRNA was revealed in transgenic mice at 10 weeks of age (p = 0.09). (E) At 5 weeks, the staining area of neurofilament H remained unchanged in transgenic and WT animals. In contrast, a significant decrease in the neurofilament H+ area was detected in βB1-CTGF mice (p = 0.01). (F) The mRNA levels of Nefh (n = 5/group) were not altered in 5-week-old transgenic mice. However, a significant downregulation of Nefh mRNA levels was observed in βB1-CTGF mice at 10 weeks (p = 0.02). Abbreviations: GCL = ganglion cell layer, IPL = inner plexiform layer, INL = inner nuclear layer. Values are mean ± SEM for immunohistology and median ± quartile + maximum/minimum for RT-qPCR. The dotted lines in C, D, and F represent the relative expression levels of the WT group. Scale bar: 20 μm. * p < 0.05, ** p < 0.01.
Figure 2
Figure 2
Increased apoptosis rate in retinal ganglion cells. (A) Retinae were stained with the apoptosis marker cleaved caspase 3 (red) in combination with Brn3a (green) at 5 and 10 weeks (n = 7–8/group). Furthermore, apoptotic cells were visualized using terminal deoxynucleotidyl transferase-mediated dUTP nick end labeling (TUNEL) staining (n = 5/group). Cell nuclei were visualized with DAPI (blue). (B) Significantly more cleaved caspase 3+ RGCs were revealed in βB1-CTGF mice compared to in WT animals at 5 (p = 0.005) and 10 weeks (p = 0.02). (C) The mRNA expression levels of Casp3 were upregulated at 5 (p = 0.02) and 10 weeks (p = 0.03). (D) At 5 weeks, the mRNA expression levels of Bax/Bcl2 were not altered in βB1-CTGF mice. In contrast, a significant upregulation of Bax/Bcl2 levels was noted in 10-week-old transgenic animals (p = 0.04). (E) A higher number of TUNEL+ apoptotic cells in the ganglion cell layer was reveled in 5- (p = 0.03) and 10-week-old βB1-CTGF mice compared to in WT (p = 0.02). Abbreviations: GCL = ganglion cell layer, IPL = inner plexiform layer. Values are mean ± SEM for immunohistology and median ± quartile + maximum/minimum for RT-qPCR. The dotted lines in C and D represent the relative expression levels of the WT group. Scale bar: 20 μm. * p < 0.05, ** p < 0.01.
Figure 3
Figure 3
Loss of synapses. (A) GABAergic synapses were labeled using gephyrin (green) and glutamatergic synapses were stained with Vglut1 (red), while cell nuclei were counterstained with DAPI (blue) at 5 and 10 weeks of age (n = 7–8/group). (B) At 5 weeks of age, a significantly decreased gephyrin+ intensity was revealed in βB1-CTGF mice (p = 0.02). At 10 weeks, the staining intensity reverted to the WT level. (C) The mRNA expression levels of Gphn (n = 5–7/group) showed no changes at 5 weeks, but a significant downregulation was shown in 10-week-old βB1-CTGF mice (p = 0.02). (D) Regarding Vglut1 staining, significantly decreased immunoreactivity was noted in transgenic mice at 5 (p = 0.007) and 10 weeks of age (p = 0.01). (E) RT-qPCR analyses detected no alterations in Slc17a7 (Vglut1) mRNA expression levels at both points in time (n = 5–7/group). (F) Exemplary, retinal cross sections were labeled with antibodies against ribeye (ribbon synapses; green) and PKCα (rod bipolar cells; red). DAPI counterstained cell nuclei (blue). At 5 and 10 weeks, βB1-CTGF and WT mice displayed distinct co-staining of both markers in the inner plexiform and outer plexiform layer. In the WT animals at both ages, the co-staining was more intense compared to transgenic mice. Abbreviations: GCL = ganglion cell layer, IPL = inner plexiform layer, INL = inner nuclear layer, OPL = outer plexiform layer, ONL = outer nuclear layer. Values are mean ± SEM for immunohistology and median ± quartile + maximum/minimum for RT-qPCR. The dotted lines in C and E represent the relative expression levels of the WT group. Scale bars: 20 μm. * p < 0.05, ** p < 0.01.
Figure 4
Figure 4
No alterations in the number of bipolar cells. (A) Cone bipolar cells were evaluated by using recoverin (red) and rod bipolar cells using PKCα staining (green; n = 7–9/group). Cell nuclei were labeled with DAPI (blue). (B) The analysis of the recoverin+ area revealed no significant difference in staining area in βB1-CTGF animals at 5 weeks. At the age of 10 weeks, there was a trend towards smaller cone, bipolar cell areas in βB1-CTGF mice compared to in WT mice (p = 0.052). (C) The Rcvrn mRNA expression levels were comparable between βB1-CTGF and WT animals at both ages (n = 5–7/group). (D) PKCα+ cell numbers were not altered in βB1-CTGF retinae compared to in WT at 5 and 10 weeks. (E) RT-qPCR analyses of Prkca mRNA expression levels showed no alterations at 5 and 10 weeks of age. (F) Additionally, the mRNA levels of Slc18a3 (encoding for the vesicular acetylcholine transporter) were not altered in 5- and 10-week-old βB1-CTGF animals. Abbreviations: INL = inner nuclear layer, OPL = outer plexiform layer, ONL = outer nuclear layer. Values are mean ± SEM for immunohistology and median ± quartile + maximum/minimum for RT-qPCR. The dotted lines in C, E, and F represent the relative expression levels of the WT group. Scale bar: 20 µm.
Figure 5
Figure 5
Photoreceptors remain unaffected. (A) Rhodopsin (rods, green) and opsin (L-cones, red) staining of retinal sections were performed to evaluate photoreceptors (n = 7–9/group). DAPI was added to visualize cell nuclei (blue). (B) Comparable rhodopsin+ areas were detected in both groups at 5 and 10 weeks of age. (C) The RT-qPCR results showed no alteration in Rho mRNA expression levels in βB1-CTGF mice at the age of 5 and 10 weeks (n = 5–7/group). (D) The number of opsin+ cells remained unaltered in βB1-CTGF animals compared to in WT at both ages. Abbreviations: ONL = outer nuclear layer, OS = outer segment. Values are mean ± SEM for immunohistology and median ± quartile + maximum/minimum for RT-qPCR. The dotted line in C represents the relative expression level of the WT group. Scale bar: 20 µm.
Figure 6
Figure 6
No macroglia reaction. (A) Macroglia were analyzed using GFAP (red) and glutamine synthetase (green) at 5 and 10 weeks (n = 7–9/group). DAPI (blue) visualized cell nuclei. (B) The GFAP area analysis showed a similar GFAP signal area in βB1-CTGF retinae and WT retinae at 5 and 10 weeks. (C) Regarding glutamine synthetase, we observed no difference in the staining area in βB1-CTGF mice compared to in WT at both ages. Abbreviations: GCL = ganglion cell layer, IPL = inner plexiform layer, INL = inner nuclear layer. Values are mean ± SEM. Scale bar: 20 µm.

Similar articles

Cited by

References

    1. Flaxman S.R., Bourne R.R.A., Resnikoff S., Ackland P., Braithwaite T., Cicinelli M.V., Das A., Jonas J.B., Keeffe J., Kempen J.H., et al. Global causes of blindness and distance vision impairment 1990–2020: A systematic review and meta-analysis. Lancet Global Health. 2017;5:e1221–e1234. doi: 10.1016/S2214-109X(17)30393-5. - DOI - PubMed
    1. Tezel G., Wax M.B. Glaucoma. Chem. Immunol. Allergy. 2007;92:221–227. - PMC - PubMed
    1. Kerrigan-Baumrind L.A., Quigley H.A., Pease M.E., Kerrigan D.F., Mitchell R.S. Number of ganglion cells in glaucoma eyes compared with threshold visual field tests in the same persons. Invest. Ophthalmol. Vis. Sci. 2000;41:741–748. - PubMed
    1. EGS European Glaucoma Society Terminology and Guidelines for Glaucoma, 4th Edition—Chapter 2: Classification and Terminology. Br. J. Ophthalmol. 2017;101:73–127. doi: 10.1136/bjophthalmol-2016-EGSguideline.002. - DOI - PMC - PubMed
    1. Harwerth R.S., Wheat J.L., Fredette M.J., Anderson D.R. Linking structure and function in glaucoma. Prog. Retin Eye Res. 2010;29:249–271. doi: 10.1016/j.preteyeres.2010.02.001. - DOI - PMC - PubMed

Substances

LinkOut - more resources