. 2021 Feb 22;10(2):408.
doi: 10.3390/plants10020408.

Integrative Taxonomy and Molecular Phylogeny of the Plant-Parasitic Nematode Genus Paratylenchus (Nematoda: Paratylenchinae): Linking Species with Molecular Barcodes

Affiliations

Integrative Taxonomy and Molecular Phylogeny of the Plant-Parasitic Nematode Genus Paratylenchus (Nematoda: Paratylenchinae): Linking Species with Molecular Barcodes

Phougeishangbam Rolish Singh et al. Plants (Basel). .

Abstract

Pin nematodes of the genus Paratylenchus are obligate ectoparasites of a wide variety of plants that are distributed worldwide. In this study, individual morphologically vouchered nematode specimens of fourteen Paratylenchus species, including P. aculentus, P. elachistus, P. goodeyi, P. holdemani, P. idalimus, P. microdorus, P. nanus, P. neoamblycephalus, P. straeleni and P. veruculatus, are unequivocally linked to the D2-D3 of 28S, ITS, 18S rRNA and COI gene sequences. Combined with scanning electron microscopy and a molecular analysis of an additional nine known and thirteen unknown species originating from diverse geographic regions, a total of 92 D2-D3 of 28S, 41 ITS, 57 18S rRNA and 111 COI new gene sequences are presented. Paratylenchus elachistus, P. holdemani and P. neoamblycephalus are recorded for the first time in Belgium and P. idalimus for the first time in Europe. Paratylenchus is an excellent example of an incredibly diverse yet morphologically minimalistic plant-parasitic genus, and this study provides an integrated analysis of all available data, including coalescence-based molecular species delimitation, resulting in an updated Paratylenchus phylogeny and the corrective reassignment of 18 D2-D3 of 28S, 3 ITS, 3 18S rRNA and 25 COI gene sequences that were previously unidentified or incorrectly classified.

Keywords: 18S; COI; D2-D3 of 28S; ITS; Paratylenchus; morphology; morphometrics; phylogeny; plant-parasitic nematodes; taxonomy.


Conflict of interest statement

The authors declare no conflict of interest.

Figures

Figure 1
Figure 1
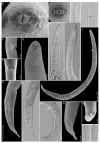
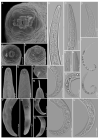
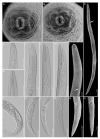
Light and scanning electron microscopy images of Paratylenchus aculentus females: (A) face view; (B,D,E) anterior region; (C,J) total body; (G) vulva region; (F,H,I) tail region.
Figure 2
Figure 2
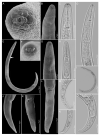
Light and scanning electron microscopy images of Paratylenchus elachistus females: (A,B) face view; (C,D,GI) anterior region; (E,F) vulva region; (J) total body; (KQ) tail region; arrows pointed to deirid in (J) and spermatheca in (M).
Figure 3
Figure 3
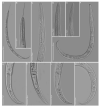
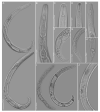
Light microscopy images of Paratylenchus goodeyi females: (A,B) total body; (CG) anterior region; (H,I) lateral field; (JL) tail region; arrows pointed to spermatheca in A, protruding submedian lobe in G and post-vulva sac in K.
Figure 4
Figure 4
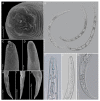
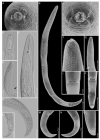
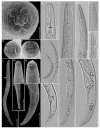
Light and scanning electron microscopy images of Paratylenchus holdemani females: (A,F) face view; (BD,G,H) anterior region; (E,I) total body; (JO) tail region; arrow pointed to deirid in (E).
Figure 5
Figure 5
Light microscopy images of Paratylenchus idalimus females from sample BE19: (A) total body; (BD) anterior region; (EG) lateral field and tail region; arrow pointed to secretory–excretory pore in D.
Figure 6
Figure 6
Light microscopy images of Paratylenchus idalimus females from sample BE20: (A,F) total body; (BE) anterior region; (GJ) tail region.
Figure 7
Figure 7
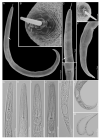
Light and scanning electron microscopy images of Paratylenchus microdorus females: (A) face view; (B) total body; (CF) anterior region; (GJ) tail region.
Figure 8
Figure 8
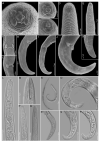
Light and scanning electron microscopy images of Paratylenchus nanus females: (A,E,F,L) face view; (BD,G,H,J,K,M) anterior region; (I) total body; (N,O,PU) tail region.
Figure 9
Figure 9
Light and scanning electron microscopy images of Paratylenchus neoamblycephalus females: (A,C) face view; (B) total body; (DH) anterior region; (IO) tail region; arrows pointed to secretory–excretory pore in (H) and deirid in (G).
Figure 10
Figure 10
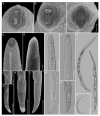
Light and scanning electron microscopy images of Paratylenchus straeleni females: (A) whole body; (B,D) face view; (C,GJ) anterior region; (E) vulva region; (F,K,L) tail region; (M) total body; arrows pointed to deirids in (A,C).
Figure 11
Figure 11
Light and scanning electron microscopy images of Paratylenchus veruculatus females: (AC) face view; (DG) anterior region; (H,O) total body; (IN) lateral field and tail region.
Figure 12
Figure 12
Light and scanning electron microscopy images of Paratylenchus sp.2 females: (A,B) face view; (C) total body; (DI) anterior region; (JO) tail region; arrows pointed at deirids in (C,I).
Figure 13
Figure 13
Light microscopy images of Paratylenchus sp.BE11 females: (A) total body; (BE) anterior region; (FH) tail region; (I) total body; (J) lateral field.
Figure 14
Figure 14
Light and scanning electron microscopy images of Paratylenchus sp.D females; (A,G,H) face view; (BF,M,N) anterior region; (I,L) total body; (J,K,OQ) tail region; arrow pointed to deirid in L.
Figure 15
Figure 15
Light and scanning electron microscopy images of Paratylenchus sp.F females: (AC) face view; (D,E,L,M,P,Q) anterior region; (F,G) vulva region; (HK,O,RT) tail region; (N) total body.
Figure 16
Figure 16
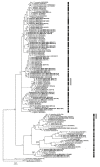
Phylogenetic relationships within populations and species of Paratylenchus, as inferred from Bayesian analysis using the D2-D3 of 28S rRNA gene sequence dataset with the GTR + I + G model. Posterior probability of more than 70% is given for the appropriate clades. Newly obtained sequences are indicated in bold. 1 = originally identified as P. nanus, 2 = originally identified as P. bukowinensis, 3 = originally identified as Paratylenchus sp., 4 = originally identified as Paratylenchus sp.8, 5 = originally identified as Paratylenchus sp.E, 6 = originally identified as Gracilacus sp. 7 = originally identified as Paratylenchus sp.5 and 8 = originally identified as Paratylenchus sp.6. Black and grey bars represent species boundaries estimated by generalized mixed-yule coalescent (GMYC) and Poisson tree process (bPTP) methods, respectively (only differences with GMYC provided).
Figure 17
Figure 17
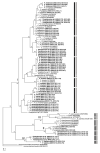
Phylogenetic relationships within populations and species of Paratylenchus as inferred from Bayesian analysis using the ITS rRNA gene sequence dataset with the GTR + I + G model. Posterior probability more than 70% is given for appropriate clades. Newly obtained sequences are indicated in bold. 1 = originally identified as P. nanus and 2 = originally identified as Paratylenchus sp. Black and grey bars represent species boundaries estimated by GMYC and bPTP methods, respectively.
Figure 18
Figure 18
Phylogenetic relationships within populations and species of Paratylenchus, as inferred from Bayesian analysis using the 18S rRNA gene sequence dataset with the GTR + I + G model. Posterior probability more than 70% is given for appropriate clades. Newly obtained sequences are indicated in bold. 1 = originally identified as P. dianthus and 2 = originally identified as P. nanus. Black and grey bars represent species boundaries estimated by GMYC and bPTP methods, respectively.
Figure 19
Figure 19
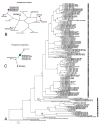
(A). Phylogenetic relationships within populations and species of Paratylenchus, as inferred from Bayesian analysis using the COI gene sequence dataset with the GTR + I + G model. Posterior probability more than 70% is given for appropriate clades. Newly obtained sequences are indicated in bold. 1 = originally identified as Paratylenchus sp., 2 = originally identified as P. nanus, 3 = identified as Paratylenchus sp.E, 4 = originally identified as Gracilacus sp., 5 = originally identified as Paratylenchus sp.8, 6 = originally identified as Paratylenchus sp.B; (B). Statistical parsimony network showing the phylogenetic relationships between COI haplotypes for P. straeleni; (C). Statistical parsimony network showing the phylogenetic relationships between COI haplotypes for P. enigmaticus. Pies (circles) represent the sequences with the same haplotype and their size is proportional to the number of these sequences in the samples. Numbers of nucleotide differences between the sequences are indicated on lines connecting the pies. Small black circles represent missing haplotypes. Bars represent species boundaries estimated by both GMYC and bPTP methods (identical results).

References

    1. Micoletzky H. Die freilebenden Erd-Nematoden. Archiv für Naturgeschichte; Berlin, Germany: 1922.
    1. Siddiqi M.R. Tylenchida: Parasites of Plants and Insects. 2nd ed. CABI Publishing; Wallingford, UK: 2000.
    1. Manzanilla-López R.H., Marbán-Mendoza N. Practical plant nematology. BBA; Colegio de Postgraduados, Mexico: 2012.
    1. Fourie H., Spaull V.W., Jones R.K., Daneel M.S., De Waele D. Nematology in South Africa: A View from the 21st Century. Springer; Cham, Switzerland: 2017.
    1. Subbotin S.A., Chitambar J.J. Plant Parasitic Nematodes in Sustainable Agriculture of North America. Springer; Cham, Switzerland: 2018.

LinkOut - more resources