. 2021 Feb 22;10(2):472.
doi: 10.3390/cells10020472.

Lipid Droplets Are a Physiological Nucleoporin Reservoir

Affiliations

Lipid Droplets Are a Physiological Nucleoporin Reservoir

Sylvain Kumanski et al. Cells. .

Abstract

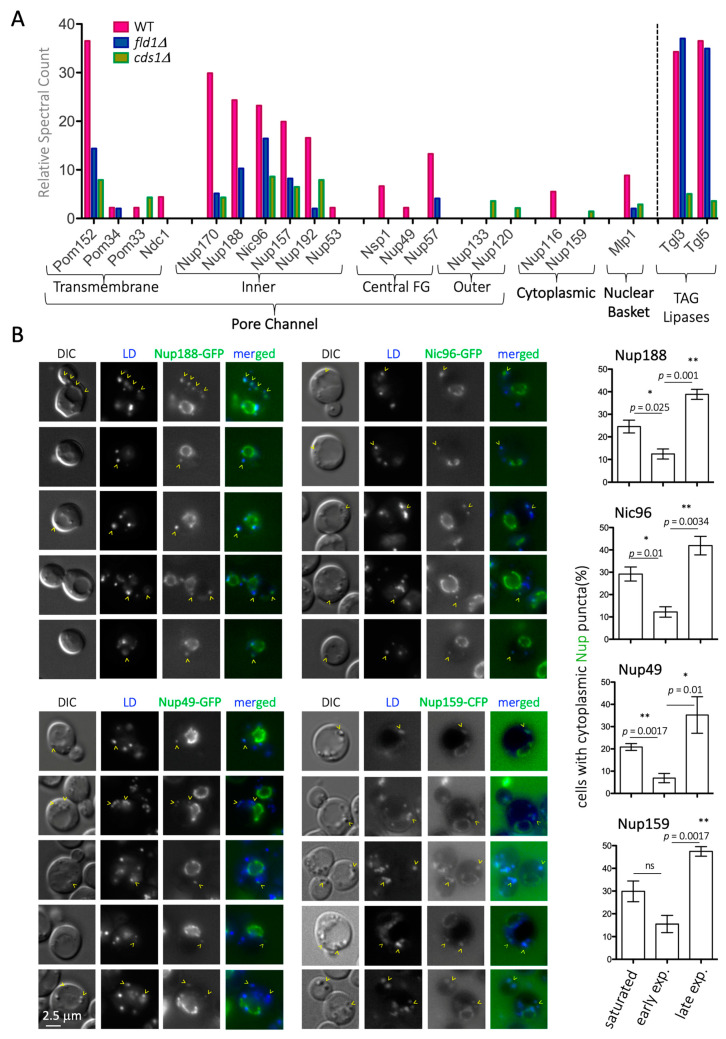
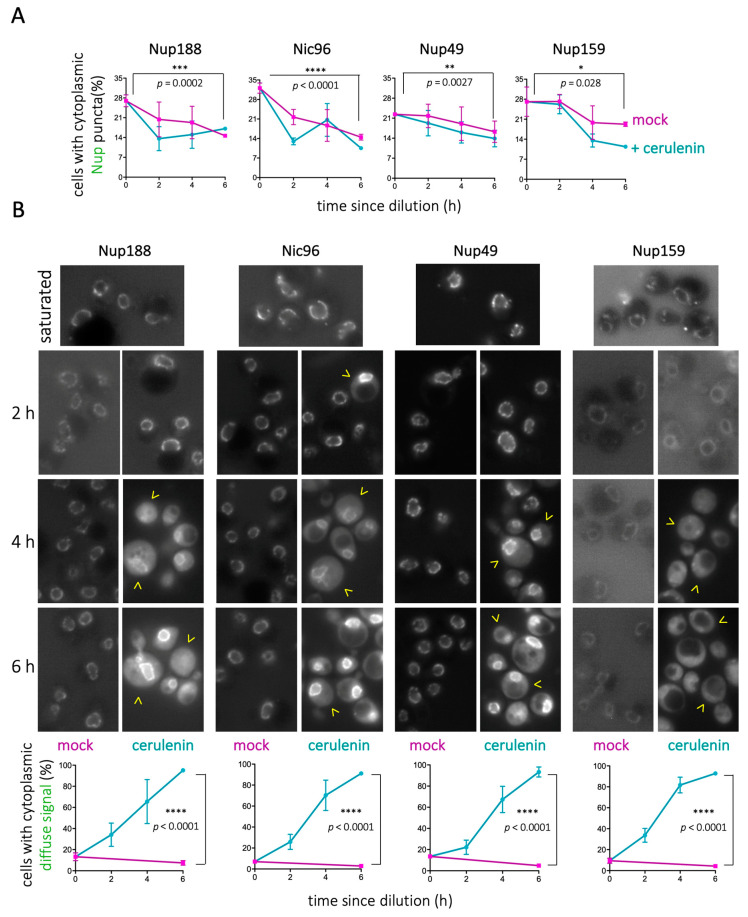
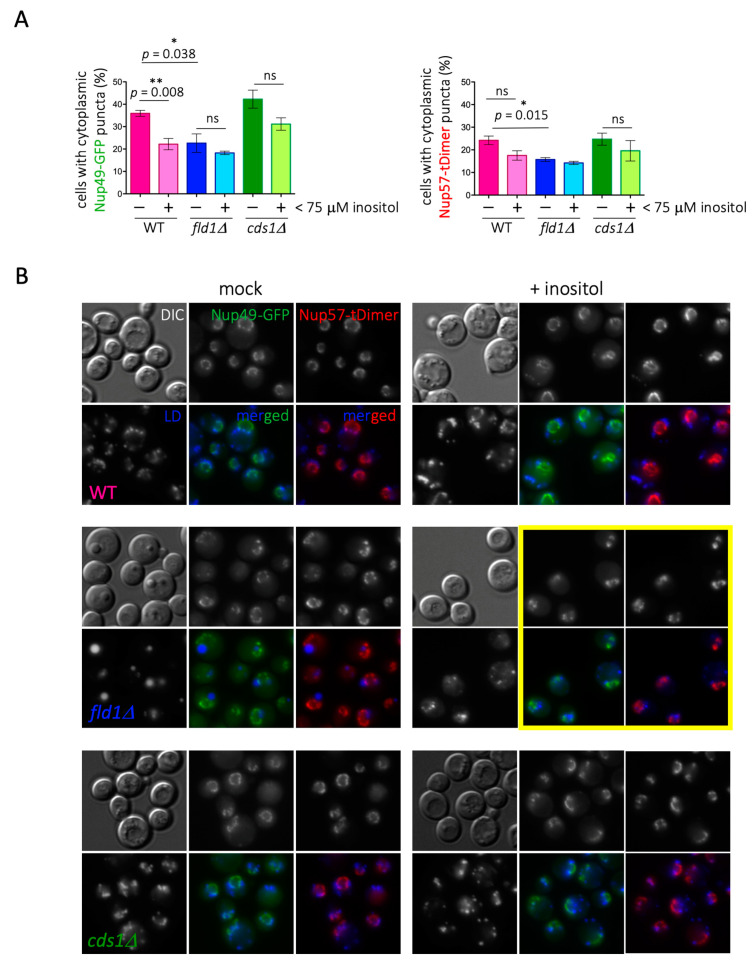
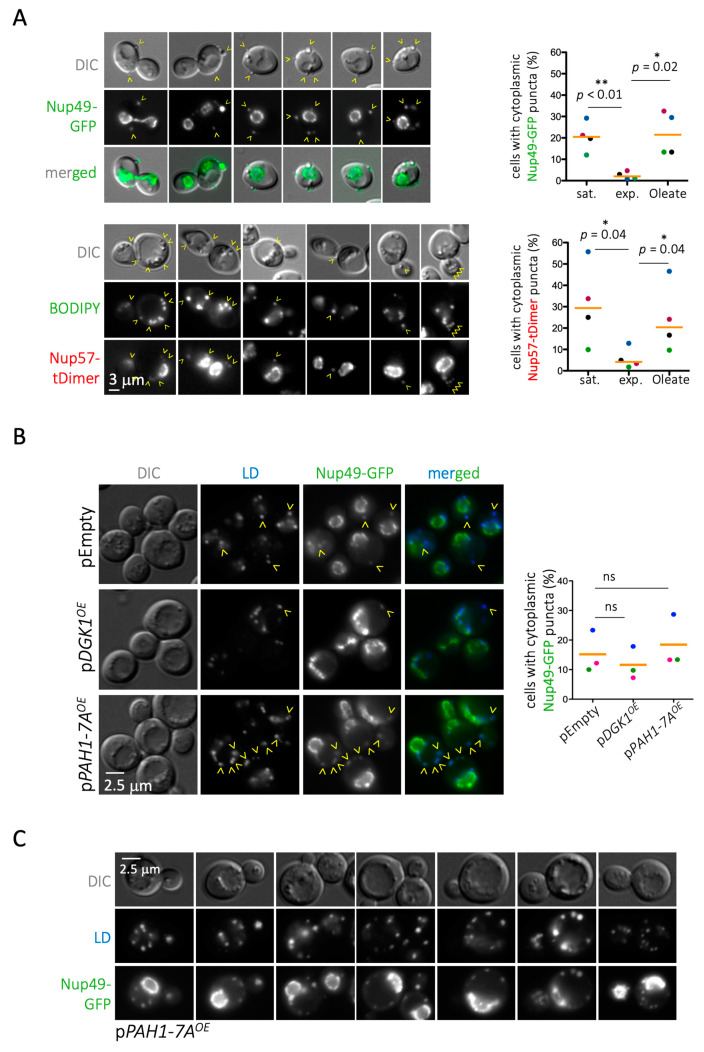
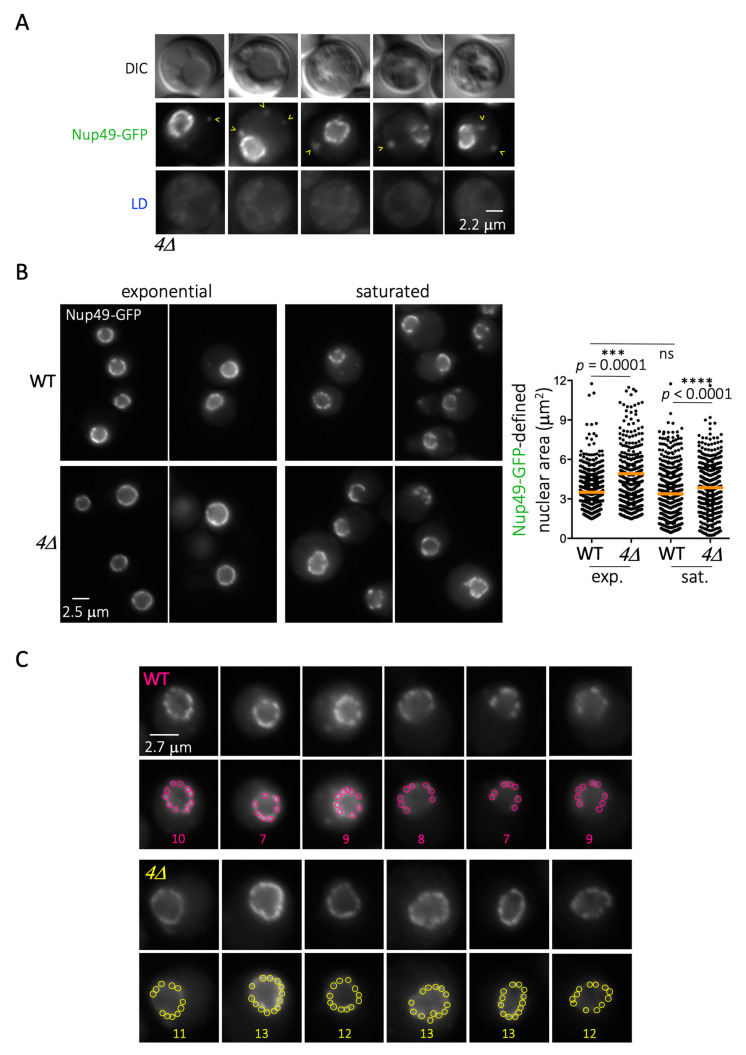
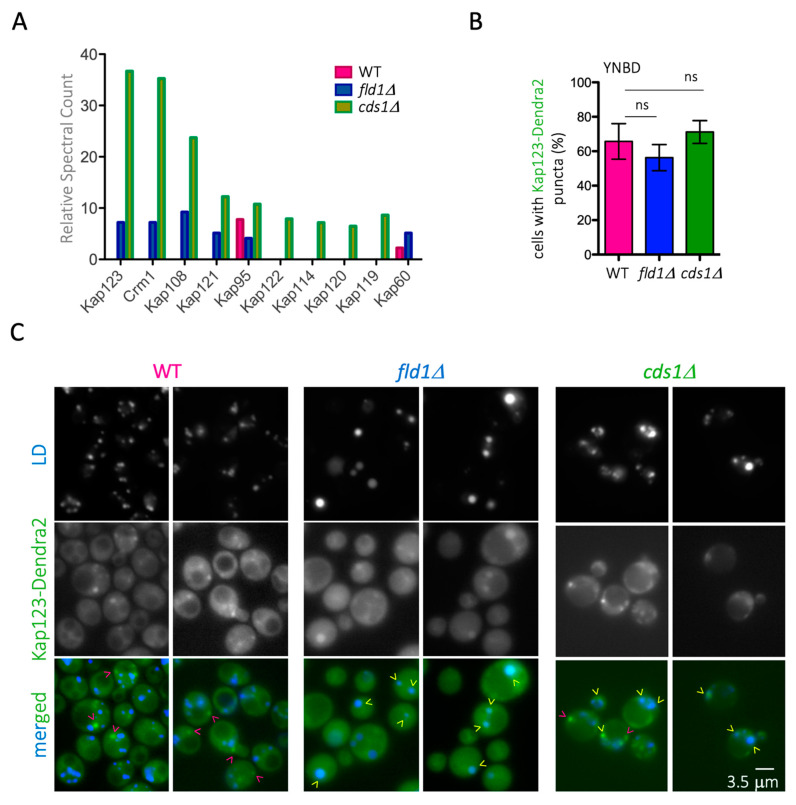
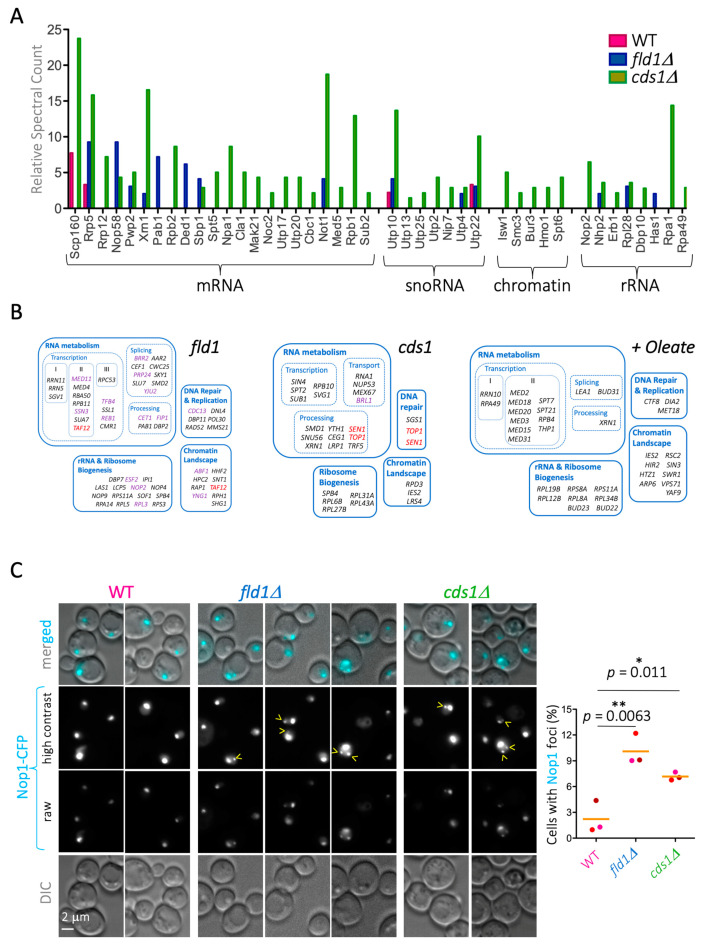
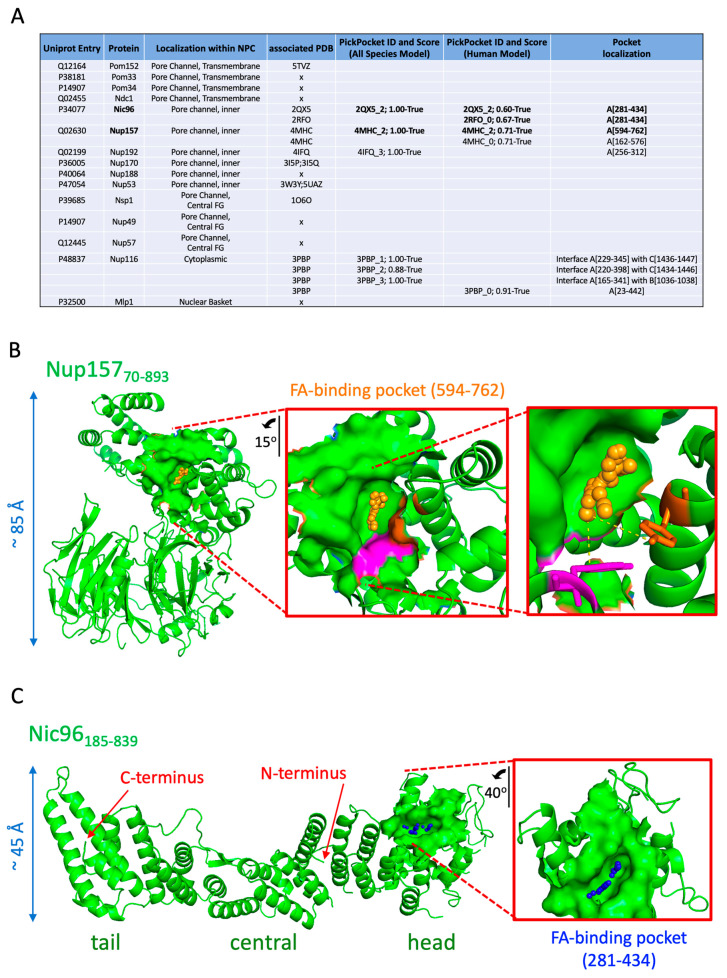
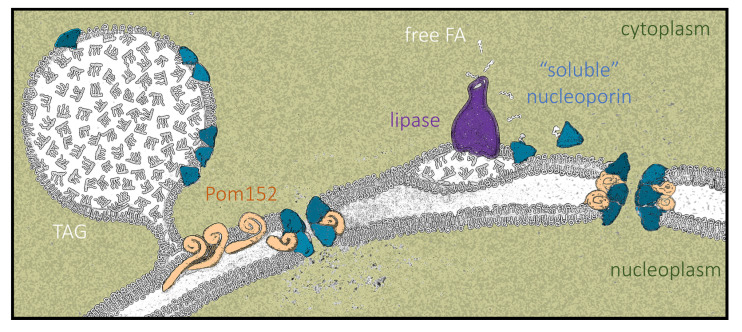
Lipid Droplets (LD) are dynamic organelles that originate in the Endoplasmic Reticulum and mostly bud off toward the cytoplasm, where they store neutral lipids for energy and protection purposes. LD also have diverse proteins on their surface, many of which are necessary for the their correct homeostasis. However, these organelles also act as reservoirs of proteins that can be made available elsewhere in the cell. In this sense, they act as sinks that titrate key regulators of many cellular processes. Among the specialized factors that reside on cytoplasmic LD are proteins destined for functions in the nucleus, but little is known about them and their impact on nuclear processes. By screening for nuclear proteins in publicly available LD proteomes, we found that they contain a subset of nucleoporins from the Nuclear Pore Complex (NPC). Exploring this, we demonstrate that LD act as a physiological reservoir, for nucleoporins, that impacts the conformation of NPCs and hence their function in nucleo-cytoplasmic transport, chromatin configuration, and genome stability. Furthermore, our in silico modeling predicts a role for LD-released fatty acids in regulating the transit of nucleoporins from LD through the cytoplasm and to nuclear pores.

Keywords: fatty acids binding; genome integrity pathways; lipid droplets; nucleoporins.


Conflict of interest statement

The authors declare no conflict of interest.

Figures

Figure 1
Figure 1
Detection of nucleoporins (Nups) on Lipid Droplets (LD). (A) Graphical representation of the relative presence of Nups on the LD of wild type (WT), fld1Δ and cds1 Δ cells purified from saturated Saccharomyces cerevisiae cultures, using raw data reported in [31]. The various Nups have been classified according to their physical positioning at the Nuclear Pore Complex (NPC). On the right, the enrichment of two LD-resident, well-characterized lipases is indicated for comparison. (B) left: Images from otherwise WT cells in which either Nic96, Nup188, Nup49, or Nup159 have been tagged with Green Fluorescent Protein (GFP) or Cyan Fluorescent Protein (CFP). The Differential Interference Contrast (DIC) images permit the inference of LD localization. AUTODOTTM was used to label LD and therefore allow co-localization with Nup signals, shown in merged images. A single plane located at the mid-zone of the nucleus is shown for different cells. Yellow arrowheads point at LD in which co-localization with Nups is detected. right: The quantification shows the percentage of cells in the population in which LD co-localize with Nup-associated cytoplasmic signals (from one single plane). Measurements were taken in saturated, early, and late exponential cultures (see M&M for details). The graph shows the mean value, and SEM, from three independent experiments. The significance of the difference of the means from a t-test are indicated by asterisks and p values. ns = non-significant. At least 250 cells were considered per condition and experiment.
Figure 2
Figure 2
LD consumption by cerulenin dismantles cytoplasmic Nup puncta. (A) Overnight cultures grown in rich medium until saturation were diluted in the presence of 10 μg/mL cerulenin or in its absence (mock). Quantification showing the percentage of cells in the population displaying Nup cytoplasmic foci co-localizing with LD, for the indicated Nup, at the indicated culture timepoints. (B) top: Representative images of the timepoints described in (A). Yellow arrowheads point at cells in which the fluorescent signal becomes diffuse in the cytoplasm; bottom: Quantification showing the percentage of cells in the population in which Nup signals become diffuse in the cytoplasm. The data for each Nup are represented as an individual graph, in which timepoints correspond to the elapsed time since dilution in the presence of cerulenin or in its absence (mock). Each point is the mean value of three independent experiments. The significance of the difference of the means after applying a t-test is indicated by asterisks and P-values. Bars correspond to the SEM of those three independent experiments.
Figure 3
Figure 3
Defects in LD biogenesis alter Nup patterns. (A) Quantification showing the percentage of cells in the population displaying LD-co-localizing Nup49-GFP and Nup57-tDimer cytoplasmic puncta. Cells of the indicated genotypes were grown to saturation in the presence or absence of inositol. Each bar indicates the mean value of three independent experiments. Bars correspond to the SEM of those three independent experiments. Individual t-tests were applied to assess the (lack of) significance of the difference of the means, ns = not significant. (B) Representative images of the timepoints quantified in (A) for the indicated strains. The yellow frame aims at highlighting cells in which the nuclear rim became strongly deformed.
Figure 4
Figure 4
Nup patterns can be changed by dietary and genetic manipulations. (A) Images from WT cells fed with oleate in which Nup49 has been tagged with GFP or Nup57 tagged with tDimer. The Differential Interference Contrast (DIC) images eventually permit LD localization. BODIPY was used to label LD and thus to search for co-localization with red signals. Some Nup57–tDimer signals are overexposed at the nuclear rim to allow the visualization of cytoplasmic puncta. A single plane located at the mid-zone of the nucleus is shown for different cells. Yellow arrowheads point to LD, as inferred by DIC or marked by BODIPY, for which Nup co-localization is detected. The quantification shows the percentage of cells in the population displaying Nup-associated cytoplasmic signals (from one single plane), which in the case of the Nup57–tDimer is always coincident with BODIPY. Measurements were taken in saturated cultures and in exponential cultures grown overnight in the absence (exponential) or the presence of Oleate. The graph shows the individual points belonging to four independent experiments and the median value (orange bar). At least 250 cells were considered per condition and experiment. Dots belonging to a same experiment are shown in the same color. t-tests for paired observations were applied as indicated by bars to account for whether the different experimental set-ups led to significant changes. Results are indicated by asterisks and a p value. (B) left: Images from WT cells in which Nup49 has been tagged with GFP and LD dyed with AUTODOTTM. Cells were transformed either with an empty plasmid (control) or with a plasmid allowing the controlled overexpression of Dgk1 (increases phosphatidic acid levels) or of the constitutively active Pah1-7A (increases diacylglycerol levels at the expense of phosphatidic acid). Prior to imaging, the cultures, grown in glycerol overnight, were induced by adding 2% galactose for 3h. right: Graph showing the individual values obtained in three independent experiments and the mean value (orange bar). At least 300 cells were considered per condition and experiment. Dots belonging to a same experiment are shown in the same color. The difference of the means, after applying a t-test, was not significant (ns). (C) Additional images of cells overexpressing Pah1-7A, which increases diacylglycerol levels and prompts LD formation. LD dyed with AUTODOTTM revealed that numerous Nup49 cytoplasmic signals exist in this condition and all co-localize with LD.
Figure 5
Figure 5
Inability to form LD triggers Nup overload at the nuclear envelope. (A) Fluorescence microscopy images of cells that cannot form LD (dga1Δ lro1Δ are1Δ are2Δ, simplified as ) in which Nup49 has been tagged with GFP. (B) left: Fluorescence microscopy images of WT and cells in which Nup49 has been tagged with GFP, grown either to exponential phase or to saturation. right: Plot of the sizes of individual nuclear areas as defined by the Nup49-GFP rim for each strain for the indicated growth set-ups. Two independent experiments are included per condition in the plot. At least 300 cells were analyzed per condition and experiment. The orange bar indicates the mean of the population. The p values refer to the statistical significance of the difference of the means by t-test. (C) Images of individual nuclear rims of both WT and cells from saturated cultures at the central plane only. For each strain, the upper row corresponds to the unprocessed image, while the lower row shows that same image, to which colored circles have been superimposed. Each circle comprises an NPC cluster, as identified following the directives presented in [34,35,59]. The numbers indicate the number of individual clusters identified for each nuclear rim.
Figure 6
Figure 6
Altered distribution of karyopherins onto mutant LD. (A) Graphical representation of the relative presence of karyopherins on the LD of WT, fld1Δ, and cds1Δ cells purified from saturated Saccharomyces cerevisiae cultures (raw data reported in [31]). (B) Quantification of WT, fld1Δ, and cds1Δ cells with Kap123–Dendra2 cytoplasmic puncta upon growth in minimal, defined medium until saturation. Each bar indicates the mean value of three independent experiments. Bars correspond to the SEM of those three independent experiments. The difference of the means after applying a t-test revealed that it was not significant (ns). (C) Fluorescence microscopy images from data presented in (B) of WT and mutant cells in which Kap123 has been tagged with Dendra2 (2 examples per genotype). AUTODOTTM was used to dye LD. Merged images are shown, to assess eventual co-localization. Yellow arrowheads indicate Kap123–Dendra2 signals that co-localize with LD, while pink arrowheads indicate those that do not co-localize.
Figure 7
Figure 7
LD alterations predispose to genome instability. (A) Graphical representation of the relative presence of karyopherin cargoes found on the LD of WT, fld1Δ, and cds1Δ cells purified from saturated Saccharomyces cerevisiae cultures (original data reported in [31]). The hits are grouped by biological role. (B) The 257 genetic interactors of the fld1 mutation (left) and the 232 interactors of the cds1 mutation (center) were retrieved from the Saccharomyces Genome Database, while the 134 oleate-sensitive interactors (right) were retrieved from [32]. The nuclear hits were selected, and further functional classification was performed with DAVID [33], and these are shown as individual sets. Genes in violet indicate positive genetic interactions, while the rest are negative ones. Genes in red are included twice because the protein can be ascribed to two functional categories. (C) left: Images of WT, fld1Δ, and cds1Δ cells that were transformed with a plasmid expressing the nucleolar marker Nop1 tagged with CFP. Asynchronous cultures were used for live fluorescence microscopy. Two or three examples are shown for each strain. Nucleoli are visible in the raw and high-contrast images. Nop1 foci, indicative of fragmented nucleoli, are indicated by yellow arrowheads. right: Quantification of the percentage of cells in the population with Nop1 foci. Dots represent three independent experiments. Similarly colored dots belong to the same experiment. The orange bar is the mean of those three experiments. At least 300 cells were counted per condition and experiment. The p values correspond to paired t-tests assessing the significance of the differences of the means.
Figure 8
Figure 8
Prediction of fatty acid (FA)-binding pockets in Nups. (A) Table compiling the prediction information for all the Nups present on WT LD. Indicated are the presence (or absence, x) of an available PDB ID to be used for the prediction. Only positive results (where “False” is assigned to scores below 0.5, while “True” spans up to the perfect match of 1, see M&M) are indicated upon running PickPocket, which is either trained with an All Species Model or a Human-Only Model. The protein chain and the aminoacids stretch harboring the predicted pocket are also shown. (B) Structure of Nup157 (aminoacids 70-893; PDB 4HMC), in which the position and orientation of the predicted FA-binding pocket is highlighted as a filled space. An inset of the coordination of the FA with Tyr594 (magenta) and Tyr646 (orange) is shown. (C) Structure of Nic96 (amino acids 185-839; PDB 2QX5), in which the position and orientation of the predicted FA-binding pocket is highlighted as a filled space. The different domains of the protein have been named for clarity.
Figure 9
Figure 9
Model of how LD status impacts Nup configurations at the nuclear pores. left: TriAcylGlycerols (TAG)-filled LD create a landing platform for nucleoporins, which can attach by their own features (i.e., amphipathic helices), by interaction with other Nups, or by congregation in the perimeter of LD, e.g., in the case of Pom152. This may titrate nucleoporins away from the nuclear pore, defining a particular NPC stoichiometry that matches a specific transport and chromatin landscape profile. right: In the event of LD consumption, lipase activity releases individual fatty acids. We propose that these FAs may bind core Nups of the inner pore channel, such as Nic96 and Nup157, promoting a conformational change that permits their dissociation from LD and migration to the pore. Simultaneously, the decreased surface of the LD upon shrinkage will naturally promote the eviction of other Nups, as ruled by protein crowding [53], as well as the diffusion back to the ER of transmembrane proteins congregating in the vicinity of the LD [66]. The availability of these components at the NPC will specify a different profile of transport and alternative chromatin features.

Similar articles

Cited by

References

    1. Beck M., Förster F., Ecke M., Plitzko J.M., Melchior F., Gerisch G., Baumeister W., Medalia O. Nuclear pore complex structure and dynamics revealed by cryoelectron tomography. Science. 2004;80 doi: 10.1126/science.1104808. - DOI - PubMed
    1. Allegretti M., Zimmerli C.E., Rantos V., Wilfling F., Ronchi P., Fung H.K.H., Lee C.W., Hagen W., Turoňová B., Karius K., et al. In-cell architecture of the nuclear pore and snapshots of its turnover. Nature. 2020 doi: 10.1038/s41586-020-2670-5. - DOI - PubMed
    1. Ibarra A., Hetzer M.W. Nuclear pore proteins and the control of genome functions. Genes Dev. 2015 doi: 10.1101/gad.256495.114. - DOI - PMC - PubMed
    1. Walther T.C., Farese R.V. Lipid droplets and cellular lipid metabolism. Annu. Rev. Biochem. 2012 doi: 10.1146/annurev-biochem-061009-102430. - DOI - PMC - PubMed
    1. Beller M., Thiel K., Thul P.J., Jäckle H. Lipid droplets: A dynamic organelle moves into focus. FEBS Lett. 2010 doi: 10.1016/j.febslet.2010.03.022. - DOI - PubMed

Publication types

LinkOut - more resources