Aldehyde Dehydrogenase, a Therapeutic Target in Chordoma: Analysis in 3D Cellular Models
- PMID: 33672032
- PMCID: PMC7919493
- DOI: 10.3390/cells10020399
Aldehyde Dehydrogenase, a Therapeutic Target in Chordoma: Analysis in 3D Cellular Models
Abstract
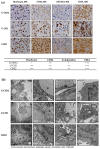
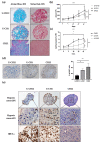
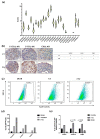
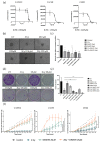
Chordomas are rare, slow-growing tumors of the axial skeleton. These tumors are locally aggressive and refractory to conventional therapies. Radical surgery and radiation remain the first-line treatments. Despite these aggressive treatments, chordomas often recur and second-line treatment options are limited. The mechanisms underlying chordoma radioresistance remain unknown, although several radioresistant cancer cells have been shown to respond favorably to aldehyde dehydrogenase (ALDH) inhibition. The study of chordoma has been delayed by small patient cohorts and few available models due to the scarcity of these tumors. We thus created cellular 3D models of chordoma by using low-adherence culture systems. Then, we evaluated their radiosensitivity using colony-forming and spheroid size assays. Finally, we determined whether pharmacologically inhibiting ALDH increased their radiosensitivity. We found that 3D cellular models of chordoma (derived from primary, relapse, and metastatic tumors) reproduce the histological and gene expression features of the disease. The metastatic, relapse, and primary spheroids displayed high, medium, and low radioresistance, respectively. Moreover, inhibiting ALDH decreased the radioresistance in all three models.
Keywords: 3D models; aldehyde dehydrogenase; chordoma; combination therapy; hypoxia; radioresistance; radiotherapy.
Conflict of interest statement
The authors declare no conflict of interest.
Figures


Similar articles
-
Establishment and characterization of a chordoma cell line from the tissue of a patient with dedifferentiated-type chordoma.J Neurosurg Spine. 2016 Nov;25(5):626-635. doi: 10.3171/2016.3.SPINE151077. Epub 2016 Jun 17. J Neurosurg Spine. 2016. PMID: 27314550
-
UM-Chor1: establishment and characterization of the first validated clival chordoma cell line.J Neurosurg. 2018 Mar;128(3):701-709. doi: 10.3171/2016.10.JNS16877. Epub 2017 Apr 21. J Neurosurg. 2018. PMID: 28430034 Free PMC article.
-
Molecular features and vulnerabilities of recurrent chordomas.J Exp Clin Cancer Res. 2021 Jul 30;40(1):244. doi: 10.1186/s13046-021-02037-y. J Exp Clin Cancer Res. 2021. PMID: 34330313 Free PMC article.
-
Surgical Strategies for Chordoma.Neurosurg Clin N Am. 2020 Apr;31(2):251-261. doi: 10.1016/j.nec.2019.11.007. Epub 2020 Jan 16. Neurosurg Clin N Am. 2020. PMID: 32147016 Review.
-
[Chordoma].Neurochirurgie. 2014 Jun;60(3):63-140. doi: 10.1016/j.neuchi.2014.02.003. Epub 2014 May 23. Neurochirurgie. 2014. PMID: 24856008 Review. French.
Cited by
-
A chronicle review of new techniques that facilitate the understanding and development of optimal individualized therapeutic strategies for chordoma.Front Oncol. 2022 Nov 16;12:1029670. doi: 10.3389/fonc.2022.1029670. eCollection 2022. Front Oncol. 2022. PMID: 36465398 Free PMC article. Review.
-
Radiotherapy in bone sarcoma: the quest for better treatment option.BMC Cancer. 2023 Aug 11;23(1):742. doi: 10.1186/s12885-023-11232-3. BMC Cancer. 2023. PMID: 37563551 Free PMC article. Review.
-
Mechanical properties of cell sheets and spheroids: the link between single cells and complex tissues.Biophys Rev. 2021 Jul 13;13(4):541-561. doi: 10.1007/s12551-021-00821-w. eCollection 2021 Aug. Biophys Rev. 2021. PMID: 34471438 Free PMC article. Review.
References
-
- Gatta G., Capocaccia R., Botta L., Mallone S., Angelis R.D., Ardanaz E., Comber H., Dimitrova N., Leinonen M.K., Siesling S., et al. Burden and Centralised Treatment in Europe of Rare Tumours: Results of RARECAREnet—a Population-Based Study. Lancet Oncol. 2017;18:1022–1039. doi: 10.1016/S1470-2045(17)30445-X. - DOI - PubMed
MeSH terms
Substances
LinkOut - more resources
Full Text Sources
Other Literature Sources

