

Effect of C-terminus Conjugation via Different Conjugation Chemistries on In Vivo Activity of Albumin-Conjugated Recombinant GLP-1
- PMID: 33672039
- PMCID: PMC7919490
- DOI: 10.3390/pharmaceutics13020263
Effect of C-terminus Conjugation via Different Conjugation Chemistries on In Vivo Activity of Albumin-Conjugated Recombinant GLP-1
Abstract
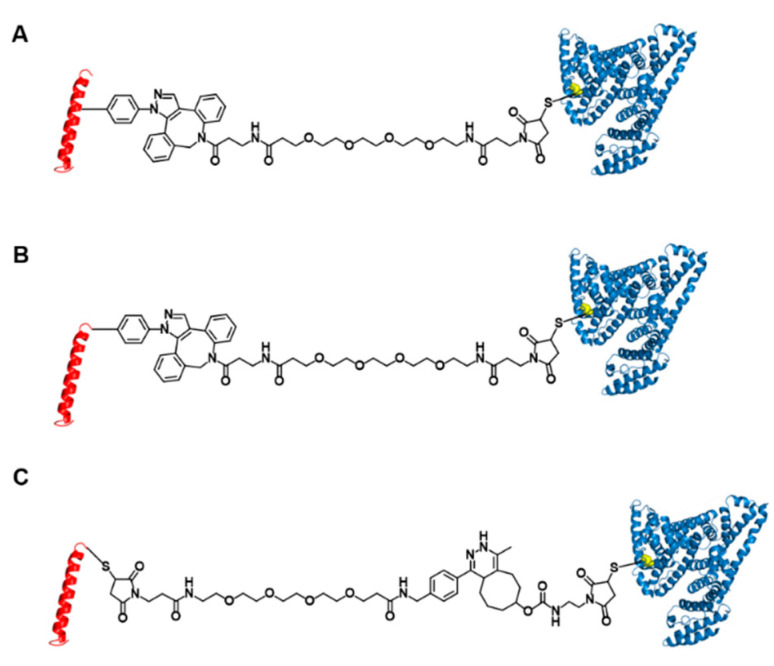
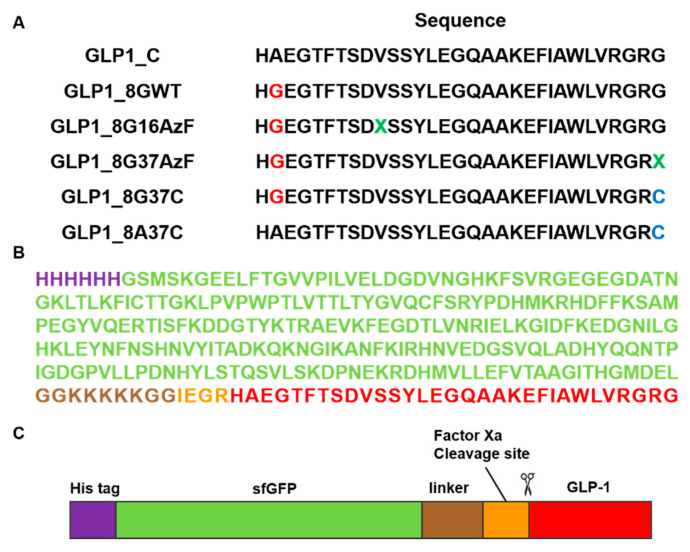
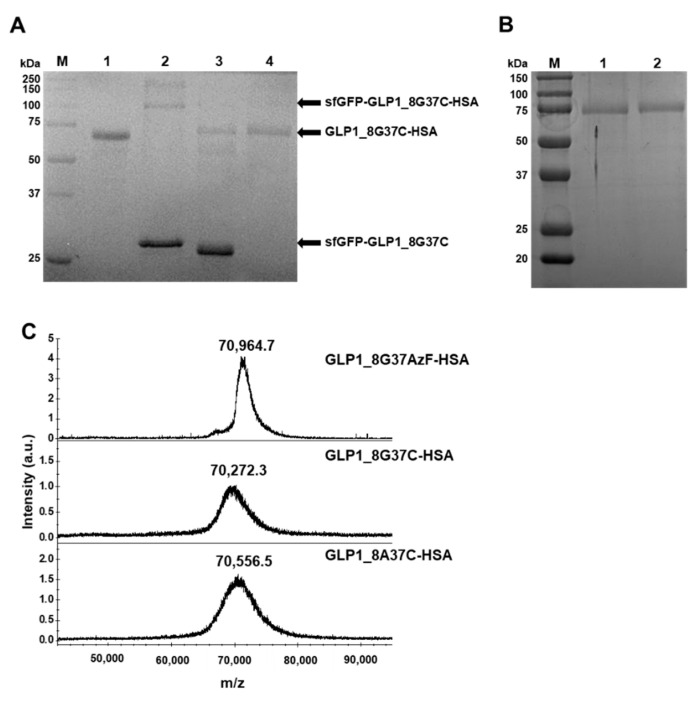
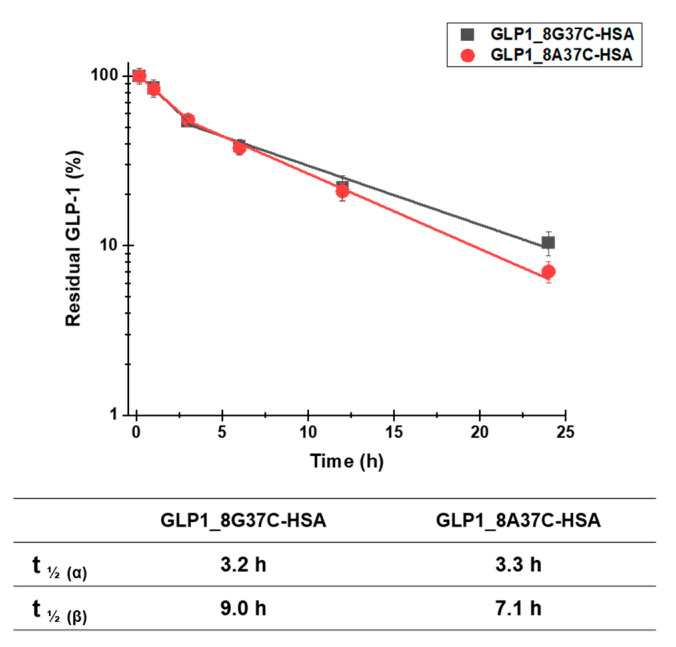
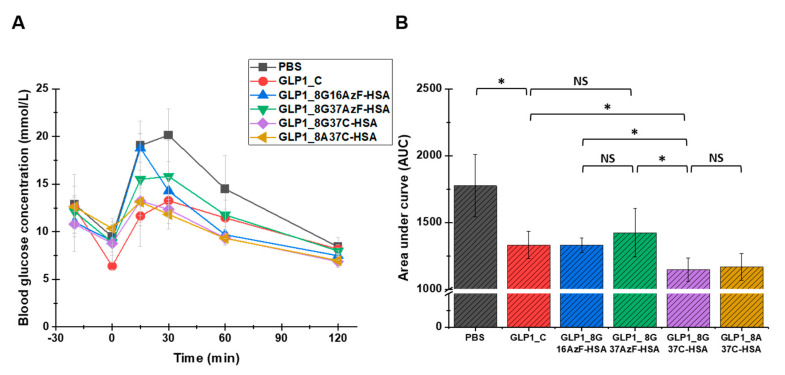
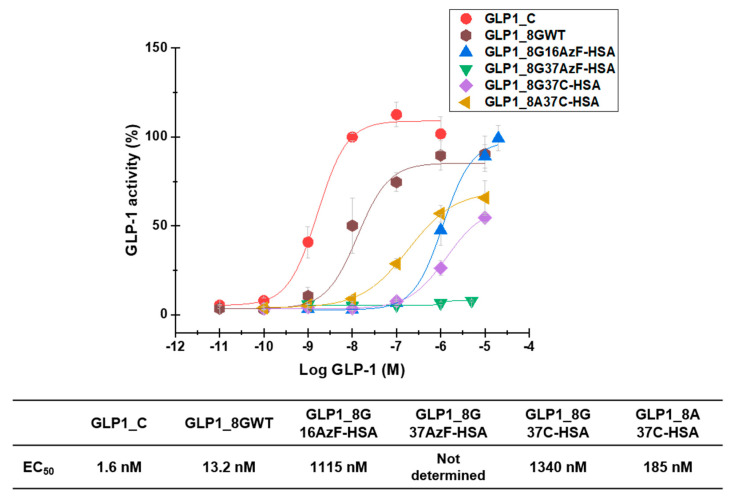
Glucagon-like peptide-1 (GLP-1) is a peptide hormone with tremendous therapeutic potential for treating type 2 diabetes mellitus. However, the short half-life of its native form is a significant drawback. We previously prolonged the plasma half-life of GLP-1 via site-specific conjugation of human serum albumin (HSA) at position 16 of recombinant GLP-1 using site-specific incorporation of p-azido-phenylalanine (AzF) and strain-promoted azide-alkyne cycloaddition (SPAAC). However, the resulting conjugate GLP1_8G16AzF-HSA showed only moderate in vivo glucose-lowering activity, probably due to perturbed interactions with GLP-1 receptor (GLP-1R) caused by the albumin-linker. To identify albumin-conjugated GLP-1 variants with enhanced in vivo glucose-lowering activity, we investigated the conjugation of HSA to a C-terminal region of GLP-1 to reduce steric hindrance by the albumin-linker using two different conjugation chemistries. GLP-1 variants GLP1_8G37AzF-HSA and GLP1_8G37C-HSA were prepared using SPAAC and Michael addition, respectively. GLP1_8G37C-HSA exhibited a higher glucose-lowering activity in vivo than GLP1_8G16AzF-HSA, while GLP1_8G37AzF-HSA did not. Another GLP-1 variant, GLP1_8A37C-HSA, had a glycine to alanine mutation at position 8 and albumin at its C-terminus and exhibited in vivo glucose-lowering activity comparable to that of GLP1_8G37C-HSA, despite a moderately shorter plasma half-life. These results showed that site-specific HSA conjugation to the C-terminus of GLP-1 via Michael addition could be used to generate GLP-1 variants with enhanced glucose-lowering activity and prolonged plasma half-life in vivo.
Keywords: albumin conjugation; glucagon-like peptide-1; in vivo glucose-lowering activity; plasma half-life extension.
Conflict of interest statement
The authors declare no conflict of interest. ProAbtech Co., Ltd. was not involved in the design of the study, analyses or interpretation of data, writing of the manuscript, or decision to publish the results.
Figures
Similar articles
-
Recombinant Peptide Production Platform Coupled with Site-Specific Albumin Conjugation Enables a Convenient Production of Long-Acting Therapeutic Peptide.Pharmaceutics. 2020 Apr 16;12(4):364. doi: 10.3390/pharmaceutics12040364. Pharmaceutics. 2020. PMID: 32316169 Free PMC article.
-
Multivalent Albumin-Neonatal Fc Receptor Interactions Mediate a Prominent Extension of the Serum Half-Life of a Therapeutic Protein.Mol Pharm. 2021 Jun 7;18(6):2397-2405. doi: 10.1021/acs.molpharmaceut.1c00231. Epub 2021 May 13. Mol Pharm. 2021. PMID: 33983743
-
Glucagon-like Peptide 1 Conjugated to Recombinant Human Serum Albumin Variants with Modified Neonatal Fc Receptor Binding Properties. Impact on Molecular Structure and Half-Life.Biochemistry. 2017 Sep 12;56(36):4860-4870. doi: 10.1021/acs.biochem.7b00492. Epub 2017 Aug 25. Biochemistry. 2017. PMID: 28799326
-
GLP-1 based therapies: differential effects on fasting and postprandial glucose.Diabetes Obes Metab. 2012 Aug;14(8):675-88. doi: 10.1111/j.1463-1326.2012.01560.x. Epub 2012 Feb 13. Diabetes Obes Metab. 2012. PMID: 22233527 Review.
-
[Glucagon-like peptide-1 (GLP1) and the gastrointestinal tract. GLP1 receptor agonists: overemphasized gastric, forgotten intestinal ("ileal brake") effect?].Orv Hetil. 2019 Dec;160(49):1927-1934. doi: 10.1556/650.2019.31615. Orv Hetil. 2019. PMID: 31786941 Review. Hungarian.
Cited by
-
Improved systemic half-life of glucagon-like peptide-1-loaded carbonate apatite nanoparticles in rats.World J Diabetes. 2022 Aug 15;13(8):613-621. doi: 10.4239/wjd.v13.i8.613. World J Diabetes. 2022. PMID: 36159222 Free PMC article.
References
-
- Emerging Risk Factors Collaboration. Sarwar N., Gao P., Seshasai S.R.K., Gobin R., Kaptoge S., di Angelantonio E., Ingelsson E., Lawlor D.A., Selvin E., et al. The Emerging Risk Factors Collaboration Diabetes mellitus, fasting blood glucose concentration, and risk of vascular disease: A collaborative meta-analysis of 102 prospective studies. Lancet. 2010;375:2215–2222. doi: 10.1016/s0140-6736(10)60484-9. - DOI - PMC - PubMed
-
- Alvarez E., Martínez M.D., Roncero I., Chowen J.A., Garcia-Cuartero B., Gispert J.D., Sanz C., Vazquez P., Maldonado A., De Cáceres J., et al. The expression of GLP-1 receptor mRNA and protein allows the effect of GLP-1 on glucose metabolism in the human hypothalamus and brainstem. J. Neurochem. 2005;92:798–806. doi: 10.1111/j.1471-4159.2004.02914.x. - DOI - PubMed
Grants and funding
LinkOut - more resources
Full Text Sources
Other Literature Sources
Research Materials
