. 2021 Feb 23;22(4):2197.
doi: 10.3390/ijms22042197.

A Comprehensive miRNome Analysis of Macrophages Isolated from db/db Mice and Selected miRNAs Involved in Metabolic Syndrome-Associated Cardiac Remodeling

Affiliations

A Comprehensive miRNome Analysis of Macrophages Isolated from db/db Mice and Selected miRNAs Involved in Metabolic Syndrome-Associated Cardiac Remodeling

Justyna Niderla-Bielińska et al. Int J Mol Sci. .

Abstract

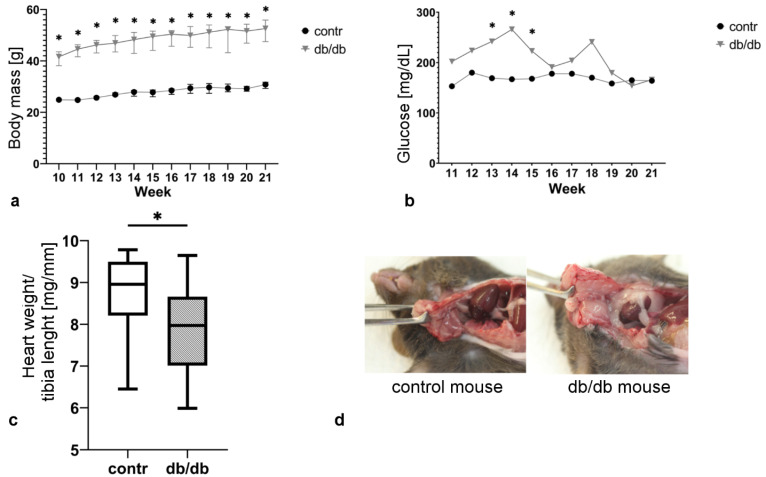
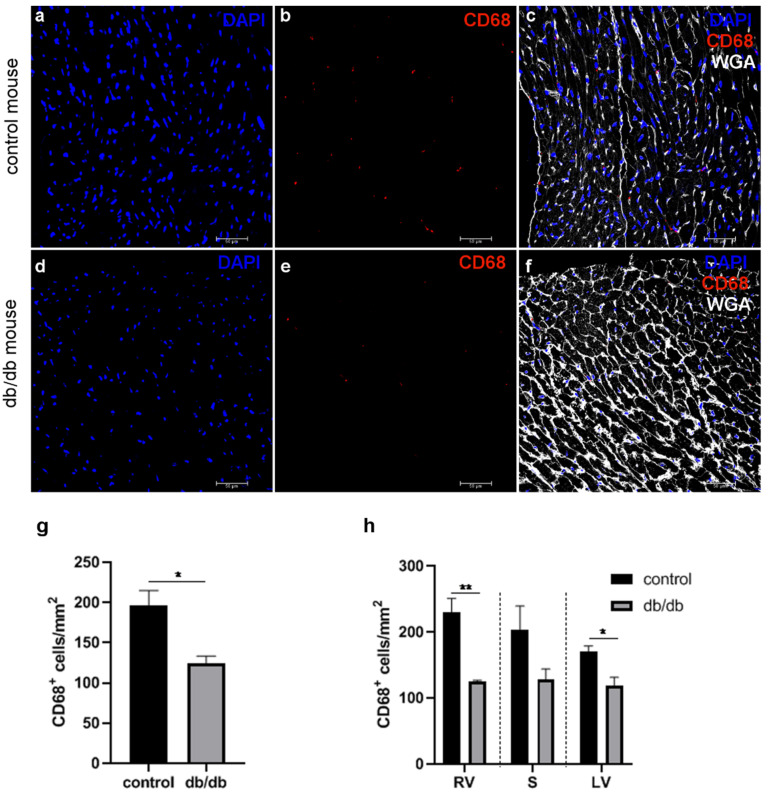
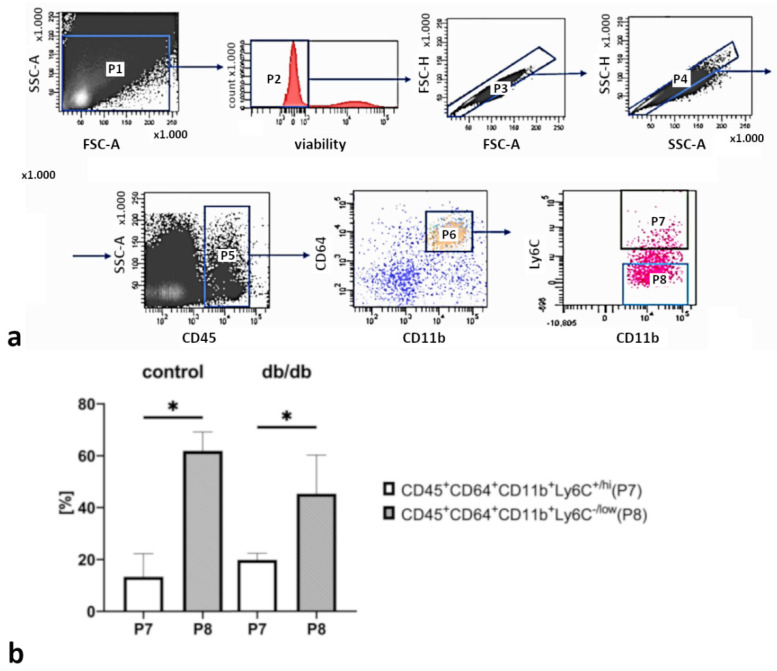
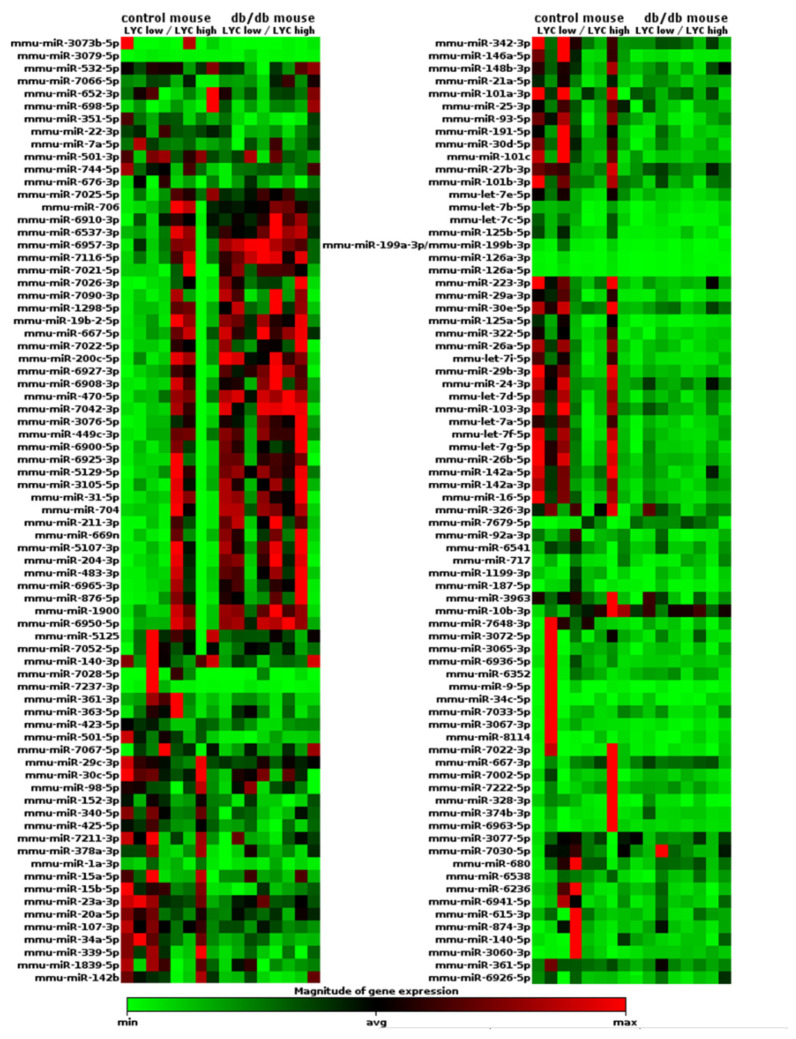
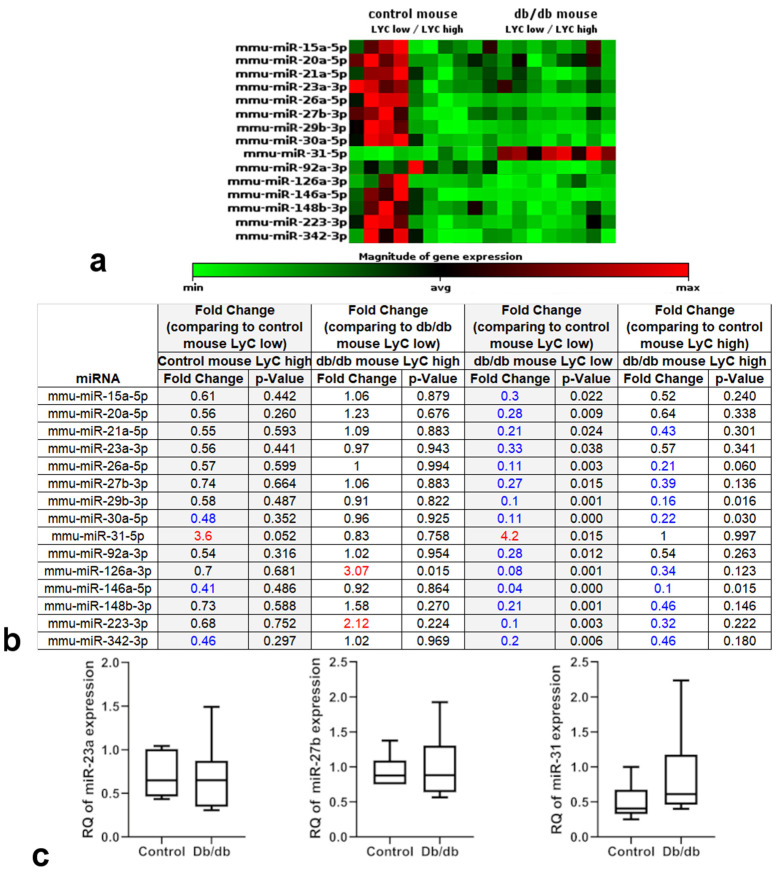
Cardiac macrophages are known from various activities, therefore we presume that microRNAs (miRNAs) produced or released by macrophages in cardiac tissue have impact on myocardial remodeling in individuals with metabolic syndrome (MetS). We aim to assess the cardiac macrophage miRNA profile by selecting those miRNA molecules that potentially exhibit regulatory functions in MetS-related cardiac remodeling. Cardiac tissue macrophages from control and db/db mice (an animal model of MetS) were counted and sorted with flow cytometry, which yielded two populations: CD45+CD11b+CD64+Ly6Chi and CD45+CD11b+CD64+Ly6Clow. Total RNA was then isolated, and miRNA expression profiles were evaluated with Next Generation Sequencing. We successfully sequenced 1400 miRNAs in both macrophage populations: CD45+CD11b+CD64+Ly6Chi and CD45+CD11b+CD64+Ly6Clow. Among the 1400 miRNAs, about 150 showed different expression levels in control and db/db mice and between these two subpopulations. At least 15 miRNAs are possibly associated with MetS pathology in cardiac tissue due to direct or indirect regulation of the expression of miRNAs for proteins involved in angiogenesis, fibrosis, or inflammation. In this paper, for the first time we describe the miRNA transcription profile in two distinct macrophage populations in MetS-affected cardiac tissue. Although the results are preliminary, the presented data provide a foundation for further studies on intercellular cross-talk/molecular mechanism(s) involved in the regulation of MetS-related cardiac remodeling.

Keywords: cardiac macrophages; metabolic syndrome; miRNA; myocardial remodeling.


Conflict of interest statement

The authors declare no conflict of interest.

Figures

Figure 1
Figure 1
The development of MetS symptoms in db/db mice. (a) body weight gain; (b) blood glucose level; (c) normalized heart weight; (d) pericardial adipose tissue in control and db/db mice. Values are mean ± S.E. (n = 6); *, p < 0.05 versus control group as determined by Wilcoxon signed-rank test.
Figure 2
Figure 2
Confocal microscope analysis of macrophage density in the LV of control (ac) and db/db (df) mice. Macrophages were visualized with anti-CD68 antibody. WGA (wheat germ agglutinin) was used to mark microvessels and cardiac myocyte boundaries. Figures were chosen among at least three independent stainings; the number of CD68 positive macrophages per mm2 in whole (g) and in specific areas of heart (h) was calculated. Data are expressed as mean number of cells per area (mm2), calculated within three independent stainings and 10 randomly selected regions of interest per staining; RV—right ventricle, LV—left ventricle, S—interventricular septum. * p < 0.05, ** p < 0.01.
Figure 3
Figure 3
Sorting strategy (a) and macrophage subpopulations count in db/db and control mice (b). Gates: P1—whole cell count after enzymatic digestion of cardiac tissue; P2—viable cells; P3 and P4—doublet exclusion; P5—CD45+; P6—CD45+CD11b+CD64+. Finally, two populations were gated: P7—CD45+CD63+CD11b+Ly6C+/hi and P8—CD45+CD63+CD11b+Ly6C+/low. Values are mean ± S.E. (n = 6); *, p < 0.05 versus control group as determined by Wilcoxon signed-rank test.
Figure 4
Figure 4
Heat map of miRNA expression data obtained with NGS from two populations of cardiac macrophages isolated from control (n = 4) and db/db (n = 4) mouse hearts. Results were normalized with the “Trimmed Mean of M” method and heat map was prepared on the basis of geNorm method. Relative miRNA expression is depicted according to the color scale shown below. Red indicates upregulation; green, downregulation.
Figure 5
Figure 5
Heat map of selected miRNA expression data (a) obtained with NGS from two populations of cardiac macrophages isolated from control (n = 4) and db/db (n = 4) mouse hearts. Results were normalized with the “Trimmed Mean of M” method and heat map was prepared based on the geNorm method. Relative miRNA expression is depicted according to the color scale shown below. Red indicates upregulation; green, downregulation. Table (b) shows selected miRNAs and fold change, which is the normalized miRNA expression in each Test Sample divided by the normalized miRNA expression in the Control Sample. Numbers in blue indicate downregulation, whereas in red – upregulation of miRNA expression. p-values were calculated with a Bioconductor software package. (c) Selected miRNAs expression in cardiac tissue from db/db (n = 6) and control (n = 6) mice measured with relative quantitation (RQ) using a comparative CT assay. Cardiac tissue from control mice was used as a calibrator. p-values were calculated with SAS 9.4 software.
Figure 6
Figure 6
(ad) Paraffin sections of control and db/db mouse hearts stained with Picrosirius red demonstrate collagen deposits. (a,b)—representative sections from control hearts with a slight interstitial and perivascular fibrosis stained in dark red; (c,d)—representative sections from db/db mice demonstrating a slight increase in interstitial and perivascular fibrosis, marked with arrows; scale bar—100 μm. (eg) Density of CD31+Lyve-1 cells in the left ventricular wall of control and db/db mice. (e,f) selected cryosections of control and db/db mouse hearts stained with anti-CD31 (green) and anti-Lyve-1 (red) antibodies, analyzed under a confocal microscope. (g) CD31+Lyve-1 cell count per 1 mm2 in the left ventricular wall of control and db/db mouse hearts; * p < 0.05 versus control group as determined by Wilcoxon signed-rank test. (h) Flow cytometry analysis of leukocyte subpopulations in cell suspensions obtained from control and db/db mouse cardiac tissue. Table shows percentages of leukocyte subpopulations in total leukocyte population.

References

    1. Alberti K.G., Zimmet P. The metabolic syndrome: Time to reflect. Curr. Diabetes Rep. 2006;6:259–261. doi: 10.1007/s11892-006-0057-0. - DOI - PubMed
    1. Swarup S., Goyal A., Grigorova Y., Zeltser R. StatPearls. StatPearls Publishing LLC.; Treasure Island, FL, USA: 2020. Metabolic Syndrome. StatPearls Publishing Copyright © 2021. - PubMed
    1. Paulus W.J., Tschope C. A novel paradigm for heart failure with preserved ejection fraction: Comorbidities drive myocardial dysfunction and remodeling through coronary microvascular endothelial inflammation. J. Am. Coll. Cardiol. 2013;62:263–271. doi: 10.1016/j.jacc.2013.02.092. - DOI - PubMed
    1. Simmonds S.J., Cuijpers I., Heymans S., Jones E.A.V. Cellular and Molecular Differences between HFpEF and HFrEF: A Step Ahead in an Improved Pathological Understanding. Cells. 2020;9:242. doi: 10.3390/cells9010242. - DOI - PMC - PubMed
    1. Adameova A., Dhalla N.S. Role of microangiopathy in diabetic cardiomyopathy. Heart Fail. Rev. 2014;19:25–33. doi: 10.1007/s10741-013-9378-7. - DOI - PubMed