

Combined Therapy of A1AR Agonists and A2AAR Antagonists in Neuroinflammation
- PMID: 33672225
- PMCID: PMC7926490
- DOI: 10.3390/molecules26041188
Combined Therapy of A1AR Agonists and A2AAR Antagonists in Neuroinflammation
Abstract
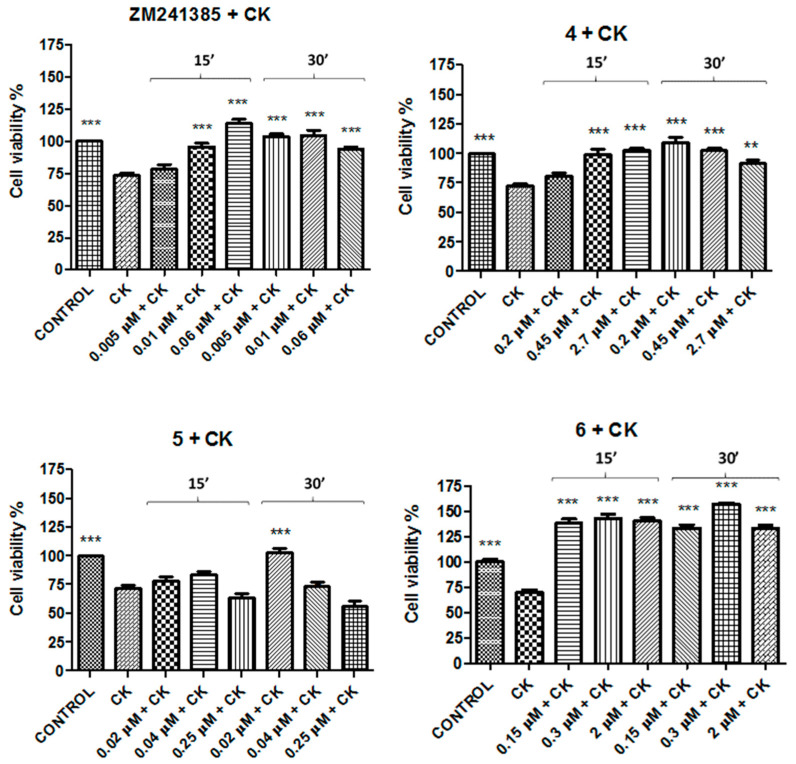
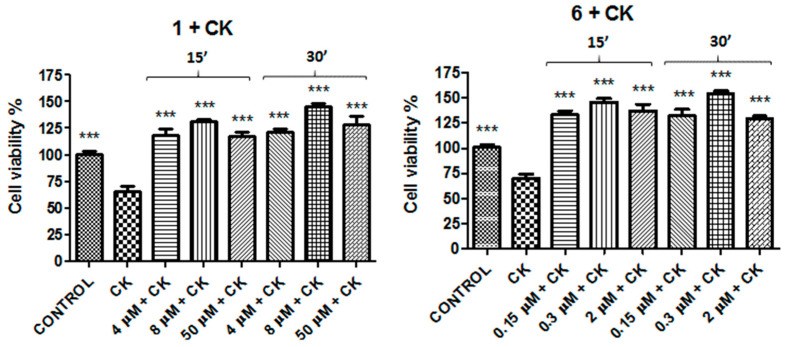
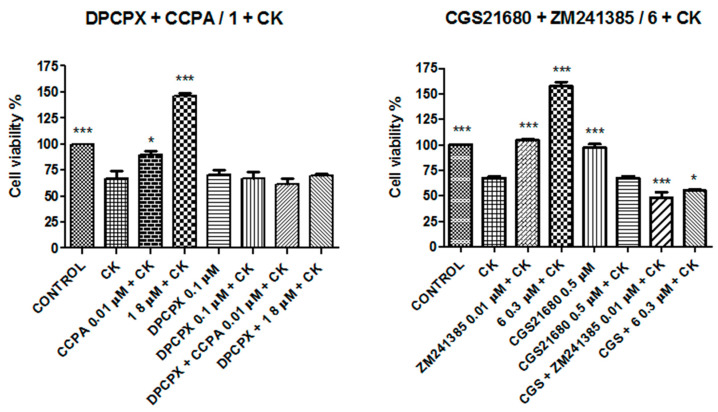
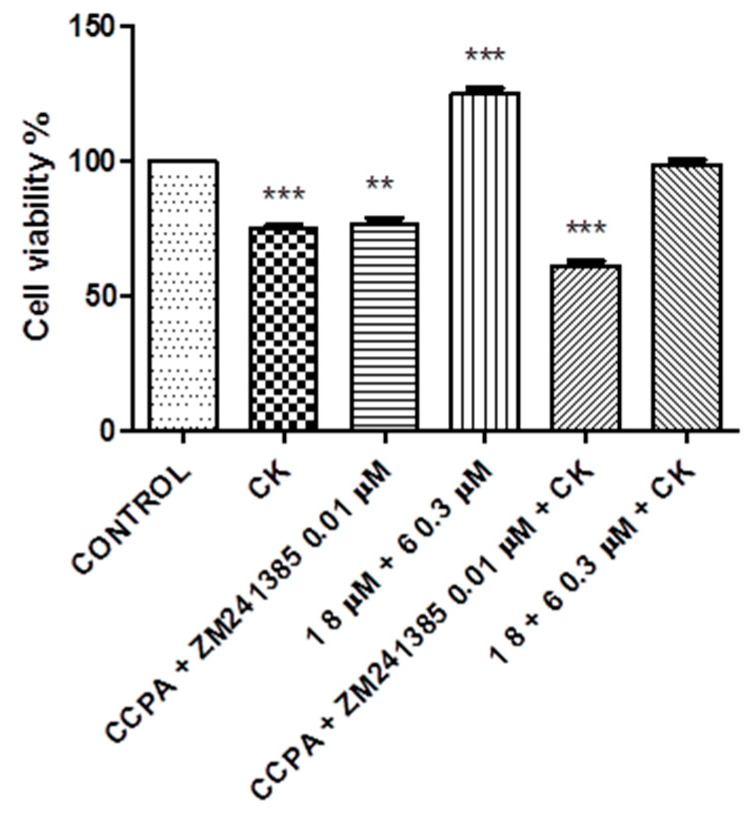
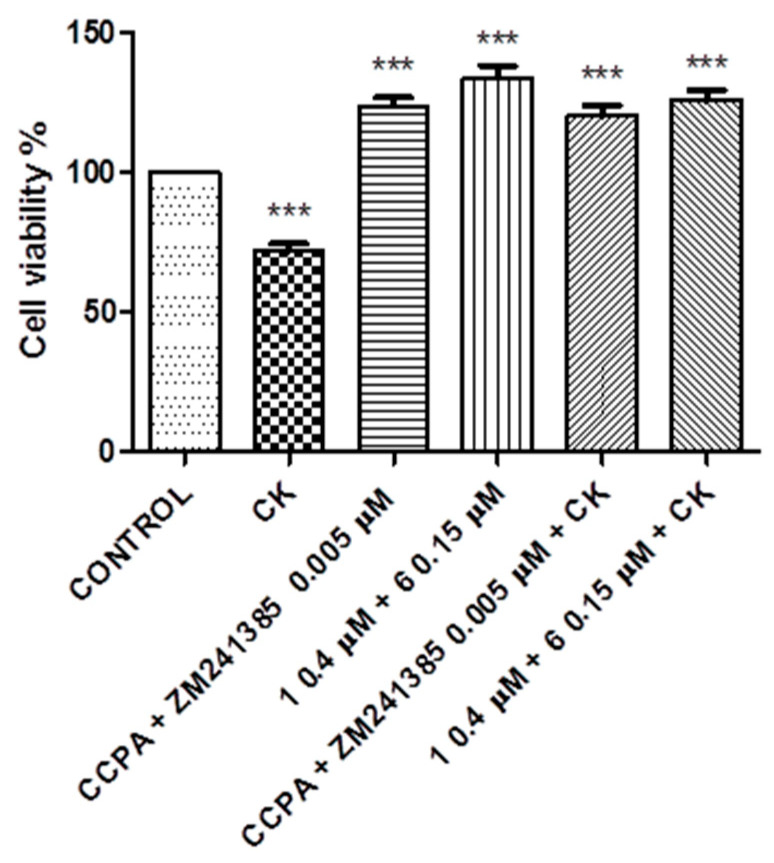
Alzheimer's, Parkinson's, and multiple sclerosis are neurodegenerative diseases related by neuronal degeneration and death in specific areas of the central nervous system. These pathologies are associated with neuroinflammation, which is involved in disease progression, and halting this process represents a potential therapeutic strategy. Evidence suggests that microglia function is regulated by A1 and A2A adenosine receptors (AR), which are considered as neuroprotective and neurodegenerative receptors, respectively. The manuscript's aim is to elucidate the role of these receptors in neuroinflammation modulation through potent and selective A1AR agonists (N6-cyclopentyl-2'- or 3'-deoxyadenosine substituted or unsubstituted in 2 position) and A2AAR antagonists (9-ethyl-adenine substituted in 8 and/or in 2 position), synthesized in house, using N13 microglial cells. In addition, the combined therapy of A1AR agonists and A2AAR antagonists to modulate neuroinflammation was evaluated. Results showed that A1AR agonists were able, to varying degrees, to prevent the inflammatory effect induced by cytokine cocktail (tumor necrosis factor (TNF)-α, interleukin (IL)-1β, and interferon (IFN)-γ), while A2AAR antagonists showed a good ability to counteract neuroinflammation. Moreover, the effect achieved by combining the two most effective compounds (1 and 6) in doses previously found to be non-effective was greater than the treatment effect of each of the two compounds used separately at maximal dose.
Keywords: A1AR agonist; A2AAR antagonist; combination therapy; cytokine; neuroinflammation; neuroprotection.
Conflict of interest statement
The authors declare no conflict of interest.
Figures
Similar articles
-
Adenosine Receptors as Neuroinflammation Modulators: Role of A1 Agonists and A2A Antagonists.Cells. 2020 Jul 21;9(7):1739. doi: 10.3390/cells9071739. Cells. 2020. PMID: 32708189 Free PMC article.
-
A1 adenosine receptor upregulation and activation attenuates neuroinflammation and demyelination in a model of multiple sclerosis.J Neurosci. 2004 Feb 11;24(6):1521-9. doi: 10.1523/JNEUROSCI.4271-03.2004. J Neurosci. 2004. PMID: 14960625 Free PMC article.
-
Differential recruitment of high affinity A1 and A2A adenosine receptors in the control of colonic neuromuscular function in experimental colitis.Eur J Pharmacol. 2011 Jan 15;650(2-3):639-49. doi: 10.1016/j.ejphar.2010.10.041. Epub 2010 Oct 27. Eur J Pharmacol. 2011. PMID: 21034735
-
Adenosine and adenosine receptors in the immunopathogenesis and treatment of cancer.J Cell Physiol. 2018 Mar;233(3):2032-2057. doi: 10.1002/jcp.25873. Epub 2017 May 3. J Cell Physiol. 2018. PMID: 28233320 Review.
-
A1 Adenosine Receptor Activation Modulates Central Nervous System Development and Repair.Mol Neurobiol. 2017 Dec;54(10):8128-8139. doi: 10.1007/s12035-016-0292-6. Epub 2016 Nov 26. Mol Neurobiol. 2017. PMID: 27889899 Review.
Cited by
-
Role of G Protein-Coupled Receptors in Microglial Activation: Implication in Parkinson's Disease.Front Aging Neurosci. 2021 Nov 16;13:768156. doi: 10.3389/fnagi.2021.768156. eCollection 2021. Front Aging Neurosci. 2021. PMID: 34867296 Free PMC article. Review.
-
Delayed-onset adenosine deaminase deficiency with a novel synonymous mutation and a case series from China.World J Pediatr. 2023 Jul;19(7):687-700. doi: 10.1007/s12519-023-00729-3. Epub 2023 May 8. World J Pediatr. 2023. PMID: 37154862
-
Adenosine and Inflammation: Here, There and Everywhere.Int J Mol Sci. 2021 Jul 19;22(14):7685. doi: 10.3390/ijms22147685. Int J Mol Sci. 2021. PMID: 34299305 Free PMC article. Review.
-
"Dual Anta-Inhibitors" of the A2A Adenosine Receptor and Casein Kinase CK1delta: Synthesis, Biological Evaluation, and Molecular Modeling Studies.Pharmaceuticals (Basel). 2023 Jan 23;16(2):167. doi: 10.3390/ph16020167. Pharmaceuticals (Basel). 2023. PMID: 37259317 Free PMC article.
-
Dual Anta-Inhibitors Targeting Protein Kinase CK1δ and A2A Adenosine Receptor Useful in Neurodegenerative Disorders.Molecules. 2023 Jun 14;28(12):4762. doi: 10.3390/molecules28124762. Molecules. 2023. PMID: 37375315 Free PMC article.
References
MeSH terms
Substances
LinkOut - more resources
Full Text Sources
Other Literature Sources
Research Materials
