. 2021 Feb 23;22(4):2207.
doi: 10.3390/ijms22042207.

Differential Effects of STCH and Stress-Inducible Hsp70 on the Stability and Maturation of NKCC2

Affiliations

Differential Effects of STCH and Stress-Inducible Hsp70 on the Stability and Maturation of NKCC2

Dalal Bakhos-Douaihy et al. Int J Mol Sci. .

Abstract

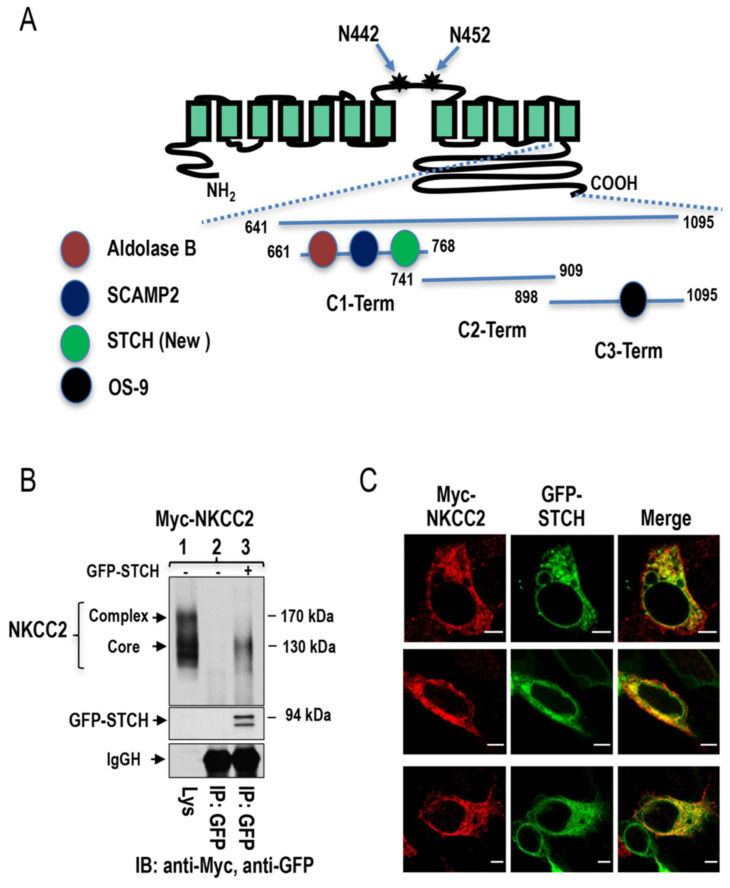
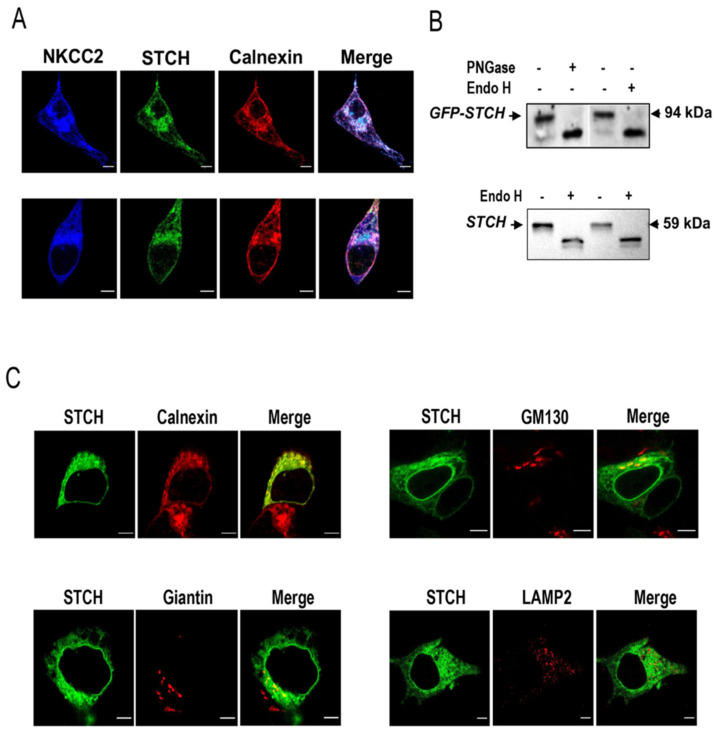
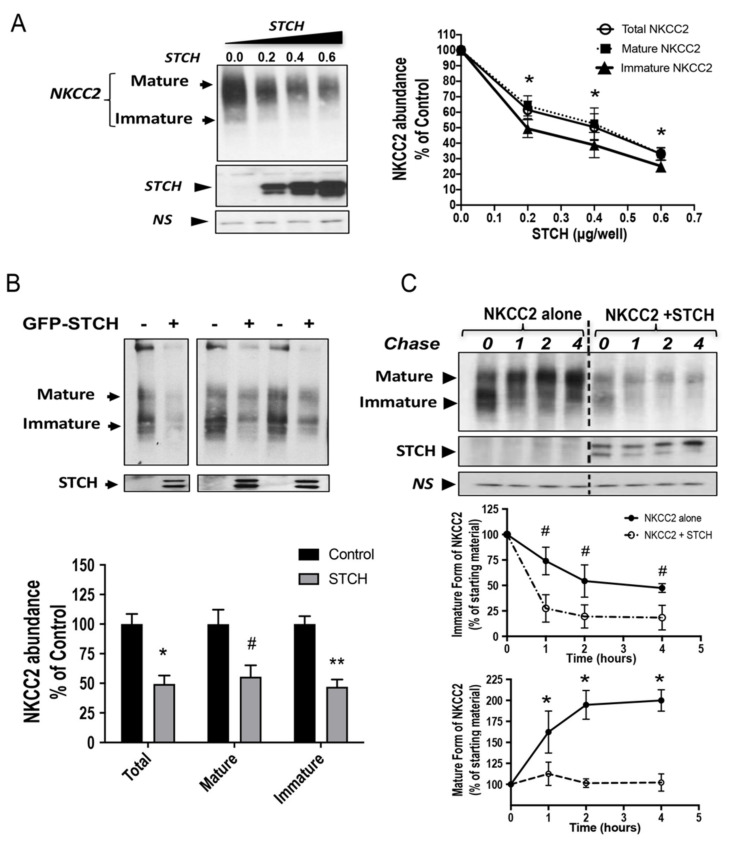
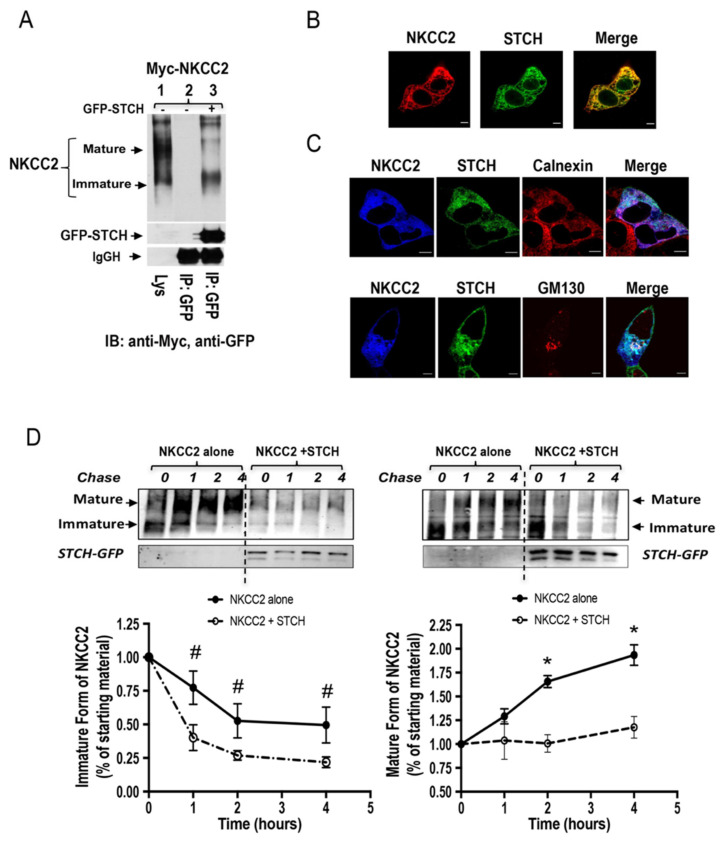
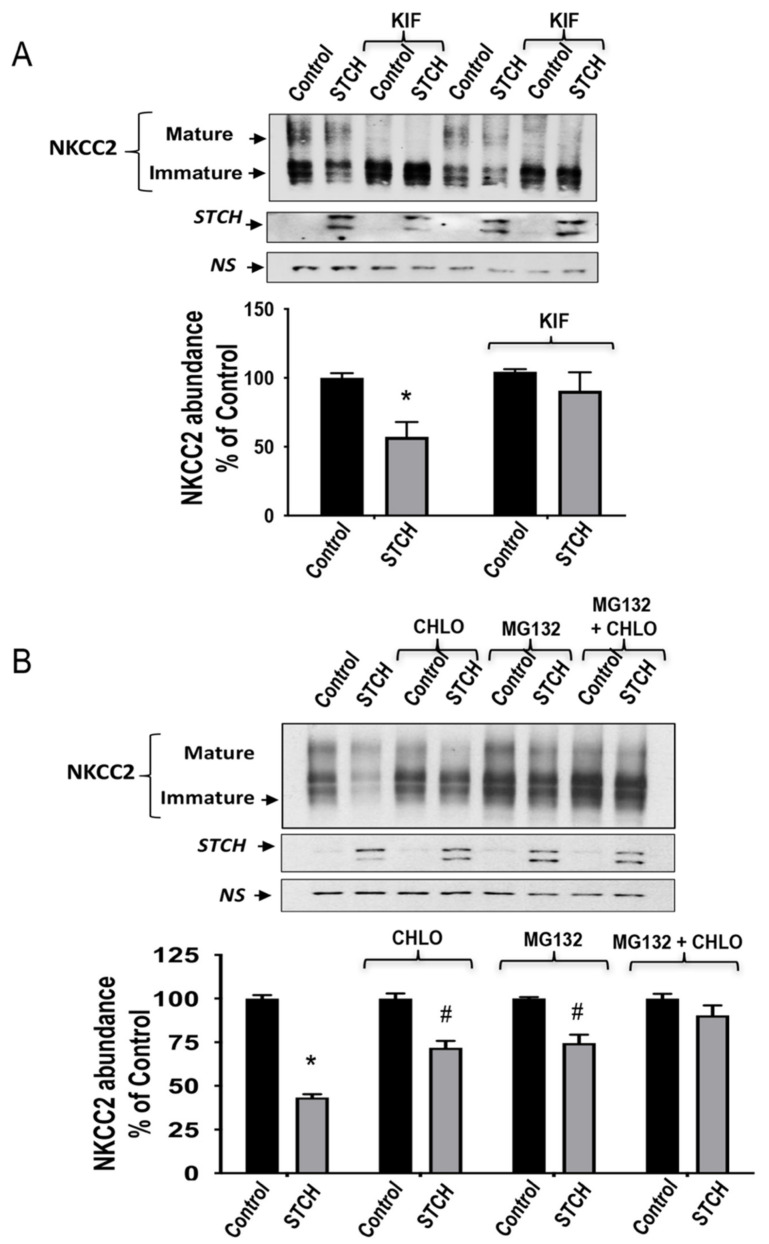
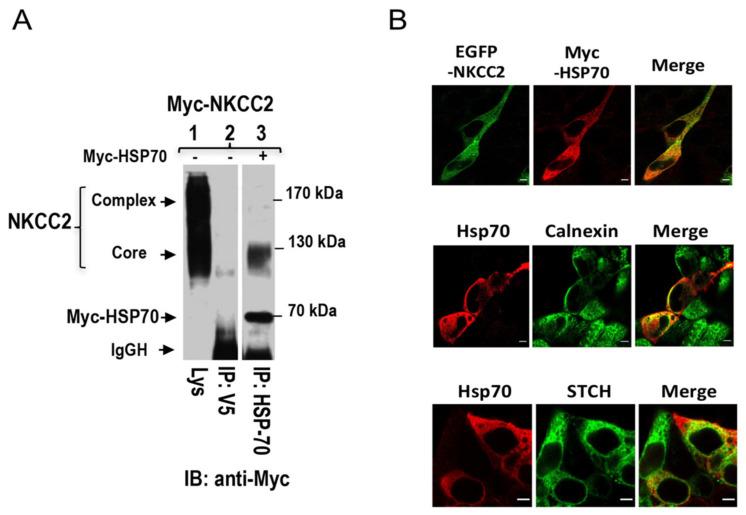
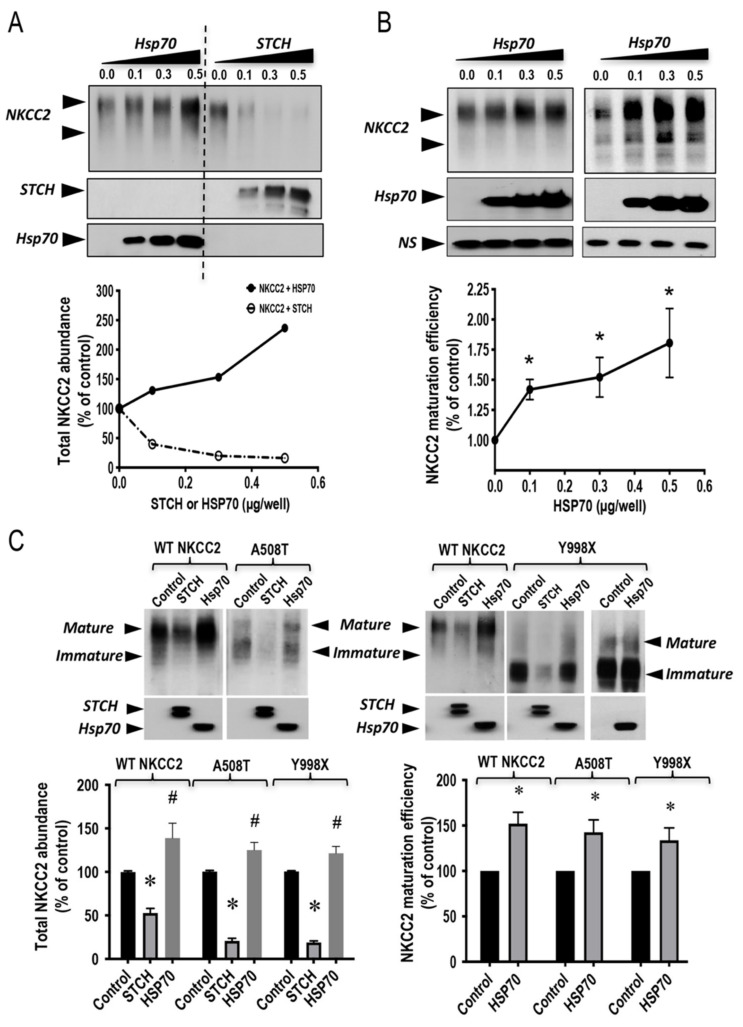
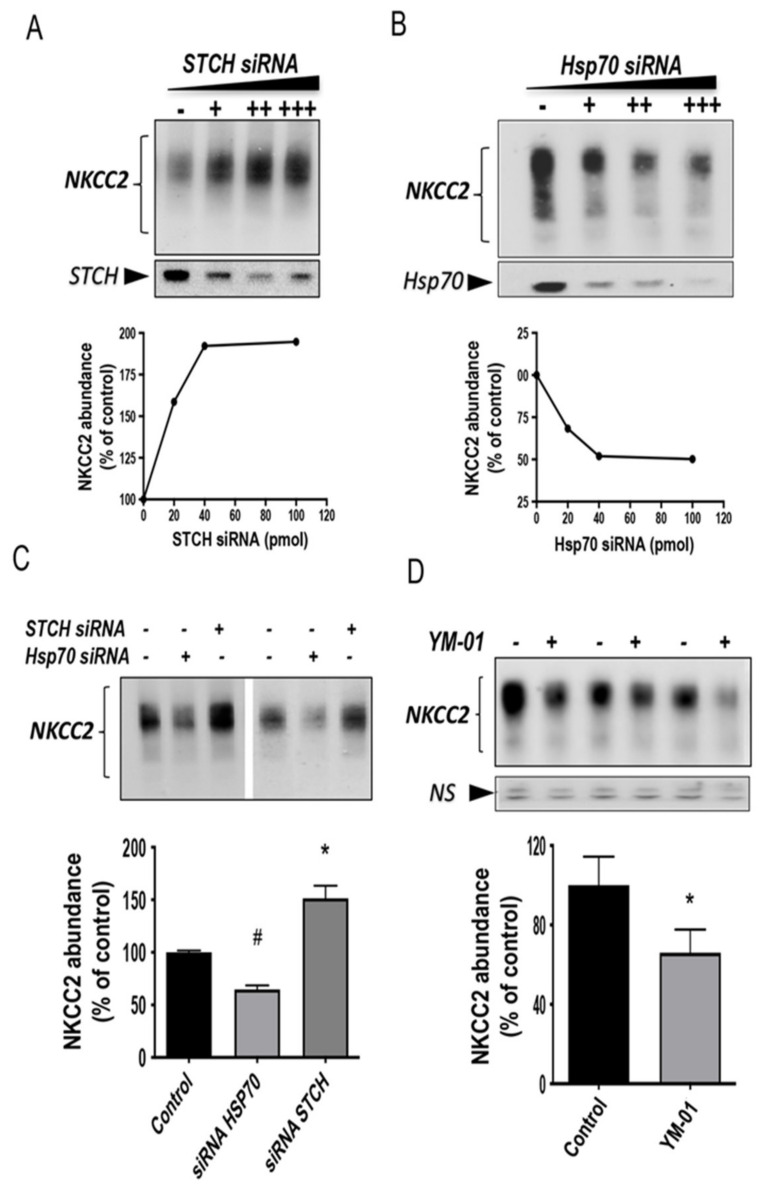
Mutations in the Na-K-2Cl co-transporter NKCC2 lead to type I Bartter syndrome, a life-threatening kidney disease. We previously showed that export from the ER constitutes the limiting step in NKCC2 maturation and cell surface expression. Yet, the molecular mechanisms involved in this process remain obscure. Here, we report the identification of chaperone stress 70 protein (STCH) and the stress-inducible heat shock protein 70 (Hsp70), as two novel binding partners of the ER-resident form of NKCC2. STCH knock-down increased total NKCC2 expression whereas Hsp70 knock-down or its inhibition by YM-01 had the opposite effect. Accordingly, overexpressing of STCH and Hsp70 exerted opposite actions on total protein abundance of NKCC2 and its folding mutants. Cycloheximide chase assay showed that in cells over-expressing STCH, NKCC2 stability and maturation are heavily impaired. In contrast to STCH, Hsp70 co-expression increased NKCC2 maturation. Interestingly, treatment by protein degradation inhibitors revealed that in addition to the proteasome, the ER associated degradation (ERAD) of NKCC2 mediated by STCH, involves also the ER-to-lysosome-associated degradation pathway. In summary, our data are consistent with STCH and Hsp70 having differential and antagonistic effects with regard to NKCC2 biogenesis. These findings may have an impact on our understanding and potential treatment of diseases related to aberrant NKCC2 trafficking and expression.

Keywords: Bartter syndrome; ERAD; Hsp70; NKCC2; STCH; hypertension; membrane; trafficking.


Conflict of interest statement

The authors declare that they have no conflict of interest with the content of this article.

Figures

Figure 1
Figure 1
Identification of STCH as a novel NKCC2-interacting protein. (A) Mouse NKCC2 yeast two-hybrid baits constructs. A proposed topology for sodium-coupled chloride co-transporter NKCC2. N442 and N452 are the potential N-glycosylation sites. As previously described, mouse NKCC2 C terminus was divided into three peptide fragments (C1-term, C2-term, and C3-term) used as baits for the yeast two-hybrid. Similar to Aldolase B [39] and SCAMP2 [40], STCH interacts with C1-term while OS9 binds to C3-term [28]. (B) NKCC2 binds, in vivo, to STCH in HEK cells. HEK cells transiently transfected with Myc-NKCC2 singly or in combination with GFP-STCH were immunoprecipitated (IP) with anti-GFP anti-body (lanes 2 and 3). 5% of total cell lysate (Lys) was resolved as positive control. Co-immunoprecipitated NKCC2 and STCH proteins were detected by immunoblotting (IB) using anti-Myc (lane 3) and anti-GFP respectively (lane 3). IgGH, the heavy chain of IgG. The positions of immature (core glycosylated) and mature (complex-glycosylated) proteins of NKCC2 are indicated. The interaction of NKCC2 with STCH involves mainly the immature form of the co-transporter. (C) Imunofluorescence confocal microscopy showing distribution of Myc-NKCC2 and GFP-STCH in HEK cells. Fixed and permeabilized cells were stained with mouse anti-Myc for NKCC2 (Texas Red). The yellow color (merged image) indicates co-localization of the proteins. Bars, 5 μm.
Figure 2
Figure 2
STCH co-localizes with NKCC2 mainly at the Endoplasmic Reticulum. (A) Intracellular localization of NKCC2 and STCH in HEK cells. All panels are fluorescence micrographs of HEK cells overexpressing NKCC2 tagged with myc and STCH tagged with GFP. After transfection, cells were fixed and immunostained with mouse anti-Myc and rabbit anti-calnexin (ER marker) antibodies, and analyzed using a confocal laser scanning microscope. The merge color indicates overlap between the Myc tag of NKCC2 protein (Alexa Fluor 647, Blue), the GFP tag of STCH (green) and the ER marker (Alexa Fluor 555, red) and represents co-localization of the proteins. Bars, 5 μm. (B) N-glycosidases digestion of STCH in HEK cells. Exogenous STCH-GFP (upper panel) and endogenous STCH (lower panel) in lysates from cells overexpressing STCH-GFP were digested with Endo H and/or PNGase F and analyzed by Western blotting. (C) Comparison between the cellular localization of STCH and several organelle markers. Cells transfected with NKCC2 tagged with myc and STCH tagged with GFP were fixed after transfection, immunostained with anti-calnexin (ER marker) or -Giantin (Golgi marker) or -GM130 (Cis Golgi marker) or -LAMP2 (Lysosomal marker) antibodies and visualized with GFP tag of STCH (green) and Alexa Fluor 555 conjugated secondary antibodies for each organelle marker. Analysis was performed by confocal laser scanning microscopy. Bars, 5 μm.
Figure 3
Figure 3
STCH alters NKCC2 stability and maturation. (A) Total NKCC2 protein abundance is reduced by STCH in a dose-dependent fashion. HEK cells were co-transfected with Myc-NKCC2 (0.2 μg/well) and increasing amounts of STCH (0.2–0.6 μg/well) as indicated. NKCC2 proteins were detected by Western blotting with Myc antibody (left panel). Right panel, densitometric analysis of total, immature, and mature NKCC2 proteins. Data are expressed as a percentage of control. *, p < 0.05 (n = 3). (B) STCH co-expression decreases the expression of NKCC2 proteins. Upper panel, representative immunoblot analysis showing the effect of STCH overexpression on NKCC2 protein abundance in HEK cells. Cells were transfected with Myc-NKCC2 alone (0.2 μg/well) or in the presence of GFP-STCH (0.6 μg/well). 16–18 h post-transfection, total cell lysates were subjected to immunoblot analysis for Myc-NKCC2 and anti-GFP. Lower panel, quantitation of steady state mature, immature, and total NKCC2 expression levels with or without STCH co-expression. Data are expressed as a percentage of control ± SE, *, p < 0.04 (n = 4); #, p < 0.003 (n = 4); **, p < 0.002 (n = 4), versus control. (C) STCH decreases NKCC2 stability and maturation. Upper panel, representative immunoblot showing cycloheximide chase analysis of NKCC2 in the presence or absence of GFP-STCH. 14–16 h post-transfection, HEK cells transiently expressing WT NKCC2 alone or in combination with STCH, were chased for the indicated time after addition of cycloheximide. Total cell lysates were separated by SDS-PAGE and probed by anti-Myc antibodies. Lower panels, quantitative analysis of NKCC2 stability and maturation. The density of the mature and immature form of NKCC2 proteins was normalized to the density at time 0. #, *; p < 0.05 (n = 3) versus control. NS, a non-specific band illustrating the equal loading of protein extracts.
Figure 4
Figure 4
The effect of STCH on NKCC2 expression is independent of the expression system. (A) STCH interacts with immature NKCC2 in OKP cells. Cells were transiently transfected with Myc-NKCC2 either singly or in combination with GFP-STCH construct. Cell lysates were immunoprecipitated (IP) with anti-GFP antibody. NKCC2 protein was recovered from STCH immunoprecipitates mainly in its immature form (lane 3). (B) Imunofluorescence confocal microscopy showing distribution of Myc-NKCC2 and GFP-STCH in OKP cells. Cells were stained with mouse anti-Myc for NKCC2 (Texas Red). The yellow color (merged image) indicates co-localization of the proteins. Bars, 5 μm. (C) Similar to HEK cells, STCH and NKCC2 co-localizes mainly at the ER in OKP cells. All panels are fluorescence micrographs of OKP cells overexpressing myc-NKCC2 and GFP-STCH. Upper panel, fixed and permeabilized cells were stained with mouse anti-Myc and rabbit anti-calnexin (ER marker) antibodies. The merge color indicates overlap between the Myc tag of NKCC2 protein (Alexa Fluor 647, Blue), the GFP tag of STCH (green), and the ER marker (Alexa Fluor 555, red) and represents co-localization of the proteins. In lower panel, fixed and permeabilized cells were stained with mouse anti-Myc and rabbit anti-GM130 (cis-Golgi marker) antibodies. The merge color indicates overlap between the Myc tag of NKCC2 protein (Alexa Fluor 647, Blue), the GFP tag of STCH (green), and the cis-Golgi marker (Alexa Fluor 555, red) and represents co-localization of the proteins. In addition to the ER, the interaction between NKCC2 and STCH may also occur at the cis-Golgi. Analysis was performed by confocal laser scanning microscopy. Bars, 5 μm. (D) Analysis of NKCC2 stability and maturation monitored by cycloheximide-chase upon STCH expression. OKP cells were co-transfected with NKCC2 together with a control vector or GFP-STCH construct. Then, 14 h later, cell lysates were prepared at the indicated time points after cycloheximide treatment (100 μM). Total protein extracts are subjected to SDS-PAGE and probed using anti-Myc antibody. The density of the mature and immature forms of NKCC2 proteins was normalized to the density at time 0. #, *; p < 0.05 (n = 3) versus control.
Figure 5
Figure 5
The ERAD of NKCC2 mediated by STCH involves both the proteasome and the lysosome. (A) Mannose trimming is required for STCH effect on NKCC2. OKP cells transiently transfected for with Myc-NKCC2 alone or with GFP-STCH, were treated with 25 μM of kifunensine (KIF) or without for 12–14 h prior to cell lysis. The cell lysates were subjected to SDS-PAGE and immunoblotted with anti-Myc and anti-GFP antibodies. Bottom, densitometric analysis of NKCC2 bands from untreated and treated cells with kifumensine (KIF). Data are expressed as percentage of control ± SE. *, p < 0.02 versus control (n = 3). (B) STCH decreases NKCC2 expression in a proteasome-dependent and lysosome dependent manner. 16 h post-transfection, HEK cells were treated with or without 2 μm MG132 or 100 μm chloroquine for 6 h prior to cell lysis. The cell lysates were subjected to immunoblotting with anti-Myc and anti-GFP antibodies. Bottom, densitometric analysis of NKCC2 bands from untreated and treated cells with MG132 or chloroquine (CHLO). Data are expressed as percentage of control ±S.E. #, p < 0.05 versus control (n = 3). NS, a non-specific band illustrating the equal loading of protein extracts.
Figure 6
Figure 6
NKCC2 interacts with the stress-inducible Hsp70. (A) Hsp70 interacts also with immature NKCC2. Cell lysates from OKP cells transiently transfected with Myc-NKCC2 singly or in combination with of Myc-Hsp70 were immunoprecipitated (IP) with anti-Hsp70 or anti-V5 antibody. NKCC2 protein was recovered from Hsp70 immunoprecipitates only in its immature form (lane 3). (B) Similar to STCH, Hsp70, and NKCC2 co-localizes at the ER. Upper panel, immunofluorescence confocal microscopy showing distribution of NKCC2 and Hsp70 in HEK cells. Transiently transfected HEK cells with EGFP-NKCC2 and Myc-HSP70, were fixed, permeabilized, and then stained with mouse anti-Myc for NKCC2 (Texas Red). The yellow color (merged image) illustrates co-localization of the proteins. Middle panel, HEK cells transfected with Myc-Hsp70 were stained with mouse anti-Myc (Texas Red; red) and rabbit anti-calnexin (FITC; green). Yellow indicates overlap between Hsp70 (red) and the ER marker (green). Lower panel, STCH colocalizes with Hsp70. HEK cells transiently transfected with GFP-STCH and Myc-Hsp70, were fixed and permeabilized before being stained with mouse anti-Myc for Hsp70 (Texas red, Red). Yellow illustrates overlap between Hsp70 (red) and the STCH (green). Bars, 5 μm.
Figure 7
Figure 7
STCH and Hsp70 differentially regulate NKCC2 and its disease-causing mutants. (A) Representative immunoblot of two independent experiments showing opposite effects of STCH and Hsp70 on NKCC2 protein abundance. HEK cells were co-transfected with Myc-NKCC2 (0.1 μg/well) and increasing amounts of GFP-STCH (0.1–0.5 μg/well) or Myc-Hsp70 (0.1–0.5 μg/well) as indicated. NKCC2, Hsp70, and STCH proteins were detected by immunoblotting with anti-Myc and anti-GFP anti-bodies. Lower panel, densitometric analysis of total NKCC2 proteins. Data are expressed as a percentage of control (n = 2). (B) Hsp70 co-expression increases NKCC2 maturation efficiency. Upper panel, two representative immunoblots illustrating the effect of Hsp70 overexpression on NKCC2 protein abundance and maturation in HEK cells. Cells were transfected with Myc-NKCC2 alone (0.1 μg/well) or in the presence of Myc-Hsp70 (0.1–0.5 μg/well). Then, 24–48 h post-transfection, total cell lysates were subjected to immunoblot analysis for NKCC2 and Hsp70 proteins using anti-Myc. NS, a non-specific band illustrating the equal loading of protein extracts. Lower panel, densitometric analysis of the maturation efficiency (ratio of the mature vs. immature form of NKCC2) of WT NKCC2 in the presence or absence of Hsp70. Data are expressed as percentage of control ± S.E. Each point represents mean ± SE from three independent experiments (n = 3). *, p < 0.05 versus control. (C) Differential regulation of NKCC2 mutants by STCH and Hsp70. HEK cells were transiently transfected with NKCC2 or BS1 mutants (A508T or Y998X) in the presence or absence of STCH or Hsp70, as indicated. NKCC2, Hsp70, and STCH proteins were detected by immunoblotting with Myc antibody and anti-GFP. Lower right panel, densitometric analysis of total NKCC2 proteins. Data are expressed as a percentage of control. * and #, p < 0.05 versus control. NKCC2 alone, n = 6. NKCC2 with STCH, n = 5. NKCC2 with Hsp70, n = 5. A508T alone, n = 4. A508T with STCH, n = 3. A508T with Hsp70, n = 3. Y998X alone, n = 6. Y998X with STCH, n = 3. Y998X with Hsp70, n = 4. Lower left panel, densitometric analysis of the maturation efficiency (ratio of the mature vs. immature form of NKCC2) of WT NKCC2 (n = 3), A508T (n = 3), and Y998X (n = 4), the presence or absence of Hsp70. Data are expressed as percentage of control ± S.E. *, p < 0.05 versus control.
Figure 8
Figure 8
Differential regulation of NKCC2 expression by endogenous Hsp70 and STCH. (A,B) Knockdown of endogenous STCH or Hsp70 in HEK cells regulate total NKCC2 protein abundance in a dose-dependent fashion. Upper panels, representative immunoblot analysis of two independent experiments illustrating the effect of STCH knockdown (upper left panel) or Hsp70 knockdown (lower right panel) on NKCC2. HEK cells were transfected with NKCC2 in the absence (-) or presence of an increasing amount (+, ++, +++) of specific STCH siRNA or Hsp70 siRNA. 48 h post-transfection, total cell extract from each sample was run on a parallel SDS gel and Western blotted for total NKCC2 expression. NKCC2 proteins were detected by immunoblotting with Myc antibody. Lower panels, densitometric analysis of total NKCC2 proteins. Data are expressed as percentage of control (n = 2). (C) Opposite effects of STCH and Hsp70 knockdowns on total NKCC2 protein. Representative immunoblot analysis showing the effect of Hsp70 knockdown and STCH knockdown on total NKCC2. HEK cells were transfected with NKCC2 in the absence (−) or presence of specific Hsp70 siRNA (+) or STCH siRNA (+). Then, 48 h post-transfection, total cell extract from each sample was subjected to immunoblotting analysis. Lower panel, densitometric analysis of total NKCC2 proteins. Data are expressed as percentage of control. Each point represents mean ± SE from four independent experiments (n = 4). #, p < 0.05 versus control. *, p < 0.003 versus control. (D) Effect of Hsp70 inhibitor YM-01 on NKCC2. HEK cells transfected with NKCC2 were treated with 1 μM of YM-01 (+) or without (−) overnight before cell lysis and immunoblotting using anti-Myc for NKCC2. NS, a non-specific band illustrating the equal loading of protein extracts. Lower panel, densitometric analysis of total NKCC2 proteins. Data are expressed as percentage of control. Each point represents mean ± SE from three independent experiments (n = 3). *, p < 0.05 versus control.

References

    1. Gamba G. Molecular physiology and pathophysiology of electroneutral cation-chloride cotransporters. Physiol. Rev. 2005;85:423–493. doi: 10.1152/physrev.00011.2004. - DOI - PubMed
    1. Hebert S.C., Gamba G. Molecular cloning and characterization of the renal diuretic-sensitive electroneutral sodium-(potassium)-chloride cotransporters. Clin. Investig. 1994;72:692–694. doi: 10.1007/BF00212991. - DOI - PubMed
    1. Gamba G., Miyanoshita A., Lombardi M., Lytton J., Lee W.S., Hediger M.A., Hebert S.C. Molecular cloning, primary structure, and characterization of two members of the mammalian electroneutral sodium-(potassium)-chloride cotransporter family expressed in kidney. J. Biol. Chem. 1994;269:17713–17722. doi: 10.1016/S0021-9258(17)32499-7. - DOI - PubMed
    1. Nielsen S., Maunsbach A.B., Ecelbarger C.A., Knepper M.A. Ultrastructural localization of Na-K-2Cl cotransporter in thick ascending limb and macula densa of rat kidney. Am. J. Physiol. 1998;275:F885–F893. doi: 10.1152/ajprenal.1998.275.6.F885. - DOI - PubMed
    1. Edwards A., Castrop H., Laghmani K., Vallon V., Layton A.T. Effects of NKCC2 isoform regulation on NaCl transport in thick ascending limb and macula densa: A modeling study. Am. J. Physiol. Renal Physiol. 2014;307:F137–F146. doi: 10.1152/ajprenal.00158.2014. - DOI - PMC - PubMed

MeSH terms

Substances

LinkOut - more resources