. 2021 Feb 23;22(4):2209.
doi: 10.3390/ijms22042209.

Divalent Cation Modulation of Ion Permeation in TMEM16 Proteins

Affiliations

Divalent Cation Modulation of Ion Permeation in TMEM16 Proteins

Dung M Nguyen et al. Int J Mol Sci. .

Abstract

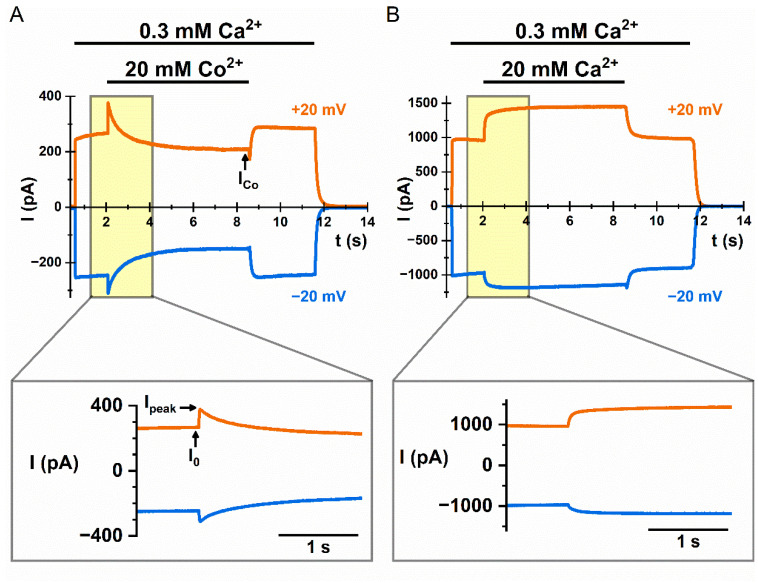
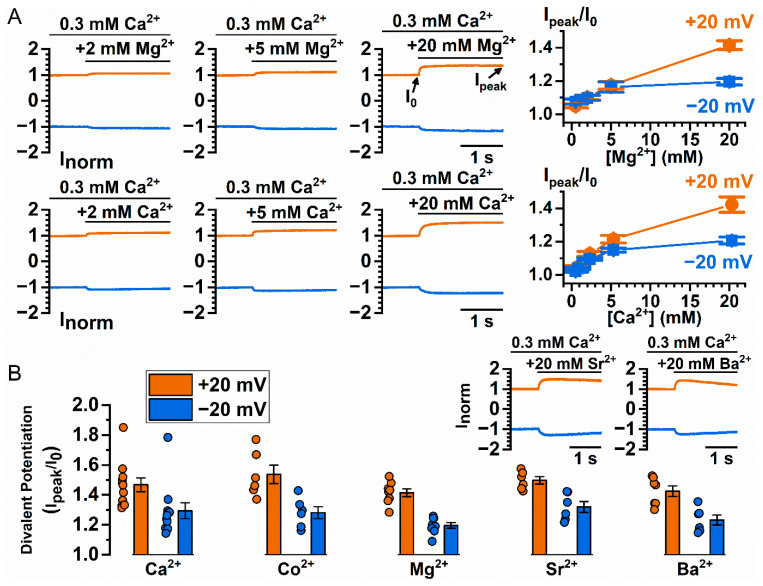
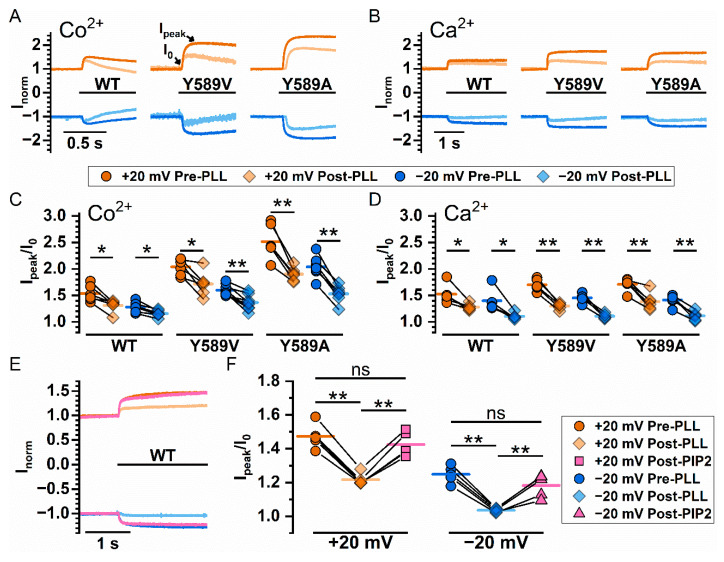
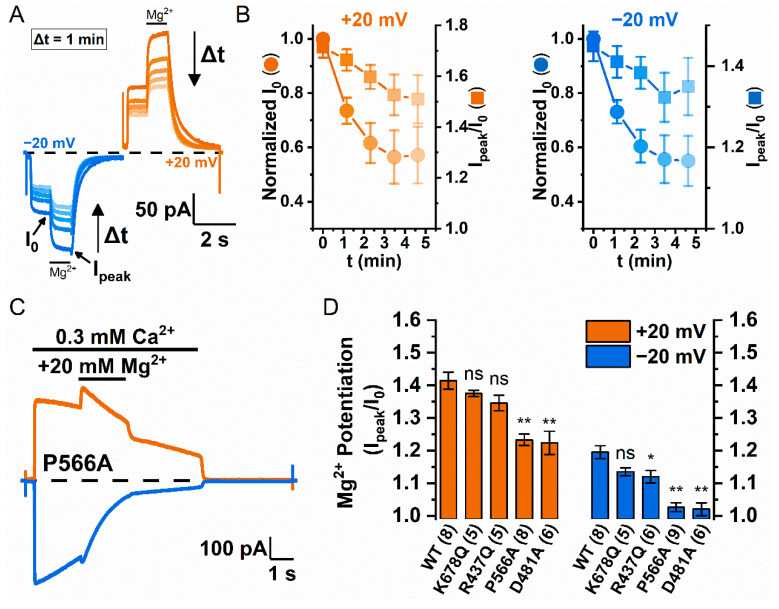
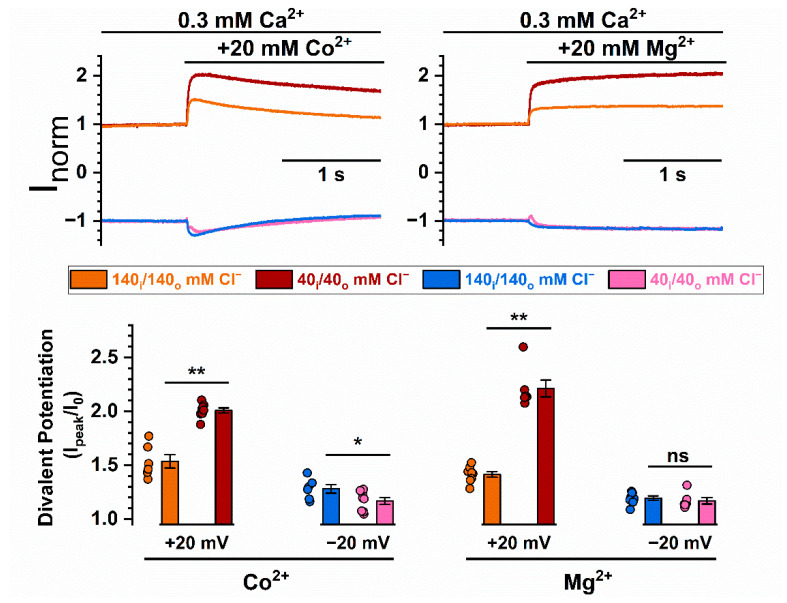
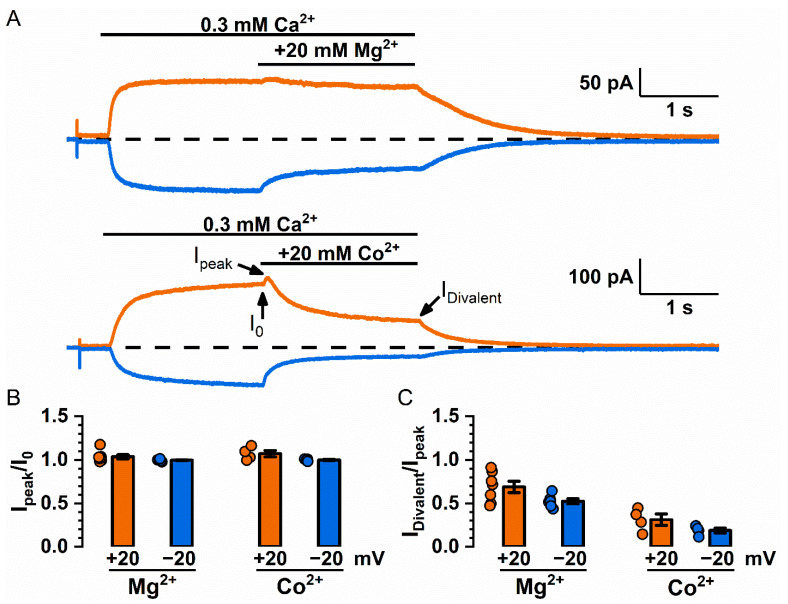
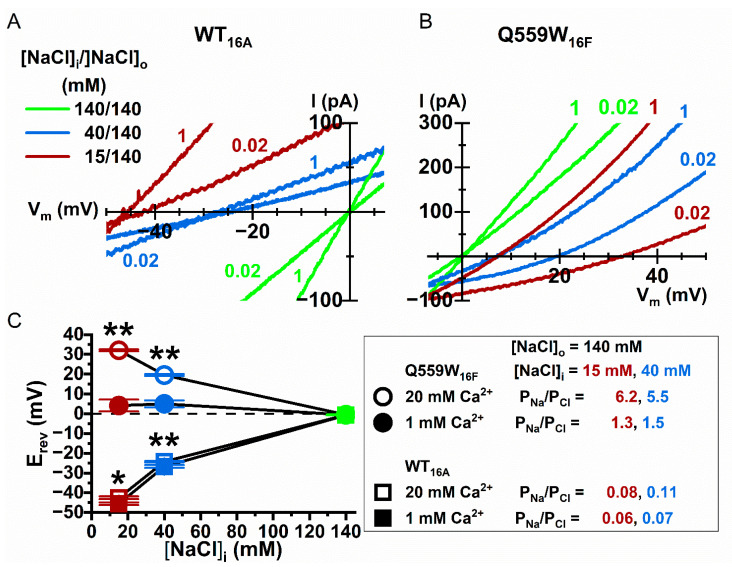
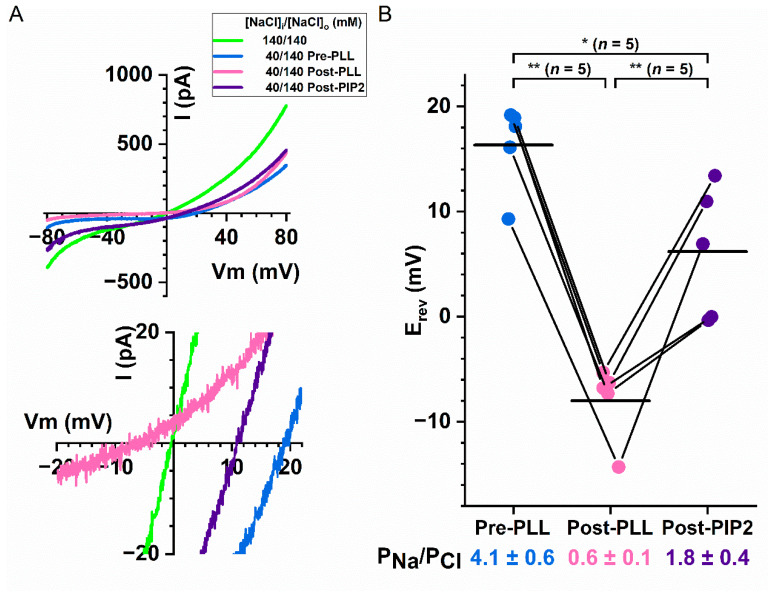
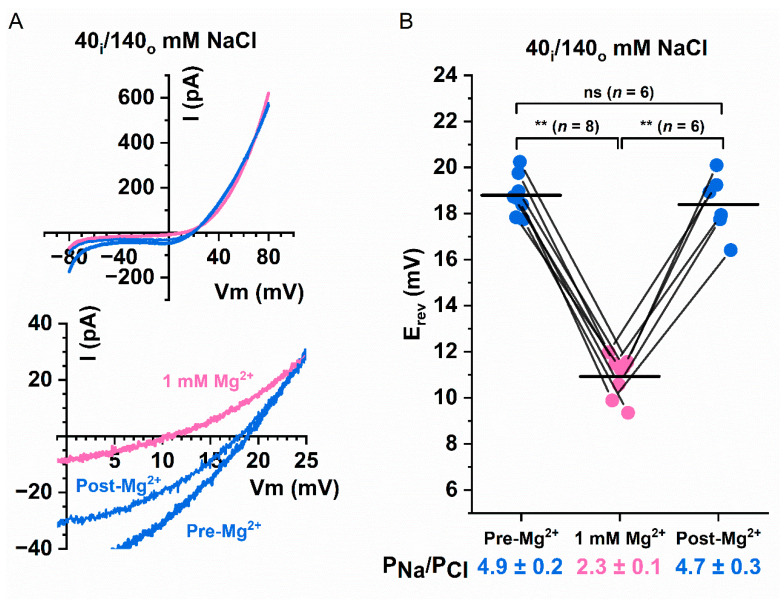
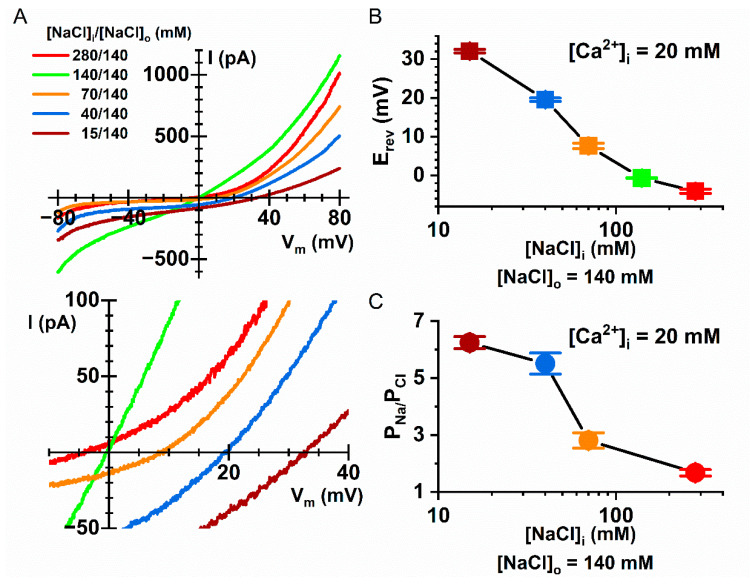
Intracellular divalent cations control the molecular function of transmembrane protein 16 (TMEM16) family members. Both anion channels (such as TMEM16A) and phospholipid scramblases (such as TMEM16F) in this family are activated by intracellular Ca2+ in the low µM range. In addition, intracellular Ca2+ or Co2+ at mM concentrations have been shown to further potentiate the saturated Ca2+-activated current of TMEM16A. In this study, we found that all alkaline earth divalent cations in mM concentrations can generate similar potentiation effects in TMEM16A when applied intracellularly, and that manipulations thought to deplete membrane phospholipids weaken the effect. In comparison, mM concentrations of divalent cations minimally potentiate the current of TMEM16F but significantly change its cation/anion selectivity. We suggest that divalent cations may increase local concentrations of permeant ions via a change in pore electrostatic potential, possibly acting through phospholipid head groups in or near the pore. Monovalent cations appear to exert a similar effect, although with a much lower affinity. Our findings resolve controversies regarding the ion selectivity of TMEM16 proteins. The physiological role of this mechanism, however, remains elusive because of the nearly constant high cation concentrations in cytosols.

Keywords: TMEM16A; TMEM16F; divalent cations; permeability ratio; phospholipids.


Conflict of interest statement

The authors declare no conflict of interest.

Figures

Figure 1
Figure 1
Potentiation of the TMEM16A current by intracellular Co2+ and Ca2+. TMEM16A currents were obtained at voltages clamped at −20 mV (blue traces) and +20 mV (orange traces). Currents were activated by 0.3 mM intracellular calcium concentration ([Ca2+]i). (A) Recording traces showing the dual effects, inhibition and potentiation on the wild-type TMEM16A (WT16A) current by 20 mM intracellular cobalt concentration ([Co2+]i). (B) Recording traces showing potentiation of WT16A by 20 mM [Ca2+]i. In the bottom panel of both A and B, an expanded view of the yellow shaded area in the upper panel is depicted to focus on the current potentiation. I0 represents the control current before the application of divalent cations, whereas Ipeak and ICo represent the peak current after the application of Co2+ and the quasi-steady-state current at the end of the Co2+ application, respectively.
Figure 2
Figure 2
Potentiation of WT16A current by various divalent cations. (A) Dose-dependent Mg2+ and Ca2+ potentiation of the WT16A current. Left three panels show raw recording traces of Mg2+ or Ca2+ potentiation of WT16A current. The currents were normalized to the current immediately before the application of mM intracellular concentration of magnesium ([Mg2+]) or [Ca2+]. Right panel shows averaged potentiation of WT16A current as a function of [Mg2+] (n = 5–8) or [Ca2+] (n = 6–7). (B) Averaged potentiation of 0.3 mM [Ca2+]i-induced WT16A current by 20 mM Ca2+, Co2+, Mg2+, Sr2+ or Ba2+ (n = 6–11). Insets show raw recording traces of Sr2+ or Ba2+ potentiation of WT16A current.
Figure 3
Figure 3
Manipulating Co2+ and Ca2+ potentiation of WT16A, Y589V16A, and Y589A16A by intracellular reagents that affect membrane phospholipids. (A,B) Representative recordings showing Co2+ and Ca2+ potentiation, respectively, before and after treating the patch with poly-l-lysine (PLL, 0.3 mg/mL) for 5 sec. All currents were induced by 0.3 mM [Ca2+]i and potentiated with an additional 20 mM Co2+ or Ca2+ (black bars underneath phenotype labels). (C,D) Degree of Co2+ and Ca2+ potentiation, respectively, before and after poly-l-lysine treatment. Orange (+20 mV) and blue (−20 mV) circles are the potentiation before poly-l-lysine treatment while light orange (+20 mV) and light blue (−20 mV) diamonds are the potentiation after poly-l-lysine. (E,F) Effects of PIP2 for reversing the effect of poly-l-lysine on the Ca2+-induced potentiation of the WT16A current. Degree of Ca2+ potentiation was measured before poly-l-lysine treatment, after poly-l-lysine treatment, and after PIP2 treatment. In (C,D,F), data points from the same patch are connected by solid lines, and colored horizontal line segments represent the mean of the data set. ns p > 0.05; * p < 0.05; ** p < 0.005 by one-way ANOVA followed by Bonferroni’s multiple comparisons.
Figure 4
Figure 4
Involvement of Phospholipids in divalent cation-induced potentiation. (A) Representative recording traces are depicted to illustrate the decrease in Mg2+ potentiation of Y589A16A after channel rundown. For every minute, current was elicited with 100 µM Ca2+ (a concentration chosen for reducing the speed of rundown), and 20 mM Mg2+ were applied subsequently for 1 s (black bar above traces). (B) Reduction of Mg2+ potentiation (Ipeak/I0) over time at +20 mV (left panel, orange) and −20 mV (right panel, blue) (n = 6–9). The rundown of the control current (I0 normalized to the I0 of the trace at t = 0 min) is shown by circles, whereas the reduction of the Mg2+ potentiation is shown by squares. (C) Mg2+ potentiation of a PIP2 binding-site mutant P566A16A at ±20 mV. The P566A16A current was easier to run down and the degree of potentiation was also smaller compared to that in WT16A. (D) Comparing Mg2+ potentiation at ±20 mV between WT16A (replotted from Figure 1) and four mutants (numbers below each column are the number of patches). ns p > 0.05; * p < 0.05; and ** p < 0.005 by one-way ANOVA followed by Bonferroni’s multiple comparisons.
Figure 5
Figure 5
Enhanced divalent cation potentiation of WT16A in low ionic strength solutions. (Top) Recording traces comparing the Co2+ or Mg2+ potentiation of WT16A between conditions of symmetrical 140 mM and 40 mM NaCl. The 40 mM NaCl solution also contains 100 mM D-mannitol. All currents were induced by 0.3 mM [Ca2+]i. (Bottom) Bar graph summarizing Co2+ and Mg2+ potentiation under symmetrical 140 mM or 40 mM NaCl (n = 6–8). ns p > 0.05; * p < 0.05; ** p < 0.005 by one-way ANOVA followed by Bonferroni’s multiple comparisons.
Figure 6
Figure 6
Potentiation and inhibition of the Q559W16F current by Mg2+ and Co2+. (A) Representative recording traces for the Mg2+ and Co2+ effects on the Q559W16F current (induced by 0.3 mM [Ca2+]i). (B) Averaged potentiation (Ipeak/I0) of Mg2+ and Co2+ on the Q559W16F current. (C) Averaged inhibition (IDivalent/Ipeak, i.e., IMg/Ipeak or ICo/Ipeak) of Mg2+ and Co2+ on the Q559W16F current.
Figure 7
Figure 7
Intracellular Ca2+ effect on the Na+ versus Cl- permeability ratios (PNa/PCl) of TMEM16 currents. Representative I–V curves for (A) WT16A and (B) Q559W16F under asymmetrical [NaCl]. [NaCl]o = 140 mM in all recordings, whereas [NaCl]i was 140 mM (green), 40 mM (blue) and 15 mM (red), respectively. The reduced [NaCl]i in the 40 and 15 mM [NaCl]i solutions was replaced with D-mannitol. Currents were elicited with either 0.02 mM or 1 mM [Ca2+]i, indicated by the colored numbers next to each curve. (C) Summary of reverse potential (Erev) measured under asymmetrical [NaCl] for WT16A (squares) and Q559W16F (circles). The PNa/PCl ratios (calculated based on the Goldman–Hodgkin–Katz equation, see equation 1 in Materials and Methods) of WT16A and Q559W16F are shown in the box on the right and in Table 1 (n = 5–15). * p < 0.05; ** p < 0.005 by one-way ANOVA followed by Bonferroni’s multiple comparisons.
Figure 8
Figure 8
Effects of manipulating membrane phospholipids on the PNa/PCl ratio of Q559W16F. All experiments were performed with 20 µM [Ca2+]i. [NaCl]o = 140 mM in all experiments. (A) Representative I–V curves of Q559W16F in various intracellular solutions; −80 mV to +80 mV are shown in the top panel, whereas the expanded traces near reversal potentials are depicted at the bottom. Experiments were first performed in 140 mM [NaCl]i (green traces), followed by experiments in 40 mM [NaCl]i before (blue traces) and after (pink traces) 0.3 mg/mL intracellular poly-l-lysine treatment for 5 sec. Finally, the I–V curve was obtained after the patch was intracellularly treated with 20 µM PIP2 for 1 min (purple traces). (B) Altering the PNa/PCl ratio of Q559W16F after treating membrane patches with intracellular poly-l-lysine or PIP2. Results are from experiments like those shown in (A) and data points from the same patch are connected by line segments. Horizontal lines depict the averaged reversal potentials from individual data set. The mean PNa/PCl ratios (± SEM) at the bottom of the plot were calculated according to equation 1. * p < 0.05; ** p < 0.005 by one-way ANOVA followed by Bonferroni’s multiple comparisons.
Figure 9
Figure 9
Effects of [Mg2+]i on the PNa/PCl ratio of Q559W16F. (A) Representative I–V curves of Q559W16F under asymmetrical [NaCl] in the presence and absence of 1 mM Mg2+. Currents were activated by 20 µM [Ca2+]i. Bottom panel shows the same I–V curves expanded around Erev. (B) Paired data showing the values of Erev in the presence (pink circles) of 1 mM Mg2+, and the values of Erev before Mg2+ wash-in and after Mg2+ wash-out (blue circles). Horizontal black lines indicate the mean value for each data set. Calculated PNa/PCl ratios are shown at the bottom of the plot. ns p > 0.05; ** p < 0.005 by one-way ANOVA followed by Bonferroni’s multiple comparisons.
Figure 10
Figure 10
Dependence of the PNa/PCl ratio of Q559W16F on [NaCl]i. (A) Representative I–V curves for Q559W16F in various [NaCl]i (from 15 to 280 mM). In all recordings, [NaCl]o = 140 mM and the currents were activated by 20 µM [Ca2+]i. The same I–V curves expanded around the Erev are shown in the bottom panel. (B) Averaged Erev as a function of [NaCl]i from the recordings like those shown in A. (C) PNa/PCl ratio as a function of [NaCl]i. Note the reduction of the PNa/PCl ratio as [NaCl]i increases (n = 6–22).
Figure 11
Figure 11
Illustration of divalent cation effects on TMEM16 molecules. (A) High resolution structure of the “ac” alternatively spliced variant of TMEM16A (left, PDB:5OYB). The six transmembrane helices (helices 3–8) of a single subunit forming the ion-conduction pathway are rotated 90° clockwise along the axis perpendicular to the cell membrane (right). Helix 4 is colored in orange, whereas all other helices are colored in green. Residue K584 of the alternatively spliced “a” variant of TMEM16A (used in our experiments) and residue Q559 of TMEM16F corresponds to residue K588 of the TMEM16A “ac” variant (colored in red). Y589 of the TMEM16A “a” variant mentioned in the text corresponds to Y593 in the TMEM16A “ac” variant (colored in blue). Light purple oval roughly depicts the intracellular pore vestibule. (B) Intracellular view perpendicular to the cell membrane of a single subunit. (Left) all transmembrane helices (with helix numbers) are shown. (Right) Cartoon model of the six pore-forming helices depicted as cylinders (same orientation as that in the left panel). Intracellular leaflet of cell membranes contains negatively charged phospholipids (yellow circles labeled with “−”) as well as neutral ones (yellow circles without “−”). PIP2 molecules are depicted as salmon-color circles with “3−”. The Ca2+ ions at the activation sites are colored in pink. Monovalent (not shown), divalent (depicted as small green circles) or even multivalent cations (not shown) can bind to phospholipid head groups, consequently decreasing the negative potential from phospholipids. Four mutations associated with PIP2 regulations of TMEM16A studied in this paper are shown. Notice that residues P556 (dark green star) and D481 (purple diamond) appear to be closer to the intracellular pore vestibule than residues R437 (cyan down triangle) and K678 (brown hexagon).

Similar articles

Cited by

References

    1. Falzone M.E., Malvezzi M., Lee B.-C., Accardi A. Known structures and unknown mechanisms of TMEM16 scramblases and channels. J. Gen. Physiol. 2018;150:933–947. doi: 10.1085/jgp.201711957. - DOI - PMC - PubMed
    1. Whitlock J.M., Hartzell H.C. Anoctamins/TMEM16 Proteins: Chloride Channels Flirting with Lipids and Extracellular Vesicles. Annu. Rev. Physiol. 2017;79:119–143. doi: 10.1146/annurev-physiol-022516-034031. - DOI - PMC - PubMed
    1. Caputo A., Caci E., Ferrera L., Pedemonte N., Barsanti C., Sondo E., Pfeffer U., Ravazzolo R., Zegarra-Moran O., Galietta L.J.V. TMEM16A, A Membrane Protein Associated with Calcium-Dependent Chloride Channel Activity. Science. 2008;322:590–594. doi: 10.1126/science.1163518. - DOI - PubMed
    1. Schroeder B.C., Cheng T., Jan Y.N., Jan L.Y. Expression Cloning of TMEM16A as a Calcium-Activated Chloride Channel Subunit. Cell. 2008;134:1019–1029. doi: 10.1016/j.cell.2008.09.003. - DOI - PMC - PubMed
    1. Yang Y.D., Cho H., Koo J.Y., Tak M.H., Cho Y., Shim W.-S., Park S.P., Lee J., Lee B., Kim B.-M., et al. TMEM16A confers receptor-activated calcium-dependent chloride conductance. Nat. Cell Biol. 2008;455:1210–1215. doi: 10.1038/nature07313. - DOI - PubMed

MeSH terms