. 2021 Feb 23;10(2):478.
doi: 10.3390/cells10020478.

IQGAP1 Is a Scaffold of the Core Proteins of the Hippo Pathway and Negatively Regulates the Pro-Apoptotic Signal Mediated by This Pathway

Affiliations

IQGAP1 Is a Scaffold of the Core Proteins of the Hippo Pathway and Negatively Regulates the Pro-Apoptotic Signal Mediated by This Pathway

Niall P Quinn et al. Cells. .

Abstract

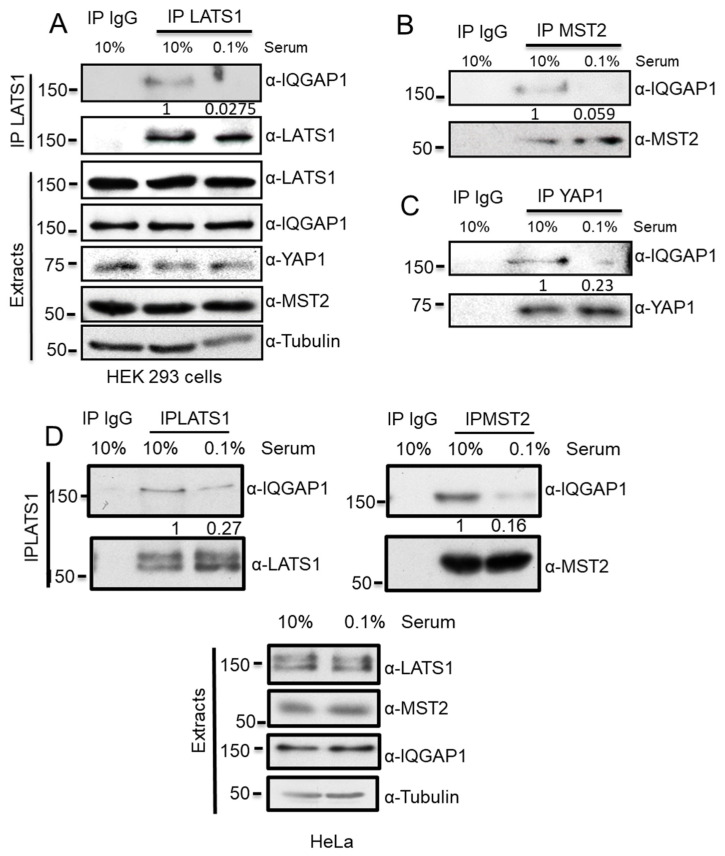
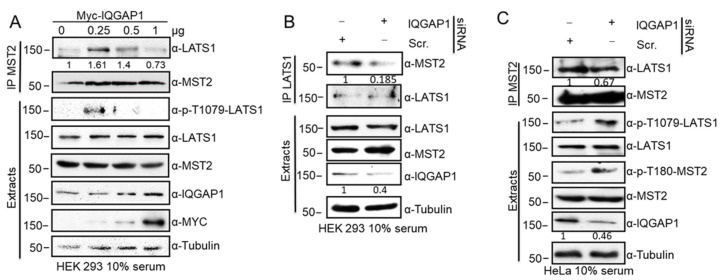
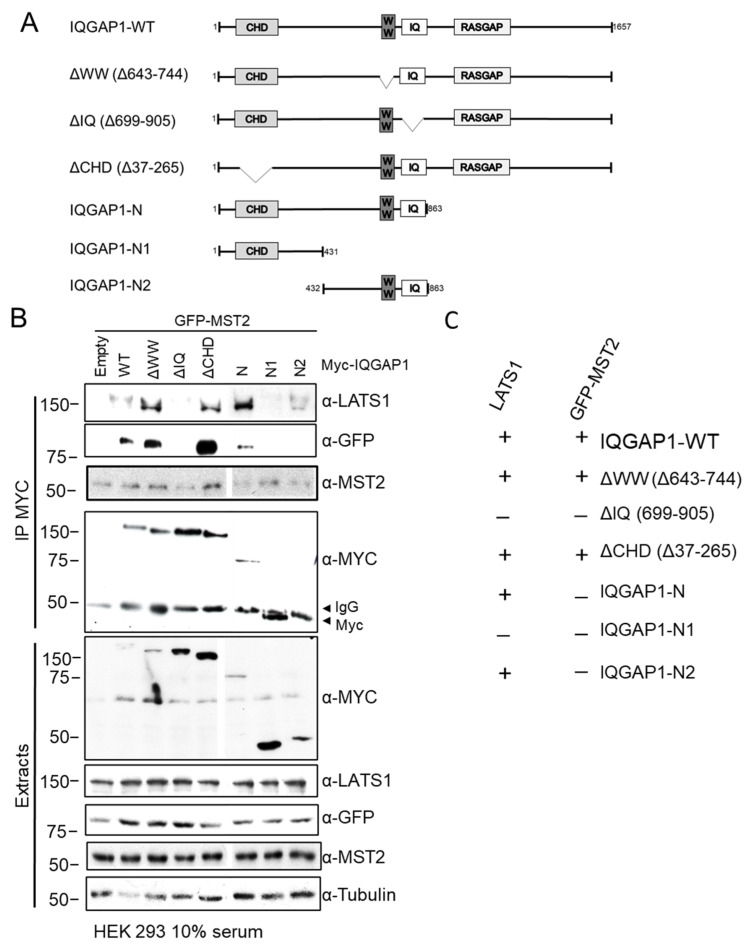
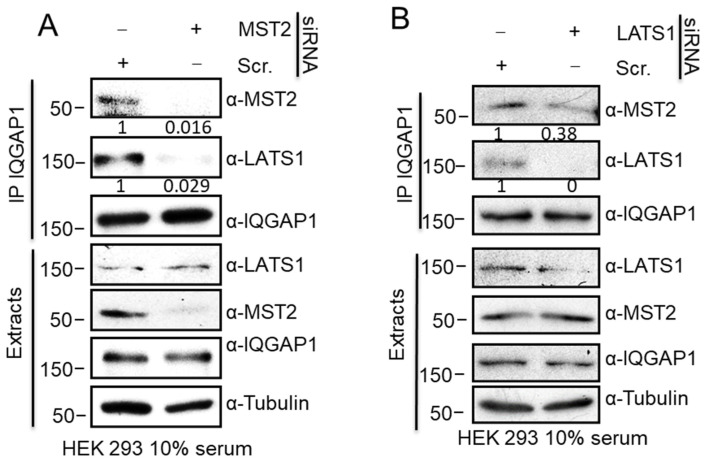
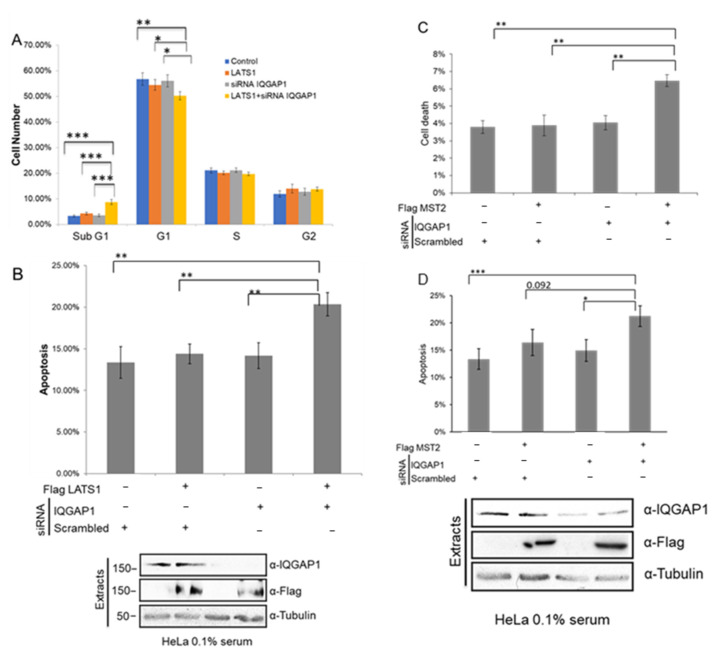
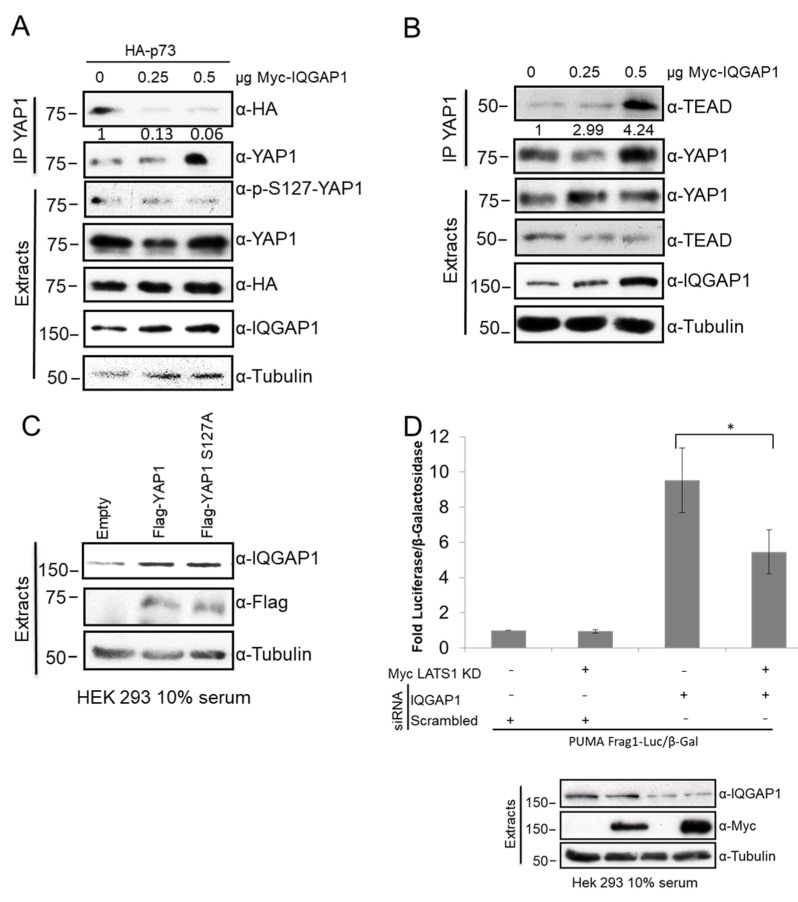
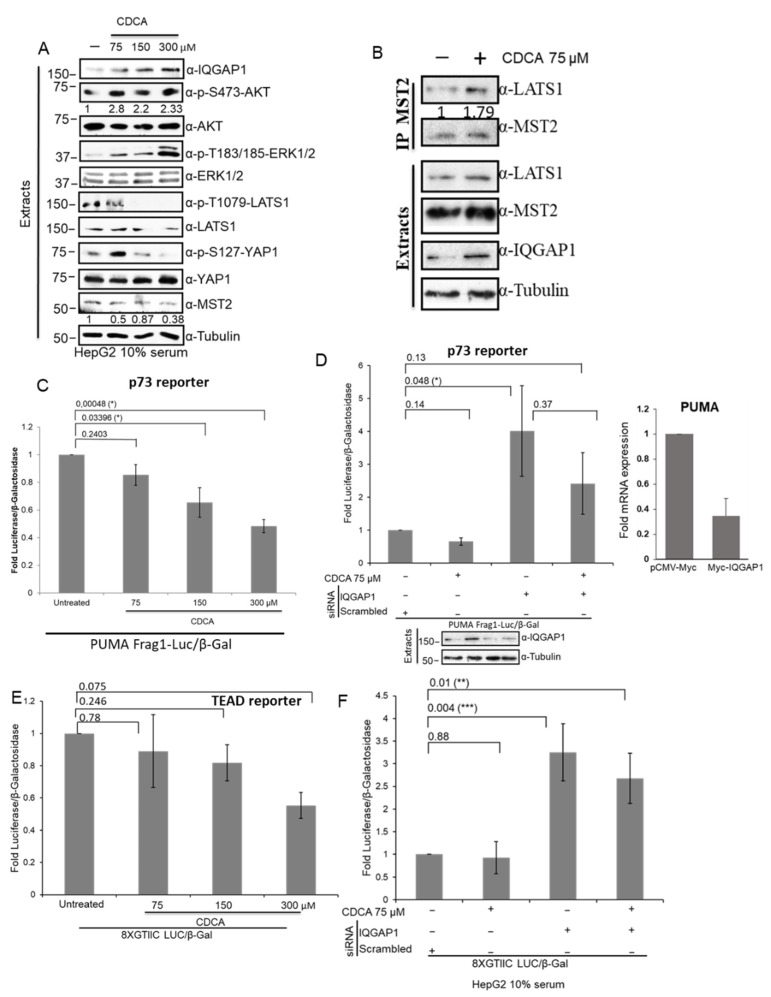
The Hippo pathway regulates a complex signalling network which mediates several biological functions including cell proliferation, organ size and apoptosis. Several scaffold proteins regulate the crosstalk of the members of the pathway with other signalling pathways and play an important role in the diverse output controlled by this pathway. In this study we have identified the scaffold protein IQGAP1 as a novel interactor of the core kinases of the Hippo pathway, MST2 and LATS1. Our results indicate that IQGAP1 scaffolds MST2 and LATS1 supresses their kinase activity and YAP1-dependent transcription. Additionally, we show that IQGAP1 is a negative regulator of the non-canonical pro-apoptotic pathway and may enable the crosstalk between this pathway and the ERK and AKT signalling modules. Our data also show that bile acids regulate the IQGAP1-MST2-LATS1 signalling module in hepatocellular carcinoma cells, which could be necessary for the inhibition of MST2-dependent apoptosis and hepatocyte transformation.

Keywords: Hippo; IQGAP1; LATS1; MST2; YAP1; bile acid; hepatocellular carcinoma.


Conflict of interest statement

The authors declare no conflict of interest. The funders had no role in the design of the study; in the collection, analyses or interpretation of data; in the writing of the manuscript, or in the decision to publish the results.

Figures

Figure 1
Figure 1
IQGAP specifically interacts with the core proteins of the MST/Hippo pathway. HEK 293 cells were grown in 10% serum or serum deprived (0.1% serum) for 16 h. (A) Endogenous LATS1 immunoprecipitates were analysed by western blot with the indicated antibodies. (B) Endogenous MST2 immunoprecipitates were analysed by western blot with the indicated antibodies. (C) Endogenous YAP1 immunoprecipitates were analysed by western blot with the indicated antibodies. IgG indicates isotypic antibody that was used as negative control for unspecific binding to protein G agarose beads. (D) HeLa cells grown in 10% serum or 0.1% serum and endogenous LATS1 or MST2 were immunoprecipitated. IQGAP co-immunoprecipitation was monitored using a specific antibody. Expression of the indicated proteins in cell extracts was detected by blotting with the indicated antibodies. IP blots were quantified using ImageJ and the numbers show relative fold change of IQGAP1 normalised by LATS1, MST2 or YAP1 IP blots, as indicated.
Figure 2
Figure 2
IQGAP1 scaffolds MST2-LATS1 interaction and regulates the activation of the kinases of the pathway. (A) HEK 293 cells were transfected with the indicated amounts of Myc-IQGAP1 constructs. Endogenous MST2 immunoprecipitates were analysed by western blot with the indicated antibodies. IP blots were quantified using ImageJ and the numbers show relative fold change of LATS1 normalised by MST2. (B) HEK 293 cells were transfected with IQGAP1 siRNA or a non-targeting (Scr.) siRNA pool. Endogenous MST2 and LATS1 immunoprecipitates were examined by western blotting. IQGAP1 and Tubulin blots were quantified using ImageJ and the numbers shows relative fold change of IQGAP1 normalised by Tubulin. IP blots were quantified using ImageJ and the numbers show relative fold change of MST2 normalised by LATS1. (C) HeLa cells were transfected with IQGAP1 siRNA or a non-targeting (Scr.) siRNA pool. Endogenous MST2 immunoprecipitates were examined by western blotting. Blots were quantified as in (A).
Figure 3
Figure 3
LATS1 and MST2 bind to IQGAP1 IQ domains. (A) A schematic representation of IQGAP1 full length and domain deletion mutants of IQGAP1. The protein interaction domains and the amino acid residues of each mutant are indicated. IQGAP1 Myc-tagged constructs used were wild-type IQGAP1 (WT), IQGAP1ΔWW (ΔWW), IQGAP1ΔIQ (ΔIQ), IQGAP1ΔCHD (ΔCHD), IQGAP1-N (N), IQGAP1-N1 (N1) or IQGAP1-N2 (N2). (B) HEK 293 cells were co-transfected with different Myc-IQGAP1 (2 µg) tagged deletion constructs and with GFP-MST2 (1 µg). Myc-IQGAP1 immunoprecipitates were analysed by western blotting with indicated antibodies. IgG heavy chain unspecific band and Myc specific band (~50 KDa) are indicated with ◄. All blots were spliced from the same blots and a gap has been left to make this clear. (C) Table summarises the ability of LATS1 and MST2 to bind (+) or not (−) to IQGAP1 fragments.
Figure 4
Figure 4
MST2 regulates LATS1 interaction with IQGAP1. (A). HEK 293 cells were transfected with MST2 siRNA or a non-targeting (Scr) siRNA pool. Cells were lysed after 48 h and IQGAP1 immunoprecipitates were examined by western blotting. (B) HEK 293 cells were transfected with LATS1 siRNA or a non-targeting siRNA pool. IQGAP1 immunoprecipitates were examined by western blotting. IP blots were quantified using ImageJ and the numbers show the relative fold change of MST2 or LATS1 normalised by IQGAP1 blots.
Figure 5
Figure 5
IQGAP1 regulates LATS1- and MST2-dependent apoptosis. (A) HeLa cells co-transfected with IQGAP1 or non-targeting siRNA pool and Flag-LATS1 and serum deprived for 16 h. Cell cycle distribution was assessed by PI staining using flow cytometry. (B) Upper panel: Caspase 3/7 activation of HeLa cells transfected as in A measured by FITC-VAD-FMK binding after starvation. Lower panel: Total lysates corresponding to the apoptotic assay analysed by western blot. (C) HeLa cells co-transfected with IQGAP1 or non-targeting siRNA pool and Flag-MST2 and starved for 16 h. Cell death was assessed by PI staining using flow cytometry and measuring subG1 population. (D) Upper panel: Caspase activity of HeLa cells transfected as in C measured by FITC-VAD-FMK binding after starvation. Lower panel: Total lysates corresponding to the apoptotic assay analysed by western blot. p-values were obtained by Student’s t-test, n = 3, error bars indicate SEM, * = p < 0.05, ** = p < 0.01, *** = p < 0.001.
Figure 6
Figure 6
IQGAP1 YAP interactions and YAP-dependent transcription. (A) YAP1 immunoprecipitates from HEK 293 cells co-transfected with the indicated amounts of Myc-IQGAP1 and HA-p73 (1 µg) constructs. HA-p73 co-immunoprecipitation levels were measured by western blot. IP blots were quantified using ImageJ and the numbers show relative fold change of MST2 or LATS1 normalised by IQGAP1 blots. (B) YAP1 immunoprecipitates from HEK 293 cells co-transfected with the indicated amounts of Myc-IQGAP1 construct. TEAD co-immunoprecipitation levels were measured by western blot. (C) Total protein extracts from HEK 293 cells transfected with Flag-YAP1, Flag-YAP1-S127A or the corresponding empty vector analysed by western blot. (D) Upper panel: Luciferase assay of PUMA promoter activity in HEK 293 cells co-transfected with PUMA Frag1-Luc and β-Gal plasmids, and LATS1 kinase dead mutant (KD) or the corresponding empty vector and IQGAP1 siRNA or the corresponding non-targeting siRNA pool. Luciferase activity normalised against β-galactosidase signal. Lower panel: Total lysates corresponding to the luciferase assay measured by western blot. p-values were obtained by Student’s t-test, n = 3, error bars indicate SEM, * = p < 0.05.
Figure 7
Figure 7
CDCA overload induces IQGAP1 expression and deactivates Hippo signalling. (A) HepG2 cells were treated with increasing concentrations of CDCA (75, 150 or 300 µM) for 8 h and the cells were lysed. Cell extracts were analysed by western blotting with indicated antibodies. Blots were quantified using ImageJ and the numbers show relative fold change of AKT phosphorylation normalised by total levels of AKT and level of expression of MST2 normalised by tubulin levels. (B) HepG2 cells were treated with 75 µM CDCA for 8 h. MST2 was immunoprecipitated from cell extracts using specific antibody. Immunoprecipitated proteins and cell extracts were blotted with the indicated antibodies. IP blots were quantified using ImageJ and the numbers show relative fold change of LATS1 normalised by MST2 blot. (C) HepG2 cells were co-transfected with PUMA promotor luciferase reporter (PUMA Frag1-Luc, p73 reporter) and β-galactosidase construct. Forty-eight hours after transfection, the cells were treated for 8 h with the indicated concentrations of CDCA. p73 transcriptional activity was measured by luminescence and β-galactosidase enzymatic activity was measured by absorbance. (D) Left panel. HepG2 cells were co-transfected with PUMA and β-galactosidase reporters and 50 ng/mL IQGAP1 or non- targeting siRNA pool where indicated. Forty-eight hours after transfection, the cell were treated for 8 h with 75 μM CDCA. Transcriptional activity was measured as in (C). Lower panel shows protein expression of the indicated proteins determined by western blot in a representative experiment. Right panel. HepG2 cell were transfected with 0.5 μg Myc-IQGAP1 or pCMV-Myc plasmids and PUMA mRNA expression was measured by rtPCR. The graph shows PUMA mRNA levels normalised by GAPDH mRNA expression. (E) HepG2 cells were transfected with 8XGTIIC LUC construct (TEAD reporter) β-galactosidase plasmid. Forty-eight hours after transfection, the cells were treated for 8 h with increasing concentrations of CDCA. TEAD transcriptional activity was measured and β-galactosidase enzymatic activity were measured as in C. (F) HepG2 cells were co-transfected with 8XGTIIC LUC construct (TEAD reporter) β-galactosidase plasmid and 50 ng/mL IQGAP1 or non-targeting siRNA pool, where indicated. Forty-eight hours after transfection, the cells were treated for 8 h with 75 μM CDCA. After lysis, TEAD transcriptional activity was determined as in (C). p-values were obtained by Student’s t-test, n = 3, error bars indicate mean SEM. * = p < 0.05, ** = p < 0.01, *** = p < 0.001.

Similar articles

Cited by

References

    1. Fallahi E., O’Driscoll N.A., Matallanas D. The MST/Hippo Pathway and Cell Death: A Non-Canonical Affair. Genes. 2016;7:28. doi: 10.3390/genes7060028. - DOI - PMC - PubMed
    1. Pan D. The hippo signaling pathway in development and cancer. Dev. Cell. 2010;19:491–505. doi: 10.1016/j.devcel.2010.09.011. - DOI - PMC - PubMed
    1. Matallanas D., Romano D., Hamilton G., Kolch W., O’Neill E. A Hippo in the ointment: MST signalling beyond the fly. Cell Cycle. 2008;7:879–884. doi: 10.4161/cc.7.7.5630. - DOI - PubMed
    1. Romano D., Matallanas D., Frederick D.T., Flaherty K.T., Kolch W. One Hippo and many masters: Differential regulation of the Hippo pathway in cancer. Biochem. Soc. Trans. 2014;42:816–821. doi: 10.1042/BST20140030. - DOI - PubMed
    1. Matallanas D., Romano D., Yee K., Meissl K., Kucerova L., Piazzolla D., Baccarini M., Vass J.K., Kolch W., O’Neill E. RASSF1A elicits apoptosis through an MST2 pathway directing proapoptotic transcription by the p73 tumor suppressor protein. Mol. Cell. 2007;27:962–975. doi: 10.1016/j.molcel.2007.08.008. - DOI - PMC - PubMed

Publication types

MeSH terms

Substances