

NQO1 Deficiency Aggravates Renal Injury by Dysregulating Vps34/ATG14L Complex during Autophagy Initiation in Diabetic Nephropathy
- PMID: 33672316
- PMCID: PMC7926338
- DOI: 10.3390/antiox10020333
NQO1 Deficiency Aggravates Renal Injury by Dysregulating Vps34/ATG14L Complex during Autophagy Initiation in Diabetic Nephropathy
Abstract
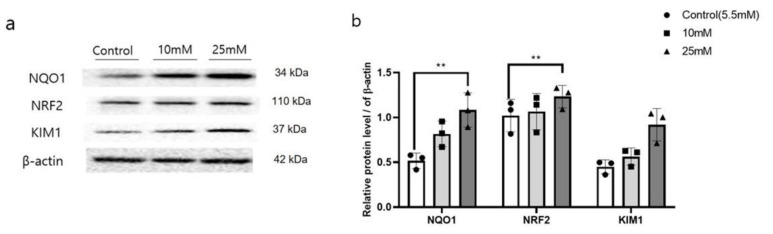
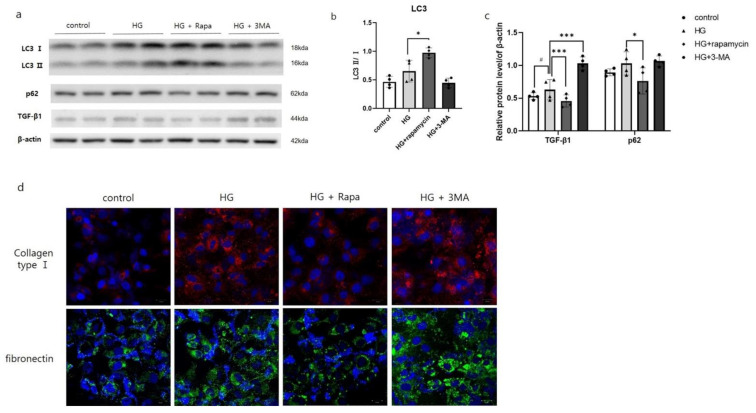
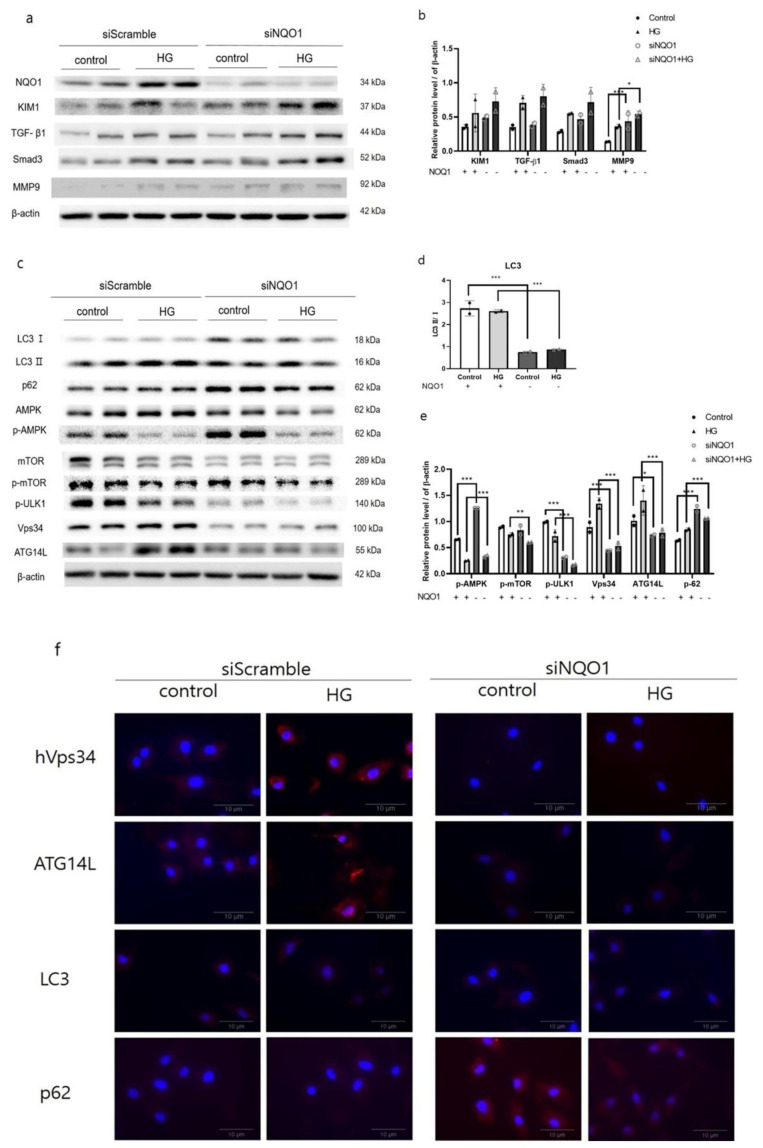
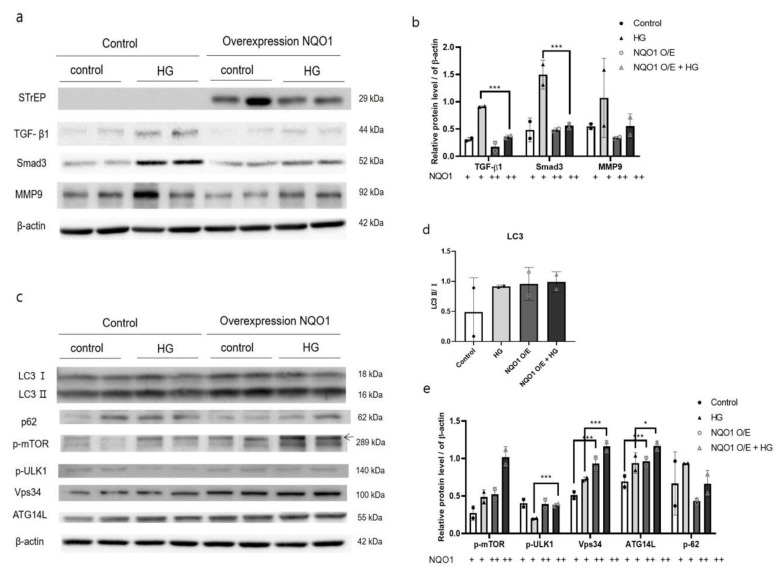
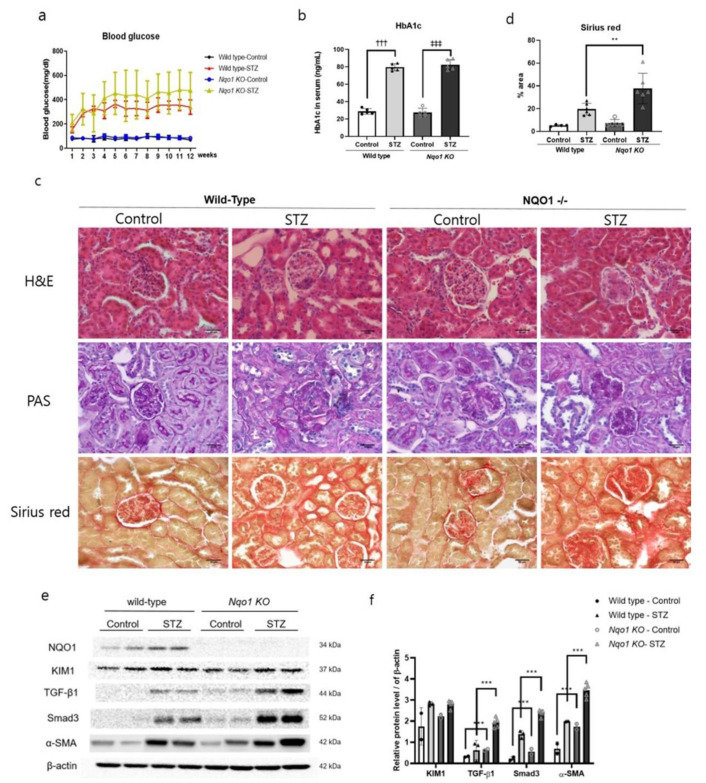
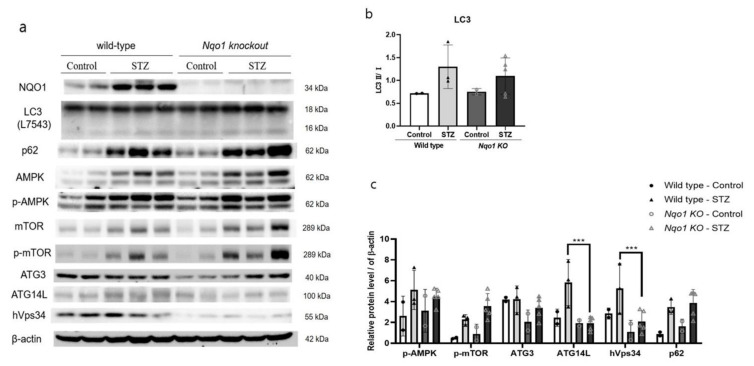
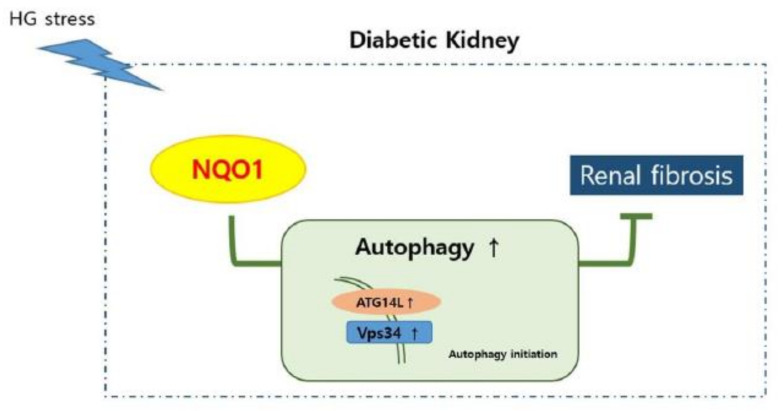
Diabetic nephropathy (DN) is one of the causes of end-stage renal failure, featuring renal fibrosis. However, autophagy, a vital process for intracellular homeostasis, can counteract renal fibrosis. Moreover, NAD(P)H: quinone dehydrogenase 1 (NQO1) modulates the ratios of reduced/oxidized nicotinamide nucleotides, exerting a cytoprotective function. Here, to examine the role of NQO1 genes in DN progression, the levels of autophagy-related proteins and pro-fibrotic markers were assessed in silencing or overexpression of NQO1 in human proximal tubular cells (HK2), and C57BL/6 (wild-type) and Nqo1 knockout (KO) mice injected to streptozotocin (50 mg/kg). NQO1 deficiency impaired the autophagy process by suppressing basal expression of ClassⅢ PI 3-kinase (Vps34) and autophagy-related (ATG)14L and inducing the expressions of transforming growth factor beta (TGF-β1), Smad3, and matrix metallopeptidase9 (MMP9) in high-glucose (HG) -treated HK2 cells. Meanwhile, NQO1 overexpression increased the expression of Vps34 and ATG14L, while, reducing TGF-β1, Smad3 and MMP9 expression. In vivo, the expression of Vps34 and ATG14L were suppressed in Nqo1 KO mice indicating aggravated glomerular changes and interstitial fibrosis. Therefore, NQO1 deficiency dysregulated autophagy initiation in HK2 cells, with consequent worsened renal cell damage under HG condition. Moreover, STZ-treated Nqo1 KO mice showed that NQO1 deficiency aggravated renal fibrosis by dysregulating autophagy.
Keywords: NQO1; autophagy; diabetic nephropathy; renal injury.
Conflict of interest statement
The authors declare no conflict of interest.
Figures
Similar articles
-
NQO1 Deficiency Leads Enhanced Autophagy in Cisplatin-Induced Acute Kidney Injury Through the AMPK/TSC2/mTOR Signaling Pathway.Antioxid Redox Signal. 2016 May 20;24(15):867-83. doi: 10.1089/ars.2015.6386. Epub 2016 Apr 8. Antioxid Redox Signal. 2016. PMID: 26935540
-
Tubular overexpression of Gremlin in transgenic mice aggravates renal damage in diabetic nephropathy.Am J Physiol Renal Physiol. 2015 Sep 15;309(6):F559-68. doi: 10.1152/ajprenal.00023.2015. Epub 2015 Jul 8. Am J Physiol Renal Physiol. 2015. PMID: 26155842
-
FSP1-specific SMAD2 knockout in renal tubular, endothelial, and interstitial cells reduces fibrosis and epithelial-to-mesenchymal transition in murine STZ-induced diabetic nephropathy.Cell Tissue Res. 2018 Apr;372(1):115-133. doi: 10.1007/s00441-017-2754-1. Epub 2017 Dec 6. Cell Tissue Res. 2018. PMID: 29209813
-
NLRP3 deficiency ameliorates renal inflammation and fibrosis in diabetic mice.Mol Cell Endocrinol. 2018 Dec 15;478:115-125. doi: 10.1016/j.mce.2018.08.002. Epub 2018 Aug 8. Mol Cell Endocrinol. 2018. PMID: 30098377
-
Astragalus mongholicus Bunge and Panax notoginseng (Burkill) F.H. Chen Formula for Renal Injury in Diabetic Nephropathy-In Vivo and In Vitro Evidence for Autophagy Regulation.Front Pharmacol. 2020 Jun 12;11:732. doi: 10.3389/fphar.2020.00732. eCollection 2020. Front Pharmacol. 2020. PMID: 32595492 Free PMC article.
Cited by
-
New insights into the interplay between autophagy and oxidative and endoplasmic reticulum stress in neuronal cell death and survival.Front Cell Dev Biol. 2022 Sep 16;10:994037. doi: 10.3389/fcell.2022.994037. eCollection 2022. Front Cell Dev Biol. 2022. PMID: 36187470 Free PMC article. Review.
-
Uncovering the Role of Anoikis-Related Genes in Modulating Immune Infiltration and Pathogenesis of Diabetic Kidney Disease.J Inflamm Res. 2024 Jul 24;17:4975-4991. doi: 10.2147/JIR.S446752. eCollection 2024. J Inflamm Res. 2024. PMID: 39070131 Free PMC article.
-
Optimizing diabetic kidney disease animal models: Insights from a meta-analytic approach.Animal Model Exp Med. 2023 Oct;6(5):433-451. doi: 10.1002/ame2.12350. Epub 2023 Sep 18. Animal Model Exp Med. 2023. PMID: 37723622 Free PMC article. Review.
-
Histopathologic Analysis of Human Kidney Spatial Transcriptomics Data: Toward Precision Pathology.Am J Pathol. 2025 Jan;195(1):69-88. doi: 10.1016/j.ajpath.2024.06.011. Epub 2024 Aug 2. Am J Pathol. 2025. PMID: 39097165
-
Activated Histone Acetyltransferase p300/CBP-Related Signalling Pathways Mediate Up-Regulation of NADPH Oxidase, Inflammation, and Fibrosis in Diabetic Kidney.Antioxidants (Basel). 2021 Aug 26;10(9):1356. doi: 10.3390/antiox10091356. Antioxidants (Basel). 2021. PMID: 34572988 Free PMC article.
References
-
- Fogo A.B., Kashgarian M. Diagnostic Atlas of Renal Pathology. 3rd ed. Elsevier BV; Philadelphia, PA, USA: 2017. p. xii 546.
LinkOut - more resources
Full Text Sources
Other Literature Sources
Research Materials
Miscellaneous
