Review
. 2021 Feb 23;11(2):58.
doi: 10.3390/bios11020058.

Fiber Optic Sensors for Vital Signs Monitoring. A Review of Its Practicality in the Health Field

Affiliations
Review

Fiber Optic Sensors for Vital Signs Monitoring. A Review of Its Practicality in the Health Field

Christian Perezcampos Mayoral et al. Biosensors (Basel). .

Abstract

Vital signs not only reflect essential functions of the human body but also symptoms of a more serious problem within the anatomy; they are well used for physical monitoring, caloric expenditure, and performance before a possible symptom of a massive failure-a great variety of possibilities that together form a first line of basic diagnosis and follow-up on the health and general condition of a person. This review includes a brief theory about fiber optic sensors' operation and summarizes many research works carried out with them in which their operation and effectiveness are promoted to register some vital sign(s) as a possibility for their use in the medical, health care, and life support fields. The review presents methods and techniques to improve sensitivity in monitoring vital signs, such as the use of doping agents or coatings for optical fiber (OF) that provide stability and resistance to the external factors from which they must be protected in in vivo situations. It has been observed that most of these sensors work with single-mode optical fibers (SMF) in a spectral range of 1550 nm, while only some work in the visible spectrum (Vis); the vast majority, operate through fiber Bragg gratings (FBG), long-period fiber gratings (LPFG), and interferometers. These sensors have brought great advances to the measurement of vital signs, especially with regard to respiratory rate; however, many express the possibility of monitoring other vital signs through mathematical calculations, algorithms, or auxiliary devices. Their advantages due to miniaturization, immunity to electromagnetic interference, and the absence of a power source makes them truly desirable for everyday use at all times.

Keywords: biosensor; blood pressure; body temperature; fiber optic sensor; heart rate; human body; respiratory rate; vital signs.


Conflict of interest statement

The authors declare no conflict of interest.

Figures

Figure 2
Figure 2
Schematic of a long-period fiber grating (LPFG) and the mode of propagation of light through the core, where gratings separated by defined periods perform the filtering function [25].
Figure 4
Figure 4
Sample of the operation of the Fabry–Pérot interferometer (FPI) [32].
Figure 5
Figure 5
Configuration of different optical fiber interferometers [37]. (a) The figure exemplifies the basic operation of a fiber Mach–Zehnder interferometer (MZI) type, from the exit of the beam of the light source to its analysis through the photodetectors. (b) The figure shows a sensor using a fiber Michelson interferometer, which if analyzed is very similar in configuration to MZI, save for the fewer rotatory devices and mirrors. (c) The figure shows the configuration of the fiber Sagnac interferometer, where the opposite ways that the beam takes from light are observed with clarity. (d) The figure shows a fiber FPI type and the way in which the light beam travels from the source to its return to photodetector.
Figure 1
Figure 1
Graphical mode of operation of a fiber Bragg grating (FBG) sensor [19]. In this type of sensor, the grating is inserted into the core of the optical fiber (OF), as shown in a signal where the wavelength filtering is done by such a sensor.
Figure 3
Figure 3
Schematic of a microbend fiber sensor bay mechanical induction [28]. The figure shows the mechanism of how the fiber undergoes microbending to create a sensor and microbending losses caused by disturbances in the optical fiber.
Figure 6
Figure 6
Configurations of FPI sensors [38]. The (adapted) figure shows the intrinsic and extrinsic configurations of FPI fiber sensors, where (a) represents a cavity formed by an internal mirror at the end of a fiber; (b) a cavity formed by two internal mirrors; and (c) a cavity formed by two FBGs. For each case, L represents the length of the optical cavity. Configuration (d) represents a cavity formed by a diaphragm at the end of a fiber; (e) a cavity formed by the surfaces of a cover in the end of the fiber; (f) a cavity formed in the end of a single-mode optical fiber (SMF) and an aligned multi-mode fiber (MMF) through a capillary; (g) a cavity formed by a SMF that the end is joined with a hollow core fiber. Additionally, the equal one in each case L represents the length of the optical cavity, which is an air bubble in the configurations (d), (f), and (g).
Figure 7
Figure 7
Different configurations from MZI fiber sensor (adapted) [39,40]. Here are different fiber MZI where we point out: (a) shows an interferometer created through a taper in the optical fiber, the same that is obtained by applying force in opposite directions when an unloading by electrical arc is made to modify the nano structure of optical fiber [41]; (b) shows joints of optical fiber but with a space displacement in the cores, which originates interference [42]; (c) shows joints of several types of optical fiber, where in the first, a fiber Bragg grating type created on a single mode fiber that is joined with an optical fiber with three cores that also hold a concealed knife with another single mode fiber segment [43]. The above are different techniques that are used to generate the sensors and, like the configurations of Fabry–Pérot, these are made to obtain greater sensitivity, specificity, stability, or exactitude in the sensor that one wants to create.
Figure 8
Figure 8
(adapted) [48] Human body areas for heart rate and blood pressure measurement. In (a) are the main areas where the cardiac pulse can be taken in the human body, since it is there where the main arteries are located and therefore the measurements are easier and more accurate; (b) shows the most accessible places for sampling blood pressure; it is observed that almost the same arteries are used for blood pressure and cardiac pulse, so that some sensors are able to perform both samples through the same signal [49].
Figure 9
Figure 9
Main ranges for blood pressure [50]. The figure shows the ranges of blood pressure in adults, ranging from low, ideal, acceptable high, and severe high, both systolic and diastolic pressure.
Figure 10
Figure 10
(Adapted) Schematic design of the sensor proposed by Agostino Iadicicco. A view of the hollow core fiber is displayed with an LPFG and in turn spliced with conventional SMF and their respective fiber optic / physical contact (FC/PC) connectors [56]. The use of multiple splices together with different fiber types is common to obtain higher sensitivity or sensors capable of high-precision filtering; however, the right materials and tools are needed to achieve so much precision in the OF nanostructure.
Figure 11
Figure 11
(Adaptation) Example of sensor non-core fiber – long period grating (SNS-LPG) experimental arrangement proposed by Agostino Iadicicco. This is the experimental arrangement they propose for splicing two SMF parts with a non-core fiber (NCF) in the middle and there create a LPBG, resulting in the SNS-LPG arrangement [56]. This is another work that hints at the accuracy of the equipment to characterize OF nanostructure; no doubt these are innovative ideas, but outside of a laboratory for our purposes they are not feasible—they are rather sensors for research.
Figure 12
Figure 12
C. Massaroni guide and sensor protection scheme. This is an example of the hypodermic needle. In the ventilation process of mechanical invasion, the hypodermic needle is used to measure respiration, temperature, and humidity. In addition, with a really simple and innovative design, the hypodermic needle is used to protect the OF [72].
Figure 13
Figure 13
OF textile material representation by Kony Chatterjee. Here you can see the great work of twisting the optical fiber and weaving it to a textile, all for transport and protection, as it provides an ingenious way to move it and place it in a textile garment to be in constant contact with the sample patient. This is a clear example of how you could make different textile garments depending on what you want to monitor and the part of the human body from which you want to sample data [85].
Figure 14
Figure 14
(Adapted) Design of the twin core fiber and its operation. In (a) you can also observe the operating wavelength of the SMF once it is characterized as a twin core, where it is also doped with sprayed gold to increase sensitivity and in (b) the schematic design and representation of the characterized fiber—a great job with a lot of creativity to create single mode fiber—two core fiber—single mode fiber (SMF-TCF-SMF) array [88].
Figure 15
Figure 15
(Adapted) An example of smart textile sensors [94,95,96]. A representation of some very novel sensor designs is shown, based on a study to determine the location and configuration of the FBGs in the textile in order to measure the multiple details of breathing and its involved movements. It is intended to show the research that there is for the development of this type of garments that help constant monitoring of vital signs or physical activity.
Figure 16
Figure 16
An example of the Pant Shweta prototype, a breathing measurement device. Another design to highlight where, through a very simple prototype, it is possible to measure breathing through a sensor with a FBG for its task. The prototype is most ingenious as it is a nasal bridge that measures the respiratory flow and can measure the respiratory rate from the volume without problems—a totally different and novel proposal. [92].
Figure 17
Figure 17
Based on the signals representing the waveforms of the filtered hard data as an example of Bonefacio Julien. It can be seen how the output signal and its respective wavelength appear in black with noise during the analysis performed by the FBG sensor, while the signals in red and blue, BR and HR, respectively, having already been filtered, can be seen in a clearer way due to the elimination of noise—a simple sign that from the same signal can be obtained different data out of phase in time and the feasibility of being able to obtain not only a vital signal to monitor. Here, the complexity lies more in monitoring both in real time [106].
Figure 18
Figure 18
Example of the cardiac pulse flow during monitoring. It shows how the cardiac pulse signal is obtained. At first, background noise is observed in the output signal, as well as thermal and electromagnetic interference, so they proceed to filter the signal and take samples of the pulses to smooth the signal and finally take more samples to process the signal [107].
Figure 19
Figure 19
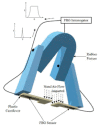
Wang’s figure of an example of a fiber sensor showing its structure, composition, and operation. The model of an OF sensor is shown from its components and how each of them are structured. The whole design for its operation is presented and how the characterized fiber works—together with all its components and operation functions as a wrist blood pressure sensor. A bold design of how vibrations originated by a membrane can be used to obtain readings in the wave [105]. (A), Schematicdiagram of optical fiber pulsesensor; (B), Structural design ofwearable pulse sensor; (C), Thetransmission of pulse waves signals.

Similar articles

Cited by

References

    1. Pinet É. Medical Applications: Saving Lives. Nat. Photonics. 2008;2:150–153. doi: 10.1038/nphoton.2008.19. - DOI
    1. Güemes J.A., Sierra-Pérez J. Fiber Optics Sensors. In: Ostachowicz W., Güemes J.A., editors. New Trends in Structural Health Monitoring. Volume 542. Springer; Vienna, Austria: 2013. pp. 265–316. CISM International Centre for Mechanical Sciences.
    1. Roriz P., Carvalho L., Frazão O., Santos J.L., Simões J.A. From Conventional Sensors to Fibre Optic Sensors for Strain and Force Measurements in Biomechanics Applications: A Review. J. Biomech. 2014;47:1251–1261. doi: 10.1016/j.jbiomech.2014.01.054. - DOI - PubMed
    1. Kanellos G.T., Papaioannou G., Tsiokos D., Mitrogiannis C., Nianios G., Pleros N. Two Dimensional Polymer-Embedded Quasi-Distributed FBG Pressure Sensor for Biomedical Applications. Opt. Express. 2010;18:179–186. doi: 10.1364/OE.18.000179. - DOI - PubMed
    1. Poeggel S., Tosi D., Duraibabu D., Leen G., McGrath D., Lewis E. Optical Fibre Pressure Sensors in Medical Applications. Sensors. 2015;15:17115–17148. doi: 10.3390/s150717115. - DOI - PMC - PubMed