. 2021 Feb 23;22(4):2219.
doi: 10.3390/ijms22042219.

Runx3 Induces a Cell Shape Change and Suppresses Migration and Metastasis of Melanoma Cells by Altering a Transcriptional Profile

Affiliations

Runx3 Induces a Cell Shape Change and Suppresses Migration and Metastasis of Melanoma Cells by Altering a Transcriptional Profile

Ning Wang et al. Int J Mol Sci. .

Abstract

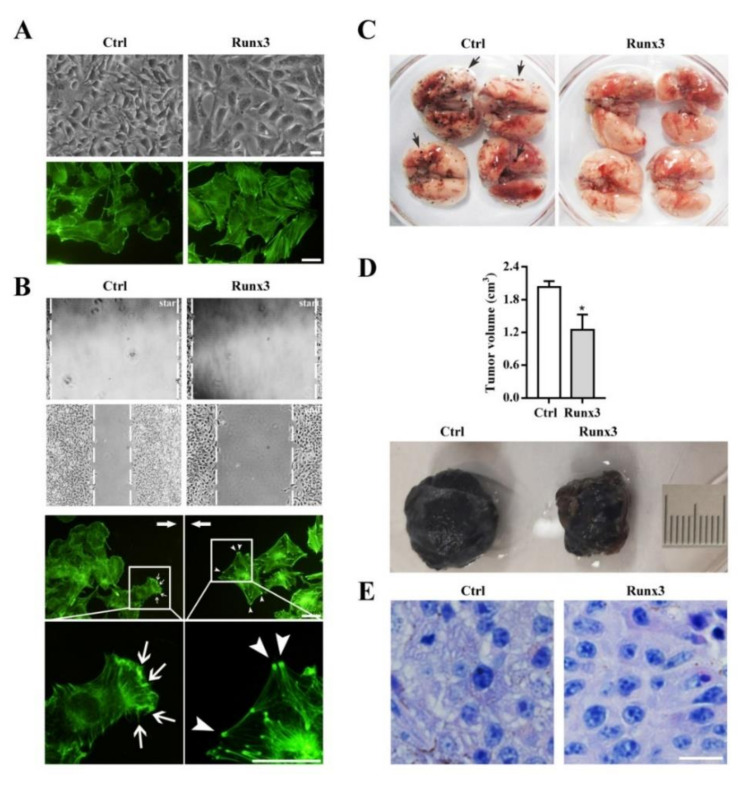
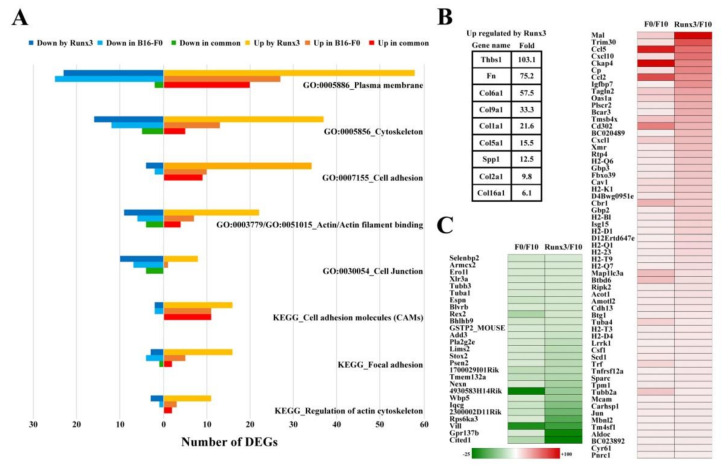
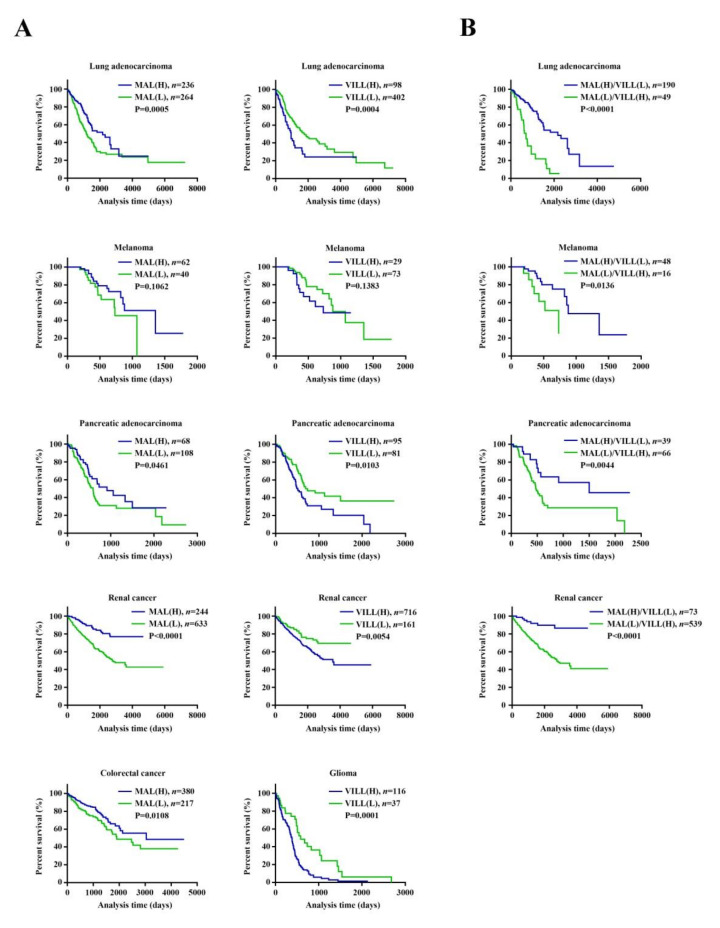
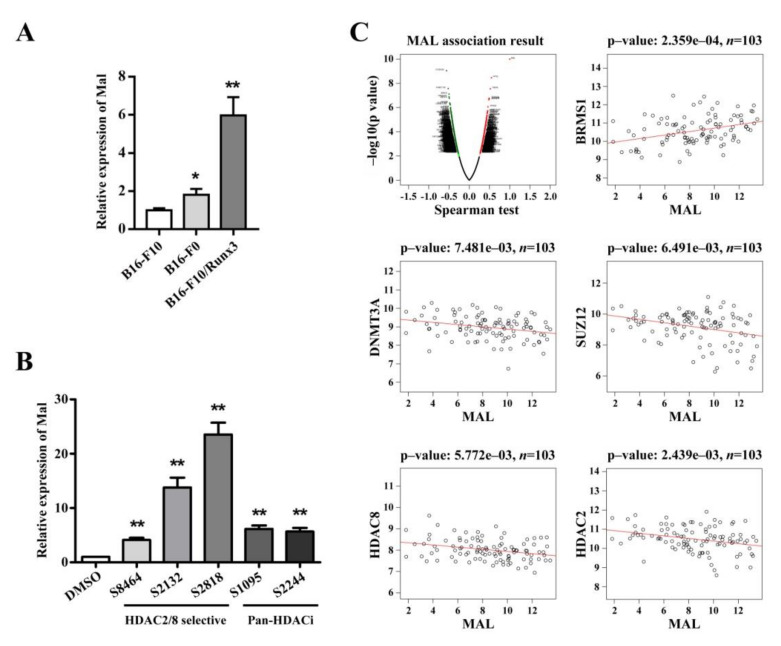
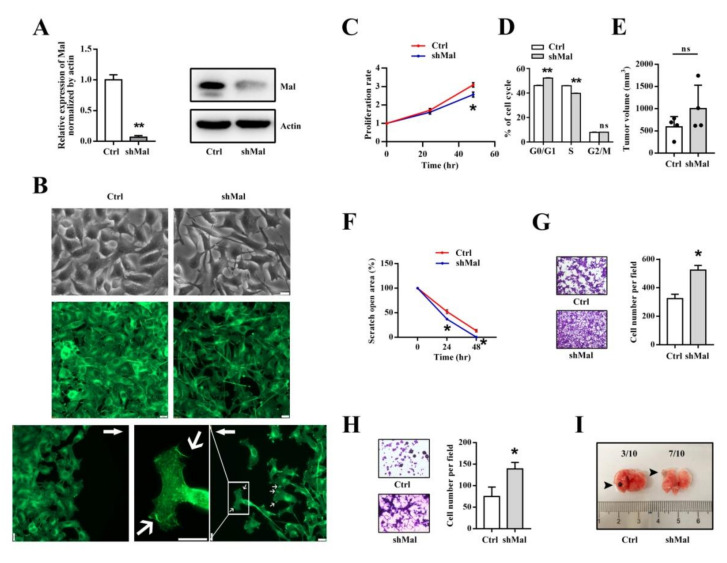
Runt-related transcription factor-3 (Runx3) is a tumor suppressor, and its contribution to melanoma progression remains unclear. We previously demonstrated that Runx3 re-expression in B16-F10 melanoma cells changed their shape and attenuated their migration. In this study, we found that Runx3 re-expression in B16-F10 cells also suppressed their pulmonary metastasis. We performed microarray analysis and uncovered an altered transcriptional profile underlying the cell shape change and the suppression of migration and metastasis. This altered transcriptional profile was rich in Gene Ontology/Kyoto Encyclopedia of Genes and Genomes (GO/KEGG) annotations relevant to adhesion and the actin cytoskeleton and included differentially expressed genes for some major extracellular matrix (ECM) proteins as well as genes that were inversely associated with the increase in the metastatic potential of B16-F10 cells compared to B16-F0 melanoma cells. Further, we found that this altered transcriptional profile could have prognostic value, as evidenced by myelin and lymphocyte protein (MAL) and vilin-like (VILL). Finally, Mal gene expression was correlated with metastatic potential among the cells and was targeted by histone deacetylase (HDAC) inhibitors in B16-F10 cells, and the knockdown of Mal gene expression in B16-F0 cells changed their shape and enhanced the migratory and invasive traits of their metastasis. Our study suggests that self-entrapping of metastatic Runx3-negative melanoma cells via adhesion and the actin cytoskeleton could be a powerful therapeutic strategy.

Keywords: Mal; Runx3; actin cytoskeleton; adhesion; extracellular matrix; melanoma; metastasis; transcriptional profile.


Conflict of interest statement

The authors declare no conflict of interest.

Figures

Figure 1
Figure 1
Runt-related transcription factor-3 (Runx3) re-expression in B16-F10 melanoma cells resulted in a cell shape change and suppressed the pulmonary metastasis of the cells. (A) Runx3 changed the cell shape and altered the actin cytoskeleton. The green fluorescent signals indicate actin filaments. (B) Runx3 delayed cell migration, and altered the dynamics of stress fiber formation in the migrating cells. Start denotes when the wound is just made, and end denotes when wound healing is terminated. The green fluorescent signals indicate actin filaments. The arrows indicate the directions of migration fronts. The arrowheads indicate the ends of stress fibers. The thin arrows indicate microspike-like structures. (C) Runx3 completely suppressed pulmonary metastasis. n = 4. The black dots on the surface of the lungs indicate metastasis foci. The windows-arrows representatively indicate metastasis foci. (D) Runx3 slightly reduced the tumor formation rate. The averaged tumor volumes are compared to each other (mean ± SEM, n = 3). * p < 0.05 is generated by the t-test. A representative image is shown. Bar: 1 cm. (E) Runx3 changed the cell shape in vivo. A representative section is shown. Ctrl: mock control B16-F10 cells; Runx3: B16-F10/Runx3 cells. All bars: 22 μm.
Figure 2
Figure 2
Microarray analysis uncovered an altered and specific transcriptional profile underlying the cell shape change and the suppression of the metastatic potential by Runx3. (A) Gene Ontology (GO) and Kyoto Encyclopedia of Genes and Genomes (KEGG) annotations assigned different repertoires of differentially expressed genes (DEGs) that were regulated by Runx3 in B16-F10 cells and, in the case of B16-F0 cells vs. B16-F10 cells, to the terms relevant to the actin cytoskeleton and adhesion. Each GO/KEGG annotation term is inscribed as a caption. The number of DEGs within a repertoire is described at x axis. The columns for the downregulated and the upregulated DEGs are shown in different colors as explained at the top of the figure., Down/Up by Runx3 indicates the appearance of DEGs in the case of B16-F10/Runx3 cells vs. mock control B16-F10 cells. Down/Up in B16-F0 indicates the appearance of DEGs in the case of B16-F0 cells vs. B16-F10 cells. Down/Up in common indicates the appearance of same DEGs in both cases. (B) Runx3 upregulated the expression of extracellular matrix (ECM) genes. The summary table indicates the gene names and their corresponding fold changes. (C) Runx3 regulated the expression of a list of DEGs that were inversely associated with an increase in the metastatic potential of B16-F10 cells compared to B16-F0 cells. The heatmap shows the gene names and their fold changes in the cases of B16-F10/Runx3 cells vs. mock control B16-F10 cells and B16-F0 cells vs. B16-F10 cells, respectively.
Figure 3
Figure 3
The gene expression of myelin and lymphocyte protein (MAL) and/or vilin-like (VILL) had prognostic value for various cancers. (A) Kaplan–Meier survival analysis implicated MAL or VILL in various cancers. (B) Kaplan–Meier survival analysis implicated both MAL and VILL in various cancers. The information about cancer type, patient number, and p-value is inscribed at each panel. The gene level was defined as fragments per kilobase of exon per million reads (FPKM). The median cutoff was used to group patients into low (L) and high (H) expression of MAL and/or VILL. The p-values are generated by the log-rank test.
Figure 4
Figure 4
Mal gene expression was correlated with metastatic potential among the cell lines and was subject to epigenetic regulation. (A) Mal gene expression was validated in the cells used in this study with qRT-PCR. The relative Mal gene expression levels were compared among the indicated cell lines (means ± SEM, n = 3). (B) Treatment with histone deacetylase (HDAC) inhibitors induced the gene expression of Mal in B16-F10 cells. The relative Mal gene expression levels of inhibitor-treated cells were compared to those of untreated (DMSO) cells (means ± SEM, n = 3). (C) The gene expression of MAL was correlated with that of other genes in human melanoma. The top left panel indicates the overall MAL correlation. The other panels indicate the correlation between MAL and the other genes. The information about patient number and p-value is inscribed at each panel. The gene level at x/y axis is defined from FPKM. The p-values are generated by the Spearman correlation test. * p < 0.05 and ** p < 0.01 are generated by the t-test.
Figure 5
Figure 5
Mal was necessary for suppressing the migratory and invasive traits of metastatic melanoma cells. (A) The knockdown of Mal gene expression was validated with qRT-PCR and Western blotting. The relative Mal gene expression levels are compared to each other (means ± SEM, n = 3). Mal’s molecular weight: 18 kDa; actin’s molecular weight: 43 kDa. (B) The knockdown of Mal gene expression changed the cell shape and altered the actin cytoskeleton of steady or migrating cells. The green fluorescent signals indicate actin filaments. The arrows indicate the directions of migration fronts. The thin arrows indicate microspike-like structures. Bars: 22 μm. (C) The knockdown of Mal gene expression slightly reduced the proliferation rate. The relative proliferation rates were determined by 3-(4,5-dimethyl-2-thiazolyl)-2,5-diphenyl-2-H-tetrazolium bromide (MTT) and were compared to each other (means ± SEM, n = 3). (D) The knockdown of Mal gene expression slightly delayed the progress of the cell cycle. The percentages of cells at various phases (G0/G1, S, and G2/M) were determined by flow cytometry (means ± SEM, n = 3, ns: not significant). (E) The knockdown of Mal gene expression had no effect on the tumor formation rate. The averaged tumor volumes were compared to each other (means ± SEM, n = 4, ns: not significant). (F) The knockdown of Mal gene expression increased the migration rate in wound healing. The relative scratch open areas were compared to each other (means ± SEM, n = 3). (G) The knockdown of Mal gene expression increased the migration rate through the Transwell chambers. A representative image is shown on the left of the panel, and the averaged cell numbers were compared to each other, as shown on the right (means ± SEM, n = 6). (H) The knockdown of Mal gene expression increased the invasion rate through Matrigel-coated Transwell chambers. A representative image is shown on the left of the panel, and the averaged cell numbers were compared to each other, as shown on the right (means ± SEM, n = 6). (I) The knockdown of Mal gene expression increased the frequency of metastasis-focus-positive lungs. A representative image is shown. The arrowheads indicate metastasis foci. The frequencies are inscribed at the top of the image. Ctrl: mock control; shMal: short hairpin RNA interference of Mal. * p < 0.05 and ** p < 0.01 are generated by the t-test.

Similar articles

Cited by

References

    1. Stoletov K., Beatty P.H., Lewis J.D. Novel therapeutic targets for cancer metastasis. Expert Rev. Anticancer. 2020;20:97–109. doi: 10.1080/14737140.2020.1718496. - DOI - PubMed
    1. The ICGC/TCGA Pan-Cancer Analysis of Whole Genomes Consortium Pan-cancer analysis of whole genomes. Nature. 2020;578:82–93. doi: 10.1038/s41586-020-1969-6. - DOI - PMC - PubMed
    1. Valastyan S., Weinberg R.A. Tumor metastasis: Molecular insights and evolving paradigms. Cell. 2011;147:275–292. doi: 10.1016/j.cell.2011.09.024. - DOI - PMC - PubMed
    1. Fidler I.J., Kripke M.L. The challenge of targeting metastasis. Cancer Metastasis Rev. 2015;34:635–641. doi: 10.1007/s10555-015-9586-9. - DOI - PMC - PubMed
    1. Lambert A.W., Pattabiraman D.R., Weinberg R.A. Emerging Biological Principles of Metastasis. Cell. 2017;168:670–691. doi: 10.1016/j.cell.2016.11.037. - DOI - PMC - PubMed

MeSH terms

Substances

LinkOut - more resources