

Meta-Analysis of Gene Popularity: Less Than Half of Gene Citations Stem from Gene Regulatory Networks
- PMID: 33672419
- PMCID: PMC7926953
- DOI: 10.3390/genes12020319
Meta-Analysis of Gene Popularity: Less Than Half of Gene Citations Stem from Gene Regulatory Networks
Abstract
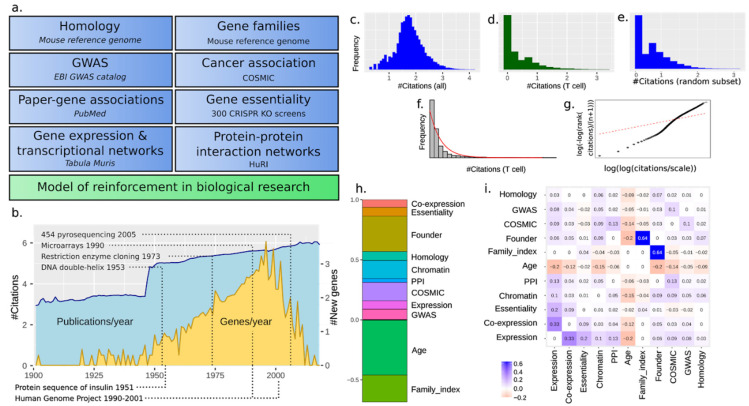
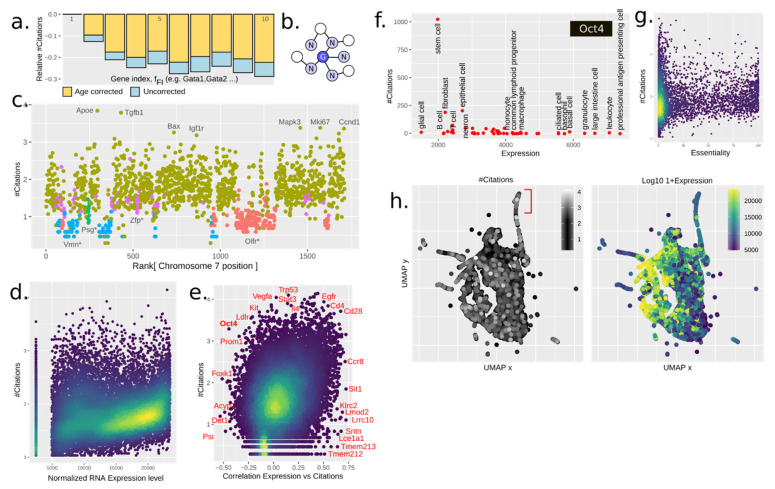
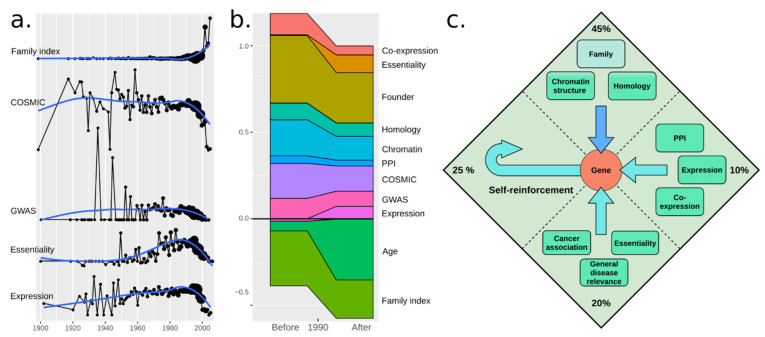
The reasons for selecting a gene for further study might vary from historical momentum to funding availability, thus leading to unequal attention distribution among all genes. However, certain biological features tend to be overlooked in evaluating a gene's popularity. Here we present a meta-analysis of the reasons why different genes have been studied and to what extent, with a focus on the gene-specific biological features. From unbiased datasets we can define biological properties of genes that reasonably may affect their perceived importance. We make use of both linear and nonlinear computational approaches for estimating gene popularity to then compare their relative importance. We find that roughly 25% of the studies are the result of a historical positive feedback, which we may think of as social reinforcement. Of the remaining features, gene family membership is the most indicative followed by disease relevance and finally regulatory pathway association. Disease relevance has been an important driver until the 1990s, after which the focus shifted to exploring every single gene. We also present a resource that allows one to study the impact of reinforcement, which may guide our research toward genes that have not yet received proportional attention.
Keywords: Matthew effect; biological feature; gene; gene regulatory networks; genomics; linear model; machine learning.
Conflict of interest statement
The authors declare no conflict of interest.
Figures
Similar articles
-
Gene Regulatory Network Inferences Using a Maximum-Relevance and Maximum-Significance Strategy.PLoS One. 2016 Nov 9;11(11):e0166115. doi: 10.1371/journal.pone.0166115. eCollection 2016. PLoS One. 2016. PMID: 27829000 Free PMC article.
-
Computational inference of gene regulatory networks: Approaches, limitations and opportunities.Biochim Biophys Acta Gene Regul Mech. 2017 Jan;1860(1):41-52. doi: 10.1016/j.bbagrm.2016.09.003. Epub 2016 Sep 16. Biochim Biophys Acta Gene Regul Mech. 2017. PMID: 27641093 Review.
-
Using the NeAT toolbox to compare networks to networks, clusters to clusters, and network to clusters.Methods Mol Biol. 2012;804:327-42. doi: 10.1007/978-1-61779-361-5_18. Methods Mol Biol. 2012. PMID: 22144162
-
Evaluating methods of inferring gene regulatory networks highlights their lack of performance for single cell gene expression data.BMC Bioinformatics. 2018 Jun 19;19(1):232. doi: 10.1186/s12859-018-2217-z. BMC Bioinformatics. 2018. PMID: 29914350 Free PMC article.
-
Perturbations to uncover gene networks.Trends Genet. 2007 Jan;23(1):34-41. doi: 10.1016/j.tig.2006.11.003. Epub 2006 Nov 13. Trends Genet. 2007. PMID: 17098324 Review.
Cited by
-
Exploratory meta-analysis of hypoxic transcriptomes using a precise transcript reference sequence set.Life Sci Alliance. 2022 Oct 10;6(1):e202201518. doi: 10.26508/lsa.202201518. Print 2023 Jan. Life Sci Alliance. 2022. PMID: 36216516 Free PMC article.
-
The characteristics of early-stage research into human genes are substantially different from subsequent research.PLoS Biol. 2022 Jan 6;20(1):e3001520. doi: 10.1371/journal.pbio.3001520. eCollection 2022 Jan. PLoS Biol. 2022. PMID: 34990452 Free PMC article.
References
-
- Mingers J., Leydesdorff L. A review of theory and practice in scientometrics. Eur. J. Oper. Res. 2015;246:1–19. doi: 10.1016/j.ejor.2015.04.002. - DOI
-
- Bailón-Moreno R., Jurado-Alameda E., Ruiz-Baños R., Courtial J.P. Bibliometric laws: Empirical flaws of fit. Scientometrics. 2005;63:209–229. doi: 10.1007/s11192-005-0211-5. - DOI
-
- Venables W.N., Ripley B.D. Modern Applied Statistics with S. Statistics and Computing. 4th ed. Springer; Berlin, Germany: 2002.
Publication types
MeSH terms
LinkOut - more resources
Full Text Sources
Other Literature Sources
