. 2021 Feb 20;11(2):150.
doi: 10.3390/jpm11020150.

The 1β-Hydroxy-Deoxycholic Acid to Deoxycholic Acid Urinary Metabolic Ratio: Toward a Phenotyping of CYP3A Using an Endogenous Marker?

Affiliations

The 1β-Hydroxy-Deoxycholic Acid to Deoxycholic Acid Urinary Metabolic Ratio: Toward a Phenotyping of CYP3A Using an Endogenous Marker?

Gaëlle Magliocco et al. J Pers Med. .

Abstract

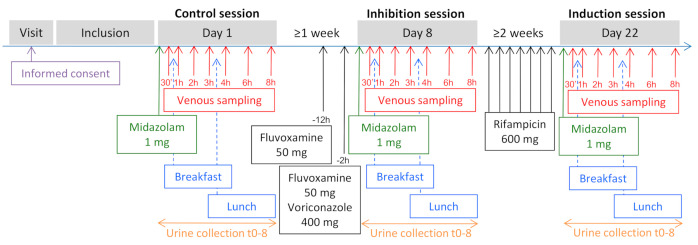
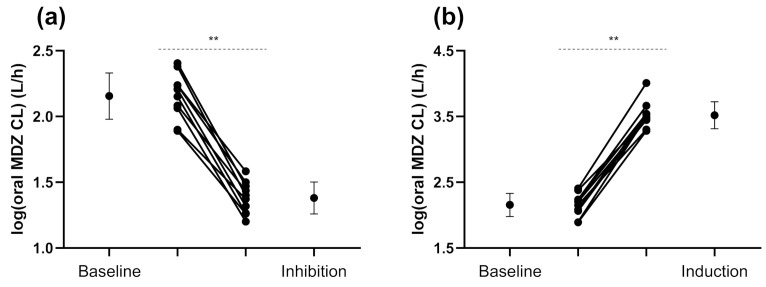
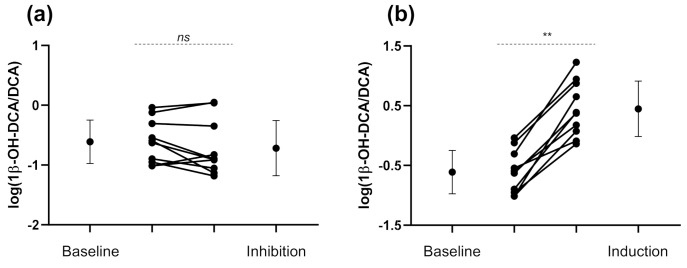
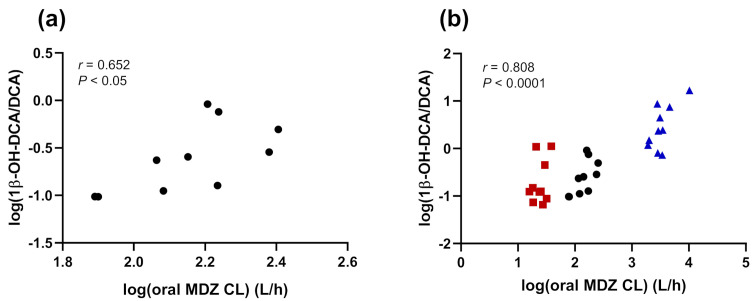
In this study, we assessed the potential use of the 1β-hydroxy-deoxycholic acid (1β-OH-DCA) to deoxycholic acid (DCA) urinary metabolic ratio (UMR) as a CYP3A metric in ten male healthy volunteers. Midazolam (MDZ) 1 mg was administered orally at three sessions: alone (control session), after pre-treatment with fluvoxamine 50 mg (12 h and 2 h prior to MDZ administration), and voriconazole 400 mg (2 h before MDZ administration) (inhibition session), and after a 7-day pre-treatment with the inducer rifampicin 600 mg (induction session). The 1β-OH-DCA/DCA UMR was measured at each session, and correlations with MDZ metrics were established. At baseline, the 1β-OH-DCA/DCA UMR correlated significantly with oral MDZ clearance (r = 0.652, p = 0.041) and Cmax (r = -0.652, p = 0.041). In addition, the modulation of CYP3A was reflected in the 1β-OH-DCA/DCA UMR after the intake of rifampicin (induction ratio = 11.4, p < 0.01). During the inhibition session, a non-significant 22% decrease in 1β-OH-DCA/DCA was observed (p = 0.275). This result could be explained by the short duration of CYP3A inhibitors intake fixed in our clinical trial. Additional studies, particularly involving CYP3A inhibition for a longer period and larger sample sizes, are needed to confirm the 1β-OH-DCA/DCA metric as a suitable CYP3A biomarker.

Keywords: CYP3A; CYP450; bile acid; biomarker; phenotyping.


Conflict of interest statement

The authors declare no conflict of interest.

Figures

Figure 1
Figure 1
Study timeline. Midazolam 1 mg, as part of the Geneva cocktail, was orally administered on days 1, 8, and 22. Fluvoxamine 50 mg was administered 12 h and 2 h before the administration of midazolam (inhibition session). Voriconazole 400 mg was administered 2 h before the administration of midazolam (inhibition session). Rifampicin 600 mg was administered once daily for seven days until the evening before the administration of midazolam (induction session).
Figure 2
Figure 2
Oral midazolam clearance in ten mal volunteers who received 1 mg midazolam orally at baseline and after (a) inhibition by voriconazole and fluvoxamine, and (b) induction by rifampicin. Error bars represent the standard deviations of log-transformed oral midazolam clearance and mean values are displayed with a circle. CL, clearance; MDZ, midazolam. ** p < 0.01
Figure 3
Figure 3
Eight-hour 1β-hydroxy-deoxycholic acid/deoxycholic acid individual urinary metabolic ratios at baseline and after (a) the inhibition by voriconazole and fluvoxamine, and (b) induction by rifampicin. Error bars represent the standard deviations of log-transformed 1β-hydroxy-deoxycholic acid (1β-OH-DCA/DCA) and mean values are displayed with a circle. 1β-OH-DCA/DCA, 1β-hydroxy-deoxycholic acid/deoxycholic acid. ** p < 0.01
Figure 4
Figure 4
Correlation between log-transformed 1β-hydroxy-deoxycholic acid/deoxycholic acid urinary metabolic ratio and oral midazolam clearance after (a) the administration of midazolam alone and after (b) the administration of midazolam alone and after pretreatment with voriconazole/fluvoxamine or rifampicin. Black circles, baseline; CYP3A4-inhibited phase, red square; CYP3A4-induced phase, blue triangles. 1β-OH-DCA/DCA, 1β-hydroxy-deoxycholic acid/deoxycholic acid; CL, clearance; MDZ, midazolam.

References

    1. Zanger U.M., Schwab M. Cytochrome P450 Enzymes in Drug Metabolism: Regulation of Gene Expression, Enzyme Activities, and Impact of Genetic Variation. Pharmacol. Ther. 2013;138:103–141. doi: 10.1016/j.pharmthera.2012.12.007. - DOI - PubMed
    1. Tracy T.S., Chaudhry A.S., Prasad B., Thummel K.E., Schuetz E.G., Zhong X., Tien Y.-C., Jeong H., Pan X., Shireman L.M., et al. Interindividual Variability in Cytochrome P450–Mediated Drug Metabolism. Drug Metab. Dispos. 2016;44:343–351. doi: 10.1124/dmd.115.067900. - DOI - PMC - PubMed
    1. Wang D., Sadee W. The Making of a CYP3A Biomarker Panel for Guiding Drug Therapy. J. Pers. Med. 2012;2:175–191. doi: 10.3390/jpm2040175. - DOI - PMC - PubMed
    1. Yang L., Price E.T., Chang C.-W., Li Y., Huang Y., Guo L.-W., Guo Y., Kaput J., Shi L., Ning B. Gene Expression Variability in Human Hepatic Drug Metabolizing Enzymes and Transporters. PLoS ONE. 2013;8:e60368. doi: 10.1371/journal.pone.0060368. - DOI - PMC - PubMed
    1. Samer C.F., Lorenzini K.I., Rollason V., Daali Y., Desmeules J.A. Applications of CYP450 Testing in the Clinical Setting. Mol. Diagn. Ther. 2013;17:165–184. doi: 10.1007/s40291-013-0028-5. - DOI - PMC - PubMed

LinkOut - more resources