

Assessment of Outliers and Detection of Artifactual Network Segments Using Univariate and Multivariate Dispersion Entropy on Physiological Signals
- PMID: 33672557
- PMCID: PMC7923758
- DOI: 10.3390/e23020244
Assessment of Outliers and Detection of Artifactual Network Segments Using Univariate and Multivariate Dispersion Entropy on Physiological Signals
Abstract
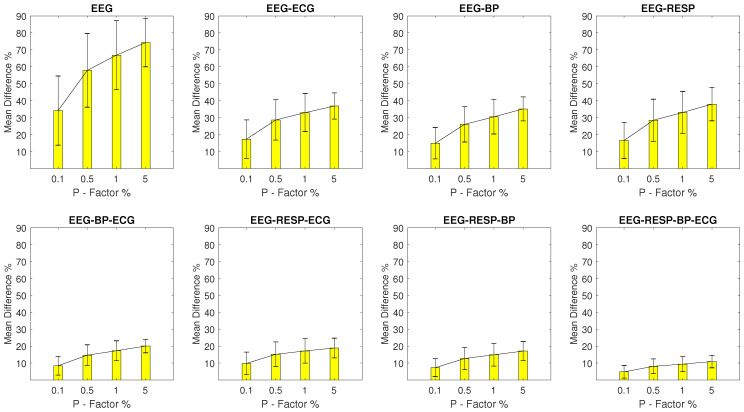
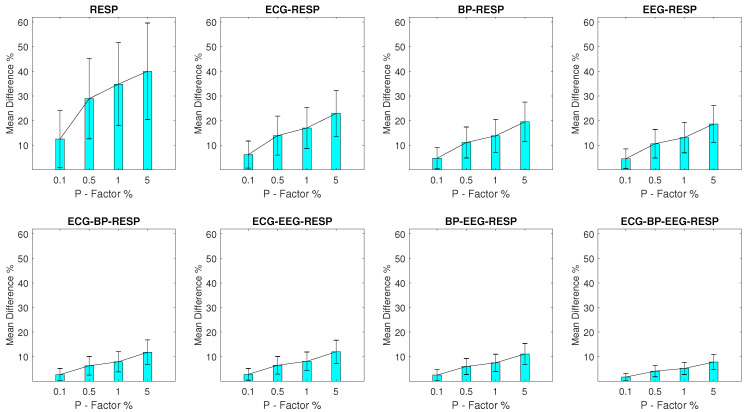
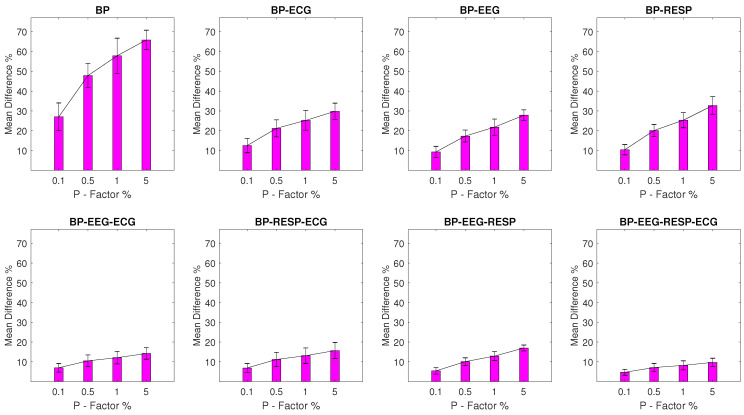
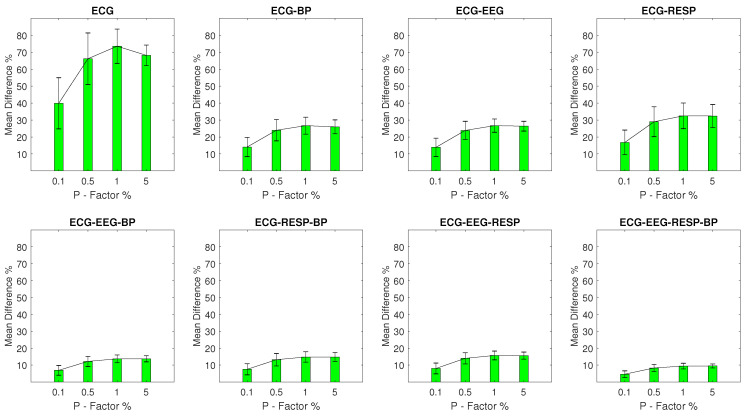
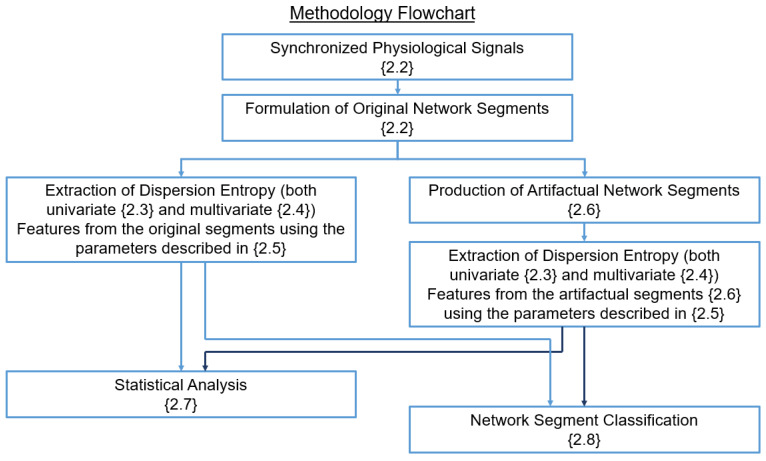
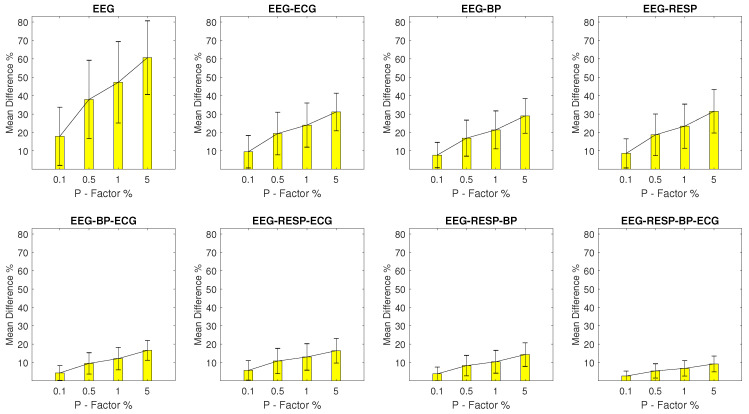
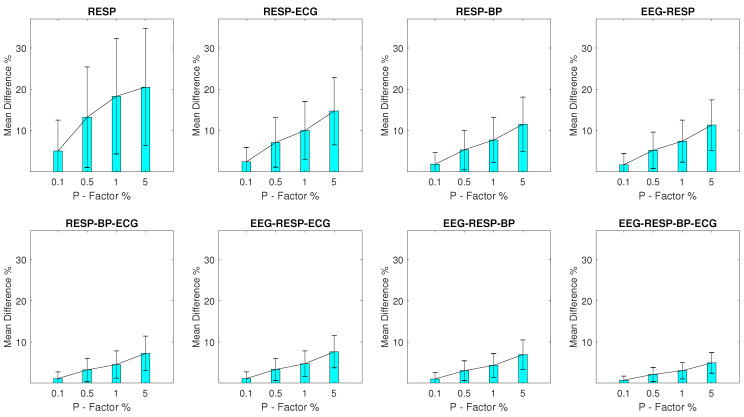
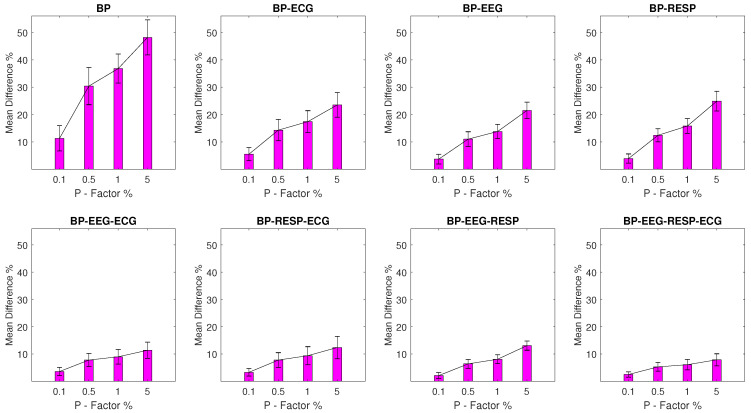
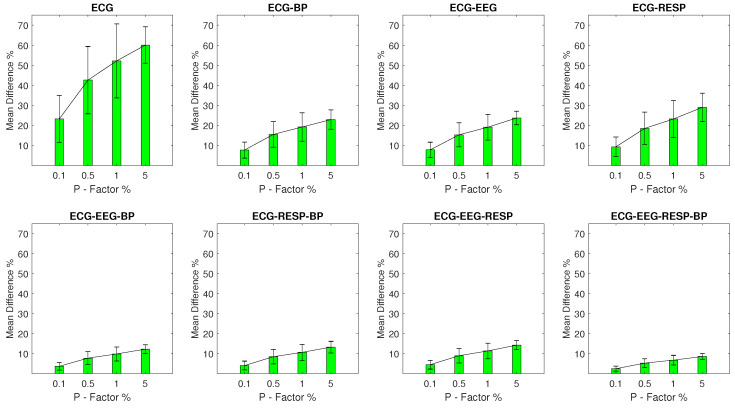
Network physiology has emerged as a promising paradigm for the extraction of clinically relevant information from physiological signals by moving from univariate to multivariate analysis, allowing for the inspection of interdependencies between organ systems. However, for its successful implementation, the disruptive effects of artifactual outliers, which are a common occurrence in physiological recordings, have to be studied, quantified, and addressed. Within the scope of this study, we utilize Dispersion Entropy (DisEn) to initially quantify the capacity of outlier samples to disrupt the values of univariate and multivariate features extracted with DisEn from physiological network segments consisting of synchronised, electroencephalogram, nasal respiratory, blood pressure, and electrocardiogram signals. The DisEn algorithm is selected due to its efficient computation and good performance in the detection of changes in signals for both univariate and multivariate time-series. The extracted features are then utilised for the training and testing of a logistic regression classifier in univariate and multivariate configurations in an effort to partially automate the detection of artifactual network segments. Our results indicate that outlier samples cause significant disruption in the values of extracted features with multivariate features displaying a certain level of robustness based on the number of signals formulating the network segments from which they are extracted. Furthermore, the deployed classifiers achieve noteworthy performance, where the percentage of correct network segment classification surpasses 95% in a number of experimental setups, with the effectiveness of each configuration being affected by the signal in which outliers are located. Finally, due to the increase in the number of features extracted within the framework of network physiology and the observed impact of artifactual samples in the accuracy of their values, the implementation of algorithmic steps capable of effective feature selection is highlighted as an important area for future research.
Keywords: data quality; dispersion entropy; multivariate analysis; network physiology; outlier samples.
Conflict of interest statement
The authors declare that there is no conflict of interest. The funders had no role in the design of the study; in the collection, analyses, or interpretation of data; in the writing of the manuscript; or in the decision to publish the results.
Figures
Similar articles
-
Augmentation of Dispersion Entropy for Handling Missing and Outlier Samples in Physiological Signal Monitoring.Entropy (Basel). 2020 Mar 11;22(3):319. doi: 10.3390/e22030319. Entropy (Basel). 2020. PMID: 33286093 Free PMC article.
-
Attention Deficit Hyperactivity Disorder Diagnosis using non-linear univariate and multivariate EEG measurements: a preliminary study.Phys Eng Sci Med. 2020 Jun;43(2):577-592. doi: 10.1007/s13246-020-00858-3. Epub 2020 Mar 27. Phys Eng Sci Med. 2020. PMID: 32524443
-
Stratified Multivariate Multiscale Dispersion Entropy for Physiological Signal Analysis.IEEE Trans Biomed Eng. 2023 Mar;70(3):1024-1035. doi: 10.1109/TBME.2022.3207582. Epub 2023 Feb 17. IEEE Trans Biomed Eng. 2023. PMID: 36121948
-
Application of non-linear and wavelet based features for the automated identification of epileptic EEG signals.Int J Neural Syst. 2012 Apr;22(2):1250002. doi: 10.1142/S0129065712500025. Int J Neural Syst. 2012. PMID: 23627588
-
Exploratory Outlier Detection for Acceleromyographic Neuromuscular Monitoring: Machine Learning Approach.J Med Internet Res. 2021 May 31;23(6):e25913. doi: 10.2196/25913. J Med Internet Res. 2021. PMID: 34152273 Free PMC article.
References
-
- Faes L., Porta A., Nollo G., Javorka M. Information Decomposition in Multivariate Systems: Definitions, Implementation and Application to Cardiovascular Networks. Entropy. 2016;19:5. doi: 10.3390/e19010005. - DOI
-
- Valente M., Javorka M., Porta A., Bari V., Krohova J., Czippelova B., Turianikova Z., Nollo G., Faes L. Univariate and multivariate conditional entropy measures for the characterization of short-term cardiovascular complexity under physiological stress. Physiol. Meas. 2018;39:014002. doi: 10.1088/1361-6579/aa9a91. - DOI - PubMed
Grants and funding
LinkOut - more resources
Full Text Sources
Other Literature Sources
