. 2021 Feb 20;10(2):456.
doi: 10.3390/cells10020456.

Lysophosphatidic Acid-Activated Calcium Signaling Is Elevated in Red Cells from Sickle Cell Disease Patients

Affiliations

Lysophosphatidic Acid-Activated Calcium Signaling Is Elevated in Red Cells from Sickle Cell Disease Patients

Jue Wang et al. Cells. .

Abstract

(1) Background: It is known that sickle cells contain a higher amount of Ca2+ compared to healthy red blood cells (RBCs). The increased Ca2+ is associated with the most severe symptom of sickle cell disease (SCD), the vaso-occlusive crisis (VOC). The Ca2+ entry pathway received the name of Psickle but its molecular identity remains only partly resolved. We aimed to map the involved Ca2+ signaling to provide putative pharmacological targets for treatment. (2) Methods: The main technique applied was Ca2+ imaging of RBCs from healthy donors, SCD patients and a number of transgenic mouse models in comparison to wild-type mice. Life-cell Ca2+ imaging was applied to monitor responses to pharmacological targeting of the elements of signaling cascades. Infection as a trigger of VOC was imitated by stimulation of RBCs with lysophosphatidic acid (LPA). These measurements were complemented with biochemical assays. (3) Results: Ca2+ entry into SCD RBCs in response to LPA stimulation exceeded that of healthy donors. LPA receptor 4 levels were increased in SCD RBCs. Their activation was followed by the activation of Gi protein, which in turn triggered opening of TRPC6 and CaV2.1 channels via a protein kinase Cα and a MAP kinase pathway, respectively. (4) Conclusions: We found a new Ca2+ signaling cascade that is increased in SCD patients and identified new pharmacological targets that might be promising in addressing the most severe symptom of SCD, the VOC.

Keywords: CaV2.1; G protein signaling; Gárdos channel; LPA receptor; MAP kinase; TRPC6; erythrocytes; protein kinase Cα; sickle cell disease; transgenic mice.


Conflict of interest statement

The authors declare no conflict of interest. The funders had no role in the design of the study; in the collection, analyses, or interpretation of data; in the writing of the manuscript, or in the decision to publish the results.

Figures

Figure 1
Figure 1
LPA-induced increase in intracellular Ca2+ in RBCs from healthy donors compared to HbSS SCD patients. (A) depicts the measurements for healthy control cells, while (B) shows the same approach for RBCs from SCD patients. (a) shows bright field images and fluorescence images under unstimulated control conditions. (b) Representative image sections with RBCs marked with regions of interest (ROI) in different colors. In the traces below the images, the fluorescence intensities (selfratio F/Fo) of the cells marked (same color codes as the ROI) are plotted. The bars above the traces indicate the presence/application of the external solution. Numbers at the dashed lines correspond to the numbers of the images above. (c) gives the collection of all fluorescence intensity traces (similar as in (b)) but for all cells measured with LPA stimulation. (d) shows the same as in (c) for control experiments without stimulation. (C) Statistical analysis of the max. value of each trace as outlined in (bd). Since cellular values are not Gaussian distributed, statistics show medians and 10–90% boxes. Numbers below the boxes refer to the number of cells analyzed originating from at least three different experiments. ns stands for not significant (p > 0.05) and *** for p < 0.001. All measurements were performed at room temperature.
Figure 2
Figure 2
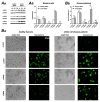
LPA receptors (LPAR) in RBCs from healthy donors compared to SCD patients. (Aa) depicts the Western blots of LPAR 1, 2 and 4 for healthy RBCs (H1–H3) and sickle cells (S1–S3). As a loading control, we used GAPDH. (Ab) shows the statistical analysis of the Western blots as presented in (Aa). For LPARs 3 and 5, the bands were below the detection limit. Examples of full gel Western blots for all LPA receptors tested are provided in Supplemental Figure S1. (Ba) shows confocal z-projections of immunocytochemistry staining for control conditions (only secondary Alexa Flour 488-labeled antibody) and for the three abundant LPARs in comparison to brightfield images of healthy (left) and SCD (right) RBCs. Even if the cell number in particular images is rather low, we ensure that they are representative for the cell population. (Bb) summarizes the statistical analysis of the immunostainings as depicted in (Ba) supporting the Western blot data. ns stands for not significant (p > 0.05) and *** for p < 0.001.
Figure 3
Figure 3
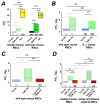
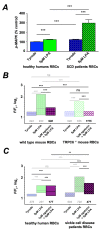
G protein signaling in LPA-induced Ca2+ entry into RBCs. More transparent boxes in the statistics indicate data that are replotted for comparison. All panels present the statistical evaluation, with the numbers below the boxes indicating the number of cells measured. (A) The pan-specific G protein activator AlF4 induces a Ca2+ entry in human and mouse RBCs exceeding the one of LPA stimulation. (B) LPA-induced Ca2+ entry in RBCs of Gα11 knock-out mice shows no difference compared to cells of wild-type mice. (C) The Gαi-specific inhibitor PTX is able to fully block LPA-induced Ca2+ entry in mouse RBCs. (D) LPA stimulation of PTX-pretreated RBCs of healthy donors and sickle cell disease patients. Numbers below the boxes refer to the number of cells analyzed originating from at least three different experiments. ns stands for not significant (p > 0.05) and *** for p < 0.001. All measurements were performed at room temperature.
Figure 4
Figure 4
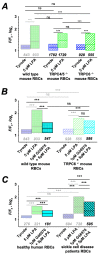
i protein signaling activates TRPC6. More transparent boxes indicate data that are replotted for comparison. All panels present the statistical evaluation, with the numbers below the boxes indicating the number of cells measured. (A) LPA stimulation of RBCs from TRPC4/5−/− double knock-out and TRPC6−/− mice in comparison to wild-type mice. (B) Gö6976 pretreatment has no effect on the LPA response of TRPC6−/− RBCs but suppresses Ca2+ entry in RBCs of wild-type mice. (C) Same experiments as in (B) but with RBCs from healthy humans and sickle cell disease patients. Numbers below the boxes refer to the number of cells analyzed originating from at least three different experiments. ns stands for not significant (p > 0.05) and *** for p < 0.001. All measurements were performed at room temperature.
Figure 5
Figure 5
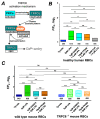
Activation mechanism of TRPC6 by PKCα. (A) shows a scheme of the TRPC6 activation mechanism by PKCα. (B) presents the statistical evaluation of human RBCs pretreated with Gö6976, FK506 or Cyclosporin A (CsA) followed by LPA stimulation. (C) depicts the statistical evaluation of wild-type mouse RBCs in comparison to RBCs from TRPC6−/− mice for perfusion with Tyrode (control), 5 µM LPA stimulation and 5 µM LPA stimulation with pretreatment of 1 µM Gö6976 or 10 µM FK506. The numbers below the boxes indicate the number of cells measured in at least three different experiments. ns stands for not significant (p > 0.05), ** for p < 0.01 and *** for p < 0.001. All measurements were performed at room temperature.
Figure 6
Figure 6
A Gαi protein singling activates MAPK and ω-agatoxin-TK-sensitive Ca2+ entry. (A) Phosphorylation assay for MAPK activity by ELISA for RBCs from healthy humans and sickle cell disease patients at rest (Tyrode) and after 15 min of 5 µM LPA stimulation. (B,C) More transparent boxes in the statistics indicate data that are replotted for comparison. (B,C) present the statistical evaluation, with the numbers below the boxes indicating the number of cells measured. (B) LPA stimulation of RBCs from wild-type and TRPC6−/− mice with and without ω-agatoxin-TK pretreatment was followed by fluorescence read out of the Ca2+ fluorophore Fluo-4. (C) Same experiments as in (B) but with RBCs from healthy humans and SCD patients. All measurements were performed at room temperature. ns stands for not significant (p > 0.05), ** for p < 0.01 and *** for p < 0.001. All measurements were performed at room temperature.
Figure 7
Figure 7
Activation mechanism of CaV2.1 by the Gárdos channel. (A) shows a scheme of the CaV2.1 activation mechanism involving the Gárdos channel. (B) presents the statistical evaluation of RBCs pretreated with the Gárdos channel inhibitor Charybdotoxin (ChTX) followed by LPA stimulation, with the numbers below the boxes indicating the number of cells measured in at least three different experiments. *** stands for p < 0.001. All measurements were performed at room temperature.
Figure 8
Figure 8
The MAPK-associated pathway. More transparent boxes in the statistics indicate data that are replotted for comparison. All panels present the statistical evaluation, with the numbers below the boxes indicating the number of cells measured. (A) LPA stimulation of RBCs from wild-type and TRPC6−/− mice after pretreatment with Wortmannin or U0126 was followed by fluorescence read out of the Ca2+ fluorophore Fluo-4. (B) Same experiments as in (A) but with RBCs from healthy humans and sickle cell disease patients. (C) shows the statistical evaluation of RBCs pretreated with Gö6976 and Wortmannin followed by LPA stimulation. All measurements were performed at room temperature. ns stands for not significant (p > 0.05) * for p < 0.05, ** for p < 0.01 and *** for p < 0.001.
Figure 9
Figure 9
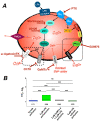
Overview of the Ca2+ signaling cascade. (A) shows a scheme of the hypothesized Ca2+ signaling cascade based on the indications presented in this paper. It includes the pharmacological tools (inhibitors) used to probe the RBCs (dark red). The cascade starts with LPA stimulation of LPA receptors as outlined in Figure 1 and Figure 2. G protein signaling was shown in Figure 3. The involvement of PKCα and TRPC6 in one of the signaling branches was indicated in Figure 4. PKCα is generally activated through the involvement of phospholipase Cβ (PLCβ), phosphatidylinositol-4,5-bisphosphate (PIP2) and diacylglycerol (DAG) [56]. The detailed activation of TRPC6 by PKCα (black dotted box) is shown in Figure 5A. The second signaling branch involving PI3 kinase (PI3K), MEP, MAP kinase (MAPK) and CaV2.1 was explored in Figure 6, Figure 7 and Figure 8, whereas the detailed interaction between CaV2.1 and the Gárdos channel (black dashed box) is detailed in Figure 7A. Indications for a fractual Ca2+ signaling by a mechanosensitive ion channel are provided in (B). Piezo1 as indicated by the scheme is only an example for a mechanosensitive channel. The plasma membrane Ca2+ pump (PMCA) was not investigated within this paper but since it is the major transport mechanism of Ca2+ out of the RBC, it was added to complete the overall picture. (B) presents the statistical evaluation of human RBCs pretreated with the inhibitor of mechanosensitive channels, GsMTx-4, followed by LPA stimulation, with the numbers below the boxes indicating the number of cells measured in at least three different experiments. In contrast to all other experiments, for the measurement of the grey bar, no local perfusion system was used to completely avoid any shear stress to the cells. ns stands for p < 0.05 and *** for p < 0.001. All measurements were performed at room temperature.

References

    1. Lew V.L., Tsien R.Y., Miner C., Bookchin R.M. Physiological [Ca2+]i Level and Pump-Leak Turnover in Intact Red Cells Measured Using an Incorporated Ca Chelator. Nature. 1982;298:478–481. doi: 10.1038/298478a0. - DOI - PubMed
    1. Etzion Z., Tiffert T., Bookchin R.M., Lew V.L. Effects of Deoxygenation on Active and Passive Ca2+ Transport and on the Cytoplasmic Ca2+ Levels of Sickle Cell Anemia Red Cells. J. Clin. Investig. 1993;92:2489–2498. doi: 10.1172/JCI116857. - DOI - PMC - PubMed
    1. Kaestner L., Bianchi P. Trends in the Development of Diagnostic Tools for Red Blood Cell-Related Diseases and Anemias. Front. Physiol. 2020;11:387. doi: 10.3389/fphys.2020.00387. - DOI - PMC - PubMed
    1. Nguyen D.B., Wagner-Britz L., Maia S., Steffen P., Wagner C., Kaestner L., Bernhardt I. Regulation of Phosphatidylserine Exposure in Red Blood Cells. Cell Physiol. Biochem. 2011;28:847–856. doi: 10.1159/000335798. - DOI - PubMed
    1. Weiss E., Rees D.C., Gibson J.S. Role of Calcium in Phosphatidylserine Externalisation in Red Blood Cells from Sickle Cell Patients. Anemia. 2011;2011:379894. doi: 10.1155/2011/379894. - DOI - PMC - PubMed

Publication types

LinkOut - more resources