

Overexpression of the Zygophyllum xanthoxylum Aquaporin, ZxPIP1;3, Promotes Plant Growth and Stress Tolerance
- PMID: 33672712
- PMCID: PMC7924366
- DOI: 10.3390/ijms22042112
Overexpression of the Zygophyllum xanthoxylum Aquaporin, ZxPIP1;3, Promotes Plant Growth and Stress Tolerance
Abstract
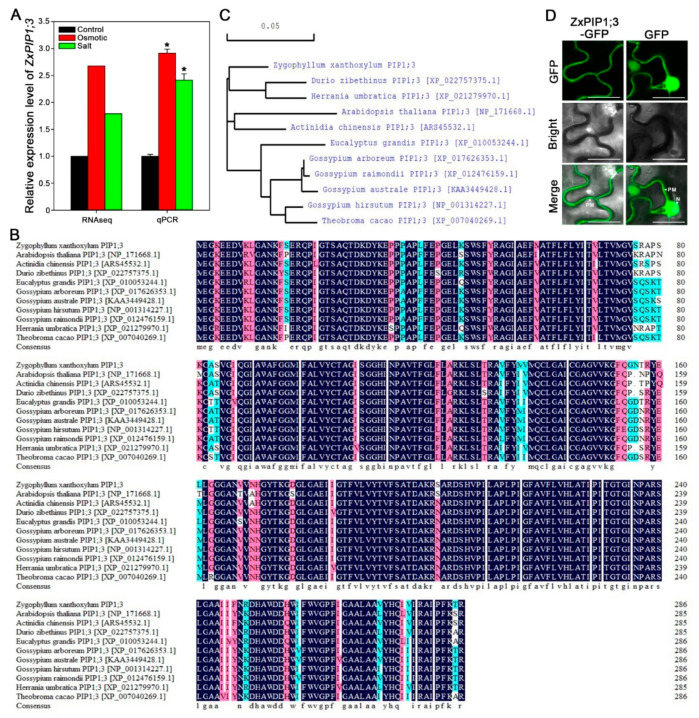
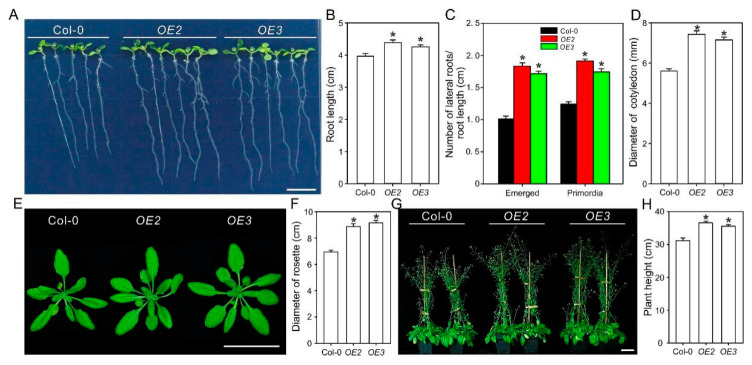
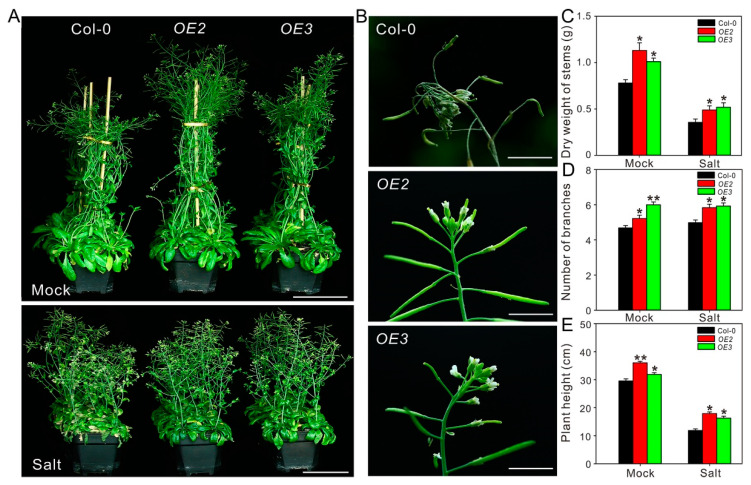
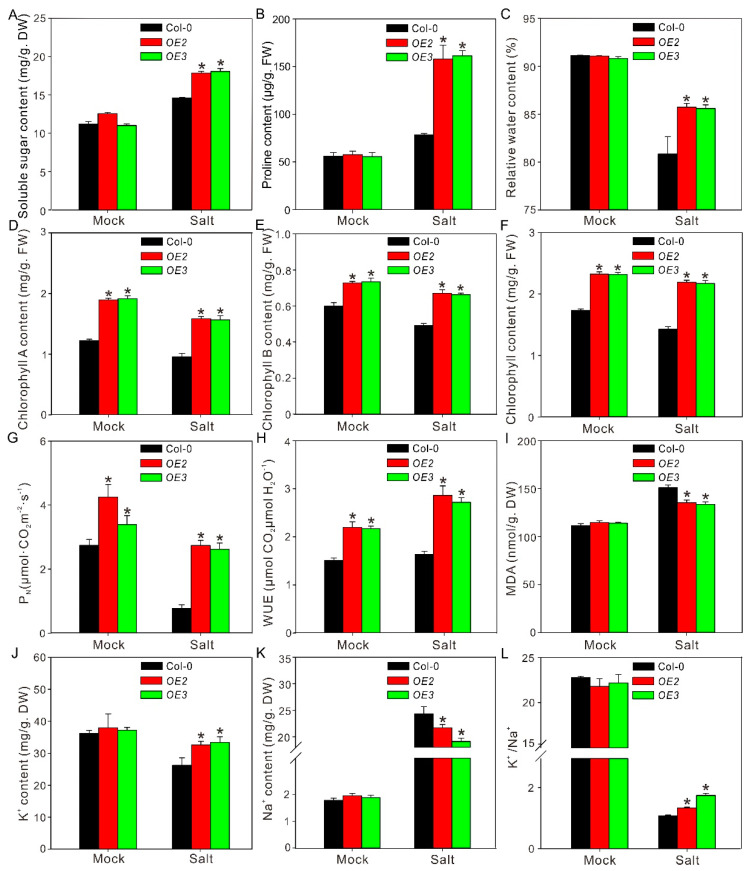
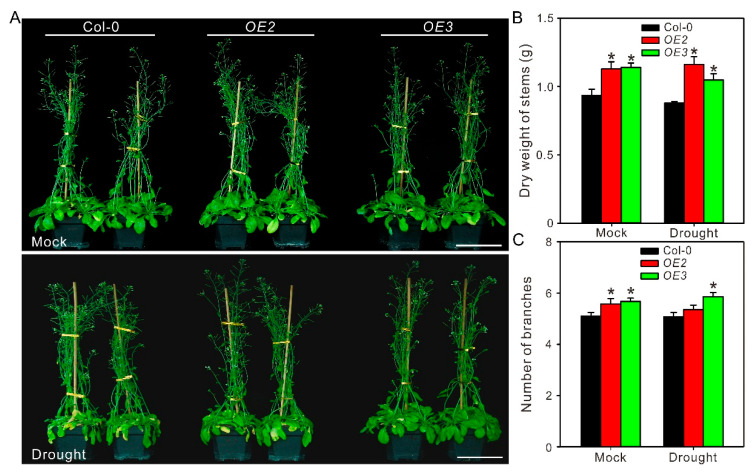
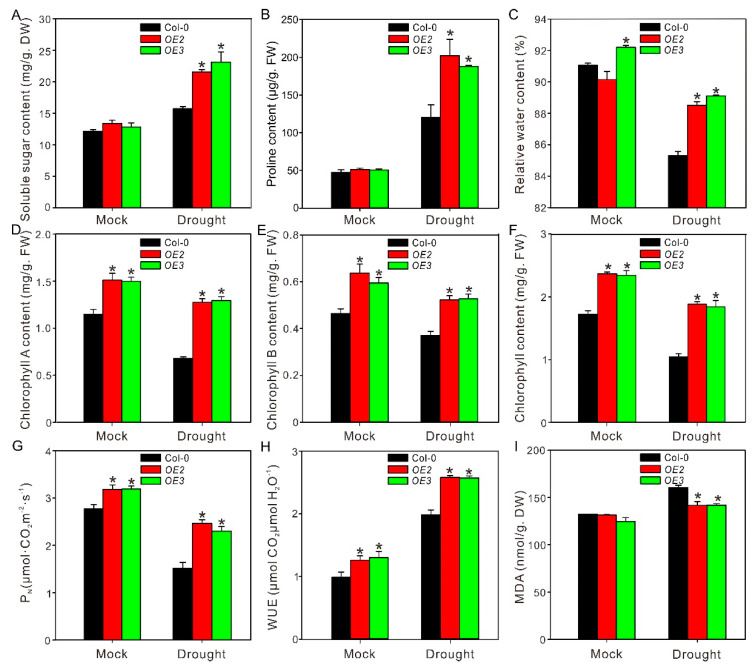
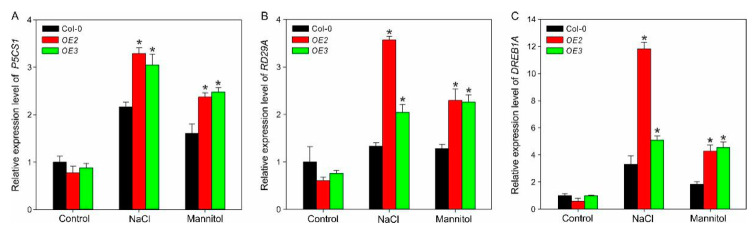
Drought and salinity can result in cell dehydration and water unbalance in plants, which seriously diminish plant growth and development. Cellular water homeostasis maintained by aquaporin is one of the important strategies for plants to cope with these two stresses. In this study, a stress-induced aquaporin, ZxPIP1;3, belonging to the PIP1 subgroup, was identified from the succulent xerophyte Zygophyllum xanthoxylum. The subcellular localization showed that ZxPIP1;3-GFP was located in the plasma membrane. The overexpression of ZxPIP1;3 in Arabidopsis prompted plant growth under favorable condition. In addition, it also conferred salt and drought tolerance with better water status as well as less ion toxicity and membrane injury, which led to more efficient photosynthesis and improved growth vigor via inducing stress-related responsive genes. This study reveals the molecular mechanisms of xerophytes' stress tolerance and provides a valuable candidate that could be used in genetic engineering to improve crop growth and stress tolerance.
Keywords: Zygophyllum xanthoxylum; abiotic stress; aquaporin; plant growth.
Conflict of interest statement
The authors declare no conflict of interest.
Figures
Similar articles
-
The ZxNHX gene encoding tonoplast Na(+)/H(+) antiporter from the xerophyte Zygophyllum xanthoxylum plays important roles in response to salt and drought.J Plant Physiol. 2011 May 15;168(8):758-67. doi: 10.1016/j.jplph.2010.10.015. Epub 2011 Jan 7. J Plant Physiol. 2011. PMID: 21216025
-
Silicon improves photosynthesis and strengthens enzyme activities in the C3 succulent xerophyte Zygophyllum xanthoxylum under drought stress.J Plant Physiol. 2016 Jul 20;199:76-86. doi: 10.1016/j.jplph.2016.05.009. Epub 2016 May 24. J Plant Physiol. 2016. PMID: 27302008
-
Co-expression of tonoplast Cation/H(+) antiporter and H(+)-pyrophosphatase from xerophyte Zygophyllum xanthoxylum improves alfalfa plant growth under salinity, drought and field conditions.Plant Biotechnol J. 2016 Mar;14(3):964-75. doi: 10.1111/pbi.12451. Epub 2015 Aug 13. Plant Biotechnol J. 2016. PMID: 26268400 Free PMC article.
-
Plant aquaporins alleviate drought tolerance in plants by modulating cellular biochemistry, root-architecture, and photosynthesis.Physiol Plant. 2021 Jun;172(2):1030-1044. doi: 10.1111/ppl.13324. Epub 2021 Jan 19. Physiol Plant. 2021. PMID: 33421148 Review.
-
Evolution and function analysis of auxin response factors reveal the molecular basis of the developed root system of Zygophyllum xanthoxylum.BMC Plant Biol. 2024 Feb 2;24(1):81. doi: 10.1186/s12870-023-04717-7. BMC Plant Biol. 2024. PMID: 38302884 Free PMC article. Review.
Cited by
-
Combined transcriptomic and metabolomic analysis reveals a role for adenosine triphosphate-binding cassette transporters and cell wall remodeling in response to salt stress in strawberry.Front Plant Sci. 2022 Sep 6;13:996765. doi: 10.3389/fpls.2022.996765. eCollection 2022. Front Plant Sci. 2022. PMID: 36147238 Free PMC article.
-
Overexpression of the Eucommia~ulmoides Aquaporin, EuPIP1;1, Promotes Leaf Growth, Flowering and Bolting, and Stress Tolerance in Arabidopsis.Int J Mol Sci. 2022 Oct 4;23(19):11794. doi: 10.3390/ijms231911794. Int J Mol Sci. 2022. PMID: 36233096 Free PMC article.
-
Molecular Aspects of Plant Salinity Stress and Tolerance.Int J Mol Sci. 2021 May 6;22(9):4918. doi: 10.3390/ijms22094918. Int J Mol Sci. 2021. PMID: 34066387 Free PMC article.
References
MeSH terms
Substances
Grants and funding
LinkOut - more resources
Full Text Sources
Other Literature Sources
