

The Benefits and Hazards of Intravitreal Mesenchymal Stem Cell (MSC) Based-Therapies in the Experimental Ischemic Optic Neuropathy
- PMID: 33672743
- PMCID: PMC7924624
- DOI: 10.3390/ijms22042117
The Benefits and Hazards of Intravitreal Mesenchymal Stem Cell (MSC) Based-Therapies in the Experimental Ischemic Optic Neuropathy
Abstract
Mesenchymal stem cell (MSC) therapy has been investigated intensively for many years. However, there is a potential risk related to MSC applications in various cell niches.
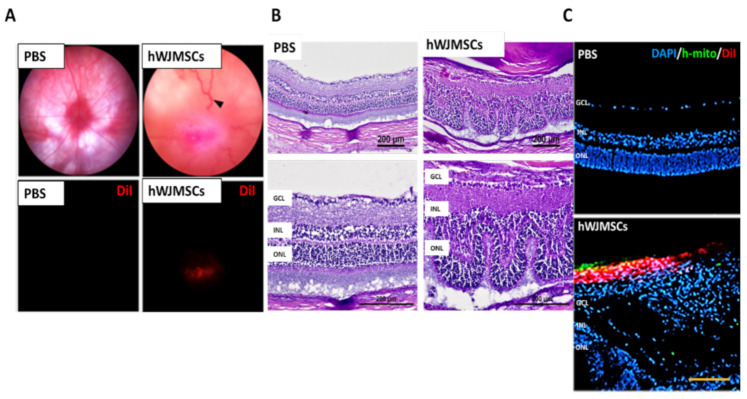
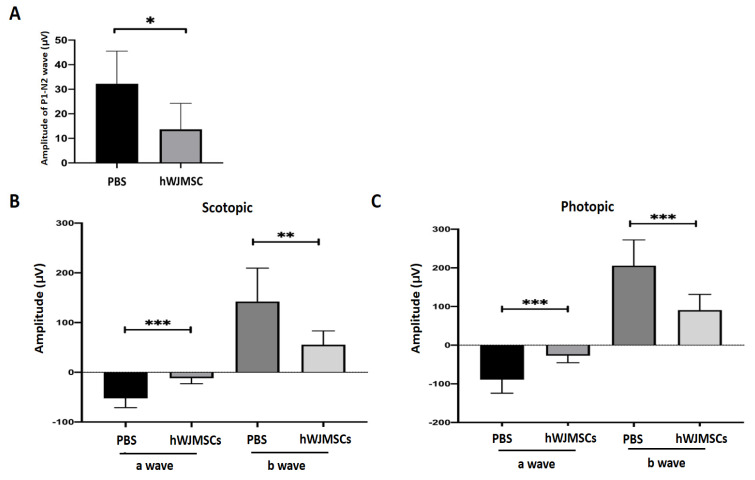
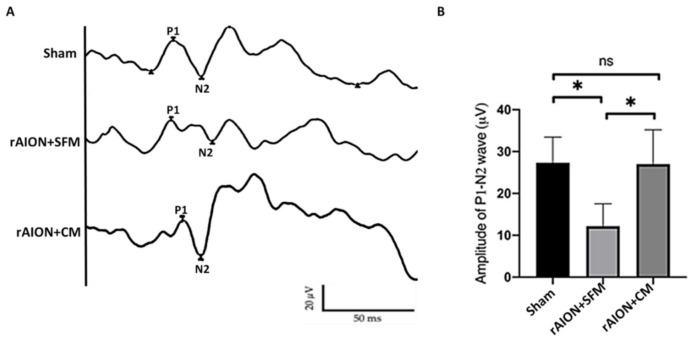
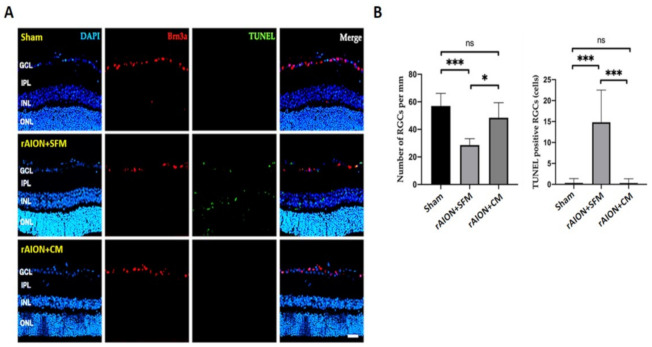
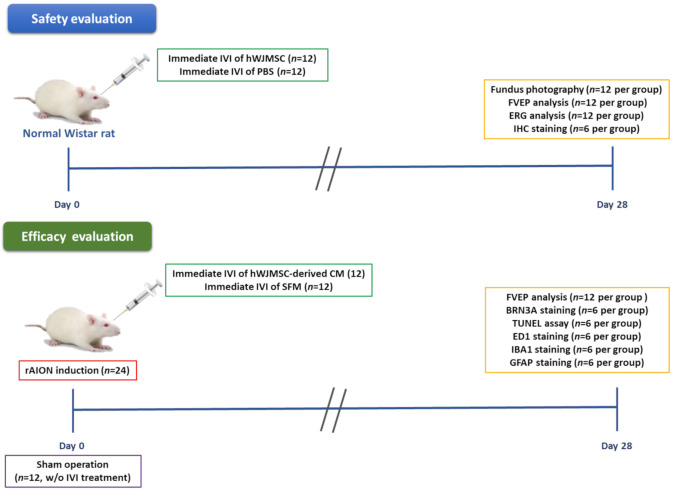
Methods: The safety of intravitreal MSC application and the efficacy of MSC-derived conditioned medium (MDCM) were evaluated in the normal eye and the diseased eye, respectively. For safety evaluation, the fundus morphology, visual function, retinal function, and histological changes of the retina were examined. For efficacy evaluation, the MDCM was intravitreally administrated in a rodent model of anterior ischemic optic neuropathy (rAION). The visual function, retinal ganglion cell (RGC) density, and neuroinflammation were evaluated at day 28 post-optic nerve (ON) infarct.
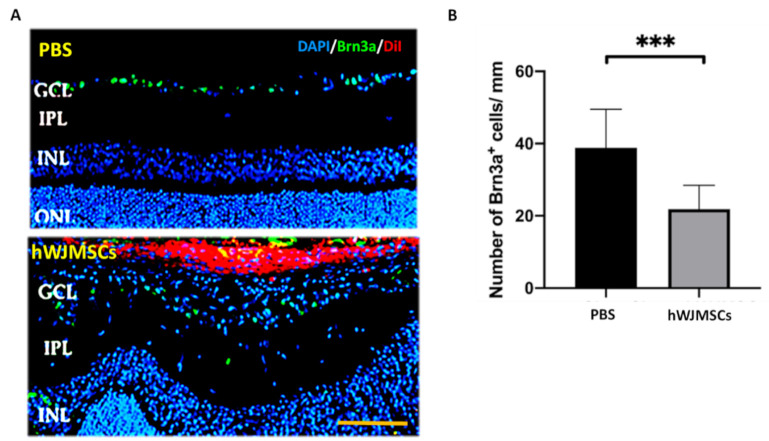
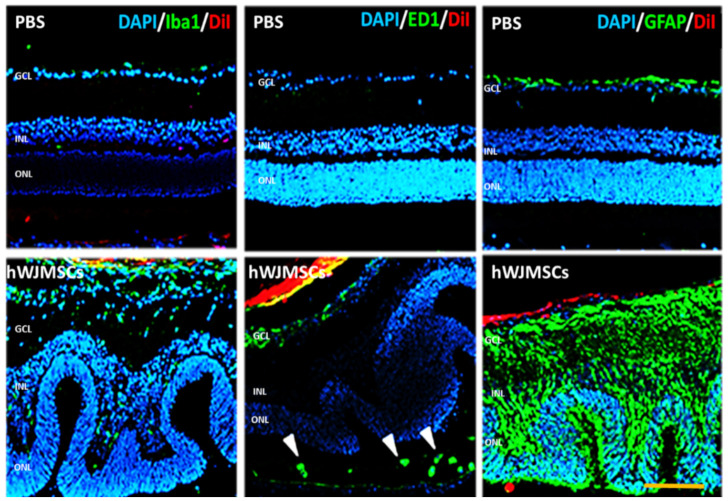
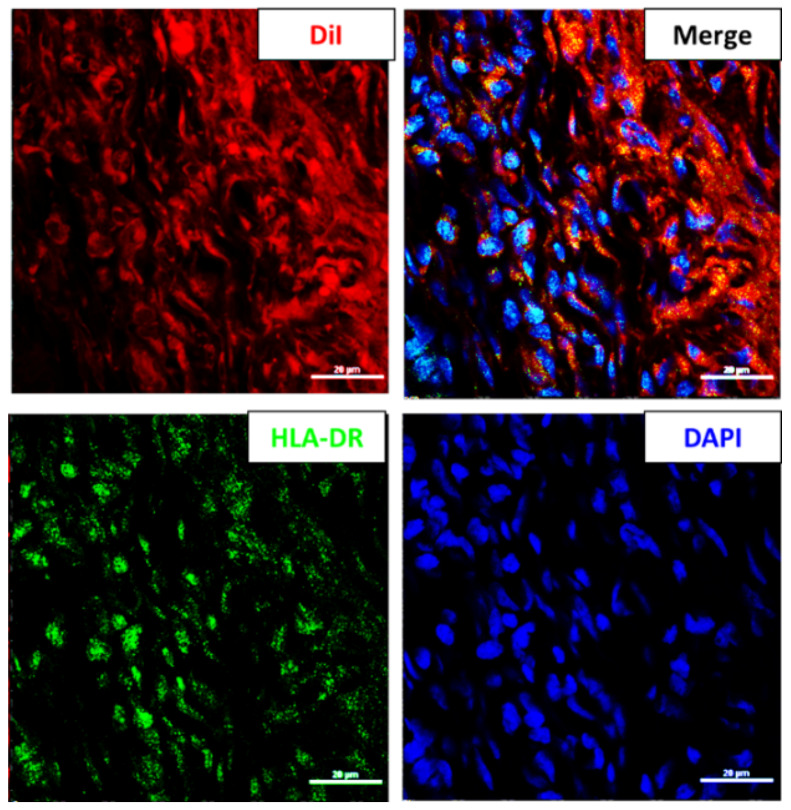
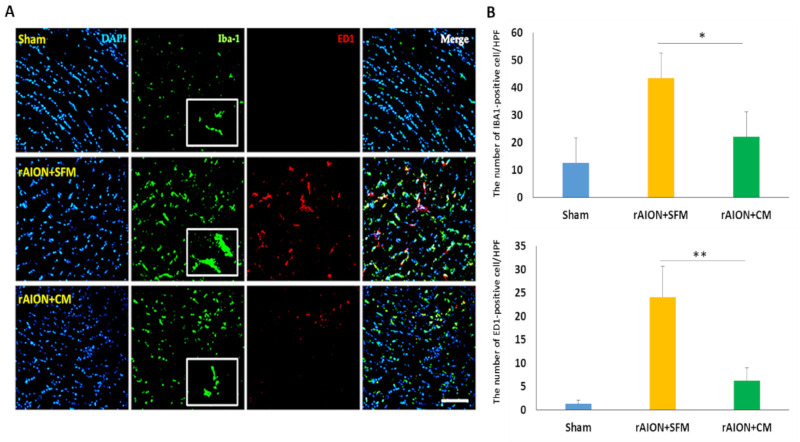
Results: The fundus imaging showed that MSC transplantation induced retinal distortion and venous congestion. The visual function, retinal function, and RGC density were significantly decreased in MSC-treated eyes. MSC transplantation induced astrogliosis, microgliosis, and macrophage infiltration in the retina due to an increase in the HLA-DR-positive MSC proportion in vitreous. Treatment with the MDCM preserved the visual function and RGC density in rAION via inhibition of macrophage infiltration and RGC apoptosis.
Conclusions: The vitreous induced the HLA-DR expression in the MSCs to cause retinal inflammation and retina injury. However, the MDCM provided the neuroprotective effects in rAION.
Keywords: HLA-DR expression; MSC-derived conditioned medium; mesenchymal stem cell; rodent model of anterior ischemic optic neuropathy.
Conflict of interest statement
The authors declare no conflict of interest.
Figures
Similar articles
-
Neuroprotective effects of recombinant human granulocyte colony-stimulating factor (G-CSF) in a rat model of anterior ischemic optic neuropathy (rAION).Exp Eye Res. 2014 Jan;118:109-16. doi: 10.1016/j.exer.2013.11.012. Epub 2013 Dec 5. Exp Eye Res. 2014. PMID: 24316388
-
Early applications of granulocyte colony-stimulating factor (G-CSF) can stabilize the blood-optic-nerve barrier and ameliorate inflammation in a rat model of anterior ischemic optic neuropathy (rAION).Dis Model Mech. 2016 Oct 1;9(10):1193-1202. doi: 10.1242/dmm.025999. Epub 2016 Aug 18. Dis Model Mech. 2016. PMID: 27538969 Free PMC article.
-
[Nonarteritic ischemic optic neuropathy animal model and its treatment applications].Nippon Ganka Gakkai Zasshi. 2014 Apr;118(4):331-61. Nippon Ganka Gakkai Zasshi. 2014. PMID: 24864434 Review. Japanese.
-
Transplantation of BDNF-secreting mesenchymal stem cells provides neuroprotection in chronically hypertensive rat eyes.Invest Ophthalmol Vis Sci. 2011 Jun 23;52(7):4506-15. doi: 10.1167/iovs.11-7346. Invest Ophthalmol Vis Sci. 2011. PMID: 21498611 Free PMC article.
-
Advances in the applications of mesenchymal stem cell-conditioned medium in ocular diseases.Exp Eye Res. 2023 Aug;233:109560. doi: 10.1016/j.exer.2023.109560. Epub 2023 Jun 28. Exp Eye Res. 2023. PMID: 37385531 Review.
Cited by
-
Crosstalk Between Microglia and Müller Glia in the Age-Related Macular Degeneration: Role and Therapeutic Value of Neuroinflammation.Aging Dis. 2024 May 7;15(3):1132-1154. doi: 10.14336/AD.2023.0823-3. Aging Dis. 2024. PMID: 37728589 Free PMC article. Review.
-
Protective effect of human umbilical cord mesenchymal stem cell-derived exosomes on rat retinal neurons in hyperglycemia through the brain-derived neurotrophic factor/TrkB pathway.Int J Ophthalmol. 2021 Nov 18;14(11):1683-1689. doi: 10.18240/ijo.2021.11.06. eCollection 2021. Int J Ophthalmol. 2021. PMID: 34804857 Free PMC article.
-
Tacrolimus Improves Therapeutic Efficacy of Umbilical Cord Blood-Derived Mesenchymal Stem Cells in Diabetic Retinopathy by Suppressing DRP1-Mediated Mitochondrial Fission.Antioxidants (Basel). 2023 Sep 6;12(9):1727. doi: 10.3390/antiox12091727. Antioxidants (Basel). 2023. PMID: 37760030 Free PMC article.
-
Future Directions in Diabetic Retinopathy Treatment: Stem Cell Therapy, Nanotechnology, and PPARα Modulation.J Clin Med. 2025 Jan 21;14(3):683. doi: 10.3390/jcm14030683. J Clin Med. 2025. PMID: 39941353 Free PMC article. Review.
-
Stem Cell Therapy for Retinal Degeneration: The Evidence to Date.Biologics. 2021 Jul 27;15:299-306. doi: 10.2147/BTT.S290331. eCollection 2021. Biologics. 2021. PMID: 34349498 Free PMC article. Review.
References
-
- Wen Y.T., Huang T.L., Huang S.P., Chang C.H., Tsai R.K. Early applications of granulocyte colony-stimulating factor (G-CSF) can stabilize the blood-optic-nerve barrier and ameliorate inflammation in a rat model of anterior ischemic optic neuropathy (rAION) Dis. Models Mech. 2016;9:1193–1202. doi: 10.1242/dmm.025999. - DOI - PMC - PubMed
MeSH terms
Substances
Grants and funding
LinkOut - more resources
Full Text Sources
Other Literature Sources
Research Materials
Miscellaneous
