. 2021 Feb 14;22(4):1887.
doi: 10.3390/ijms22041887.

Intestinal Epithelial Barrier Maturation by Enteric Glial Cells Is GDNF-Dependent

Affiliations

Intestinal Epithelial Barrier Maturation by Enteric Glial Cells Is GDNF-Dependent

Michael Meir et al. Int J Mol Sci. .

Abstract

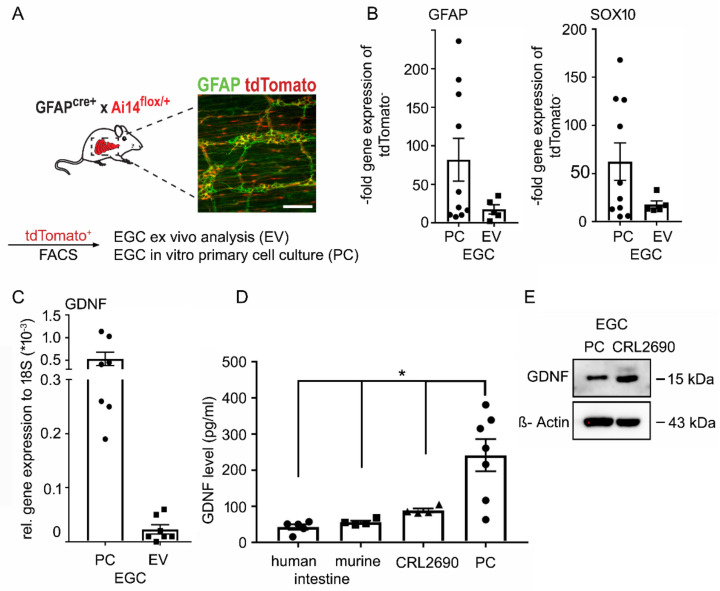
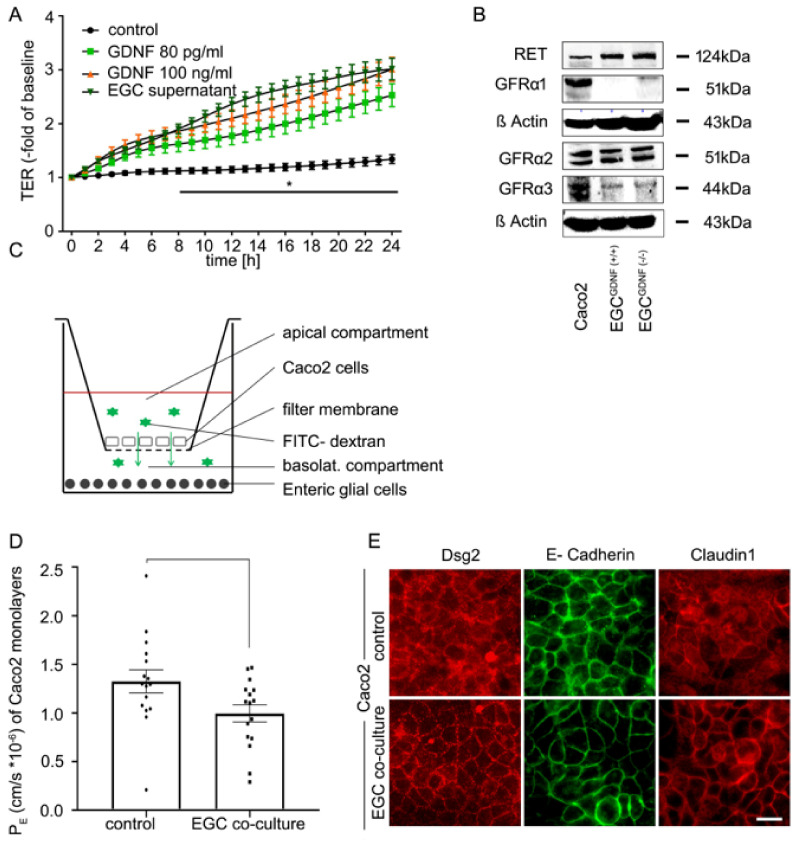
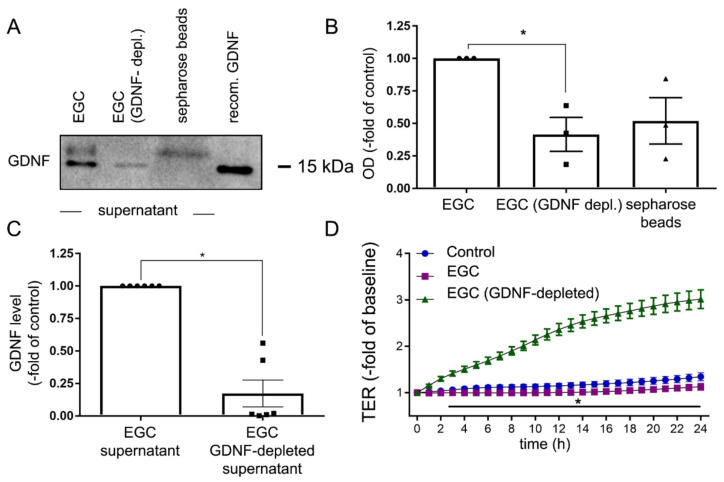
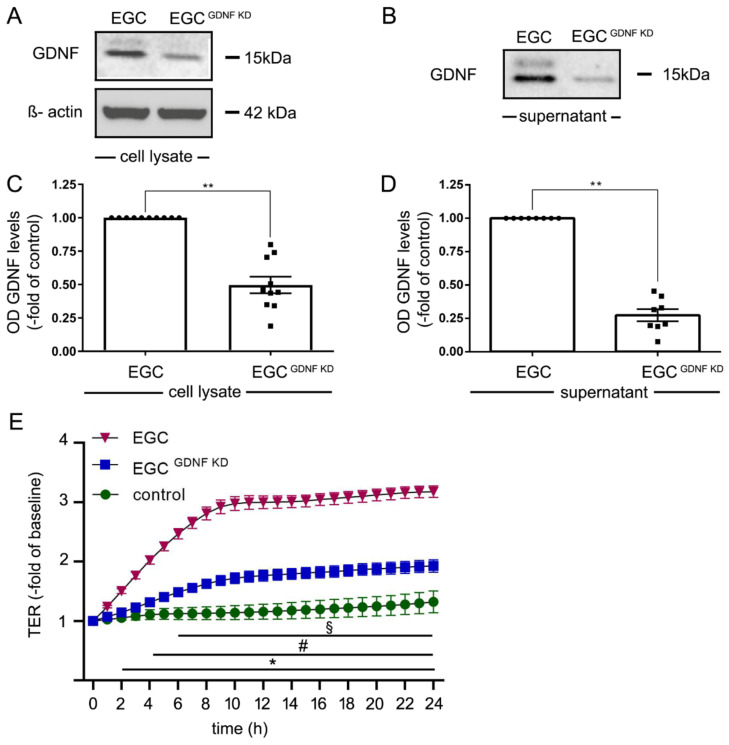
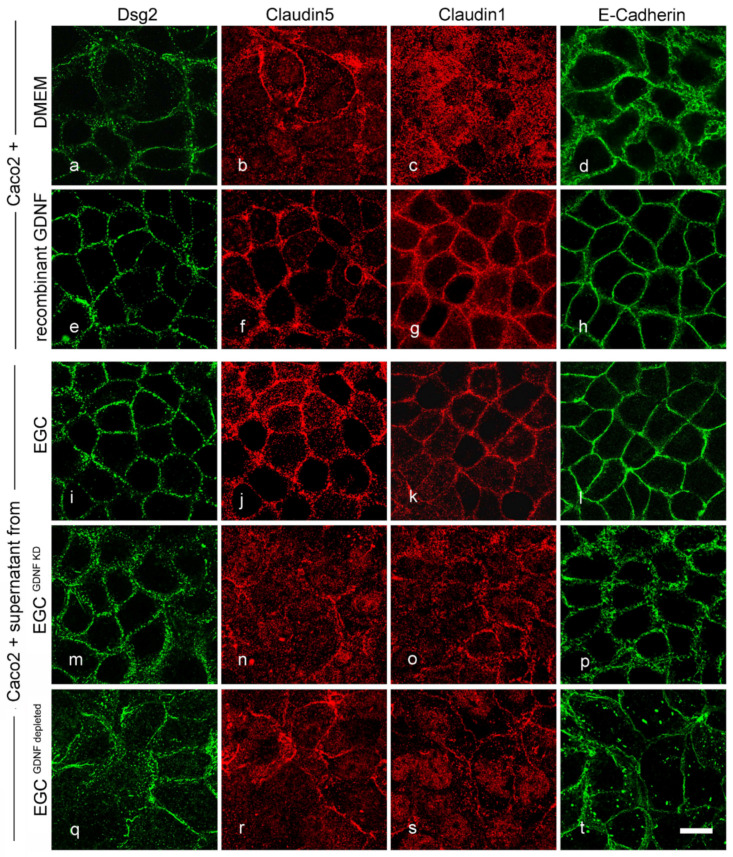
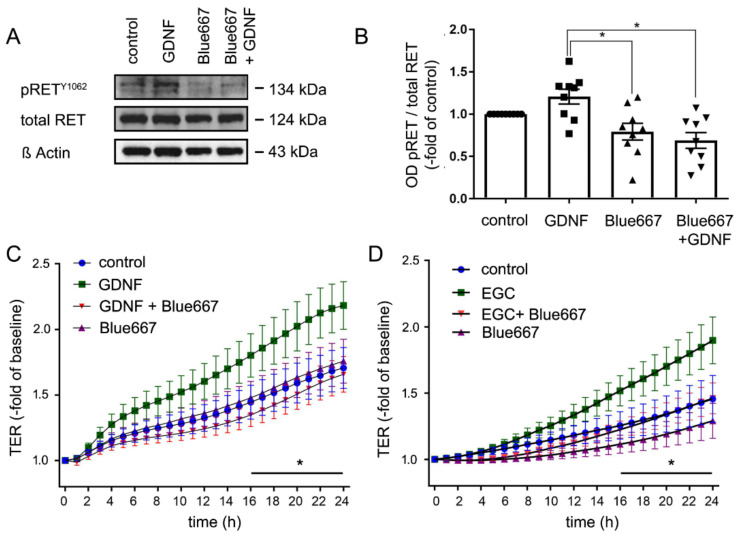
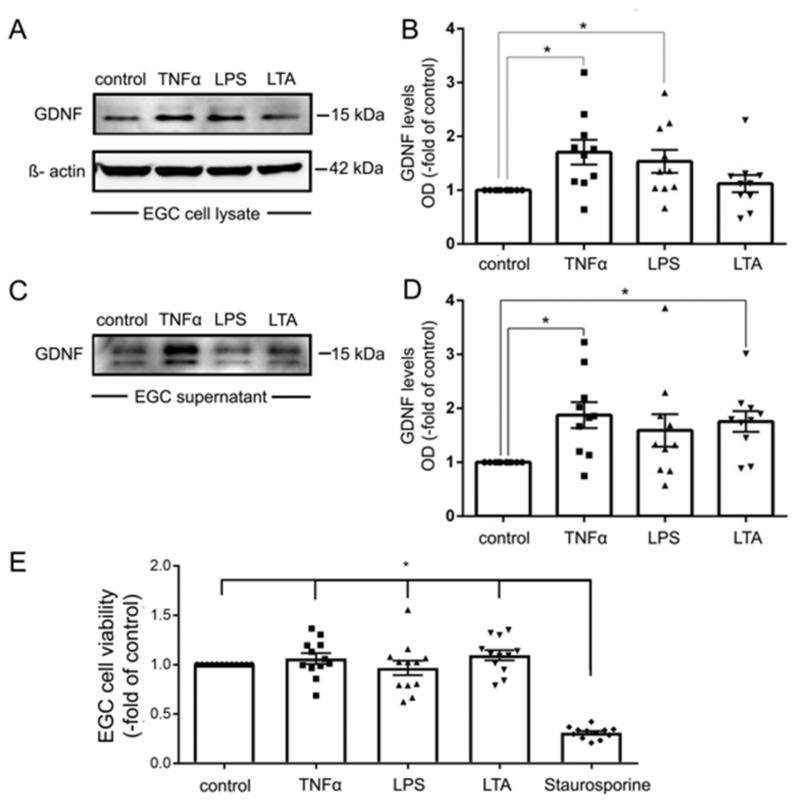
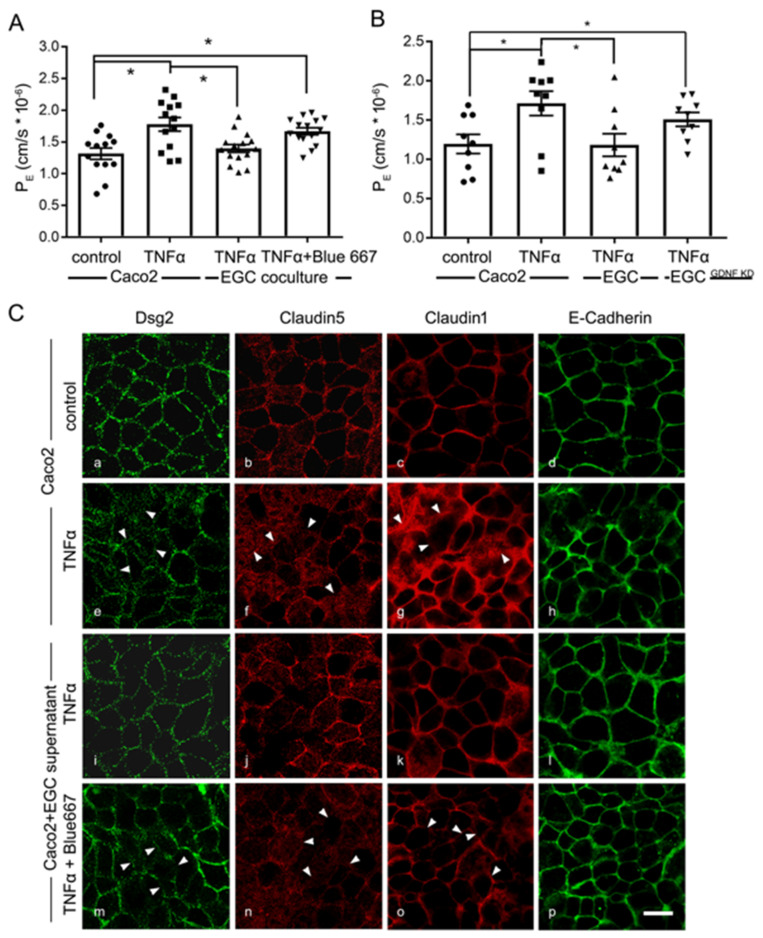
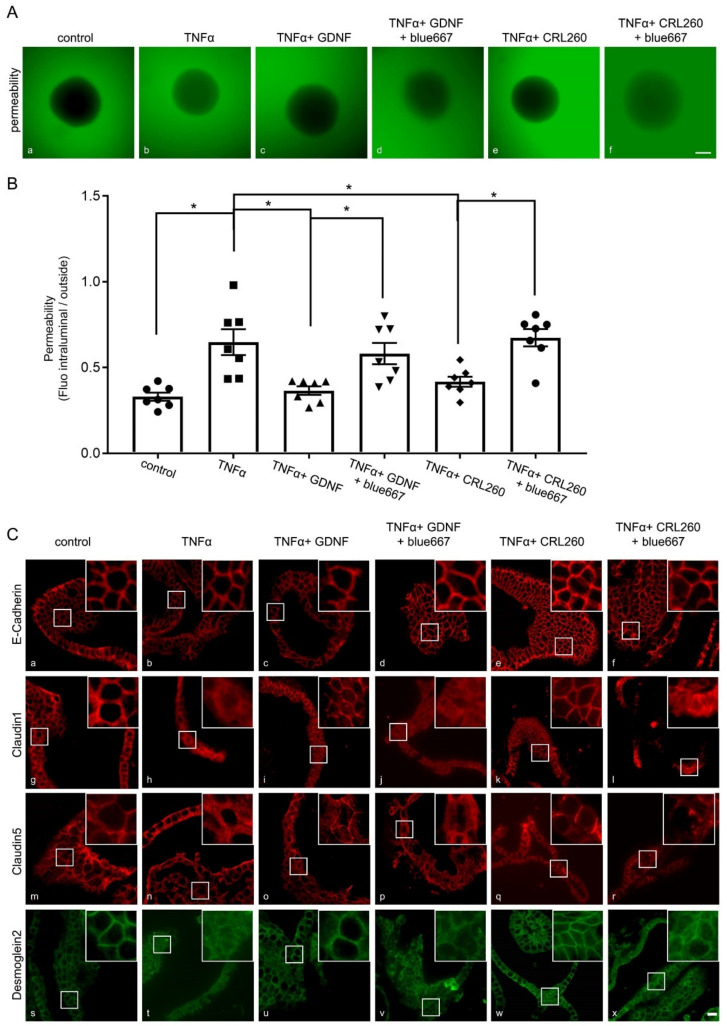
Enteric glial cells (EGCs) of the enteric nervous system are critically involved in the maintenance of intestinal epithelial barrier function (IEB). The underlying mechanisms remain undefined. Glial cell line-derived neurotrophic factor (GDNF) contributes to IEB maturation and may therefore be the predominant mediator of this process by EGCs. Using GFAPcre x Ai14floxed mice to isolate EGCs by Fluorescence-activated cell sorting (FACS), we confirmed that they synthesize GDNF in vivo as well as in primary cultures demonstrating that EGCs are a rich source of GDNF in vivo and in vitro. Co-culture of EGCs with Caco2 cells resulted in IEB maturation which was abrogated when GDNF was either depleted from EGC supernatants, or knocked down in EGCs or when the GDNF receptor RET was blocked. Further, TNFα-induced loss of IEB function in Caco2 cells and in organoids was attenuated by EGC supernatants or by recombinant GDNF. These barrier-protective effects were blunted when using supernatants from GDNF-deficient EGCs or by RET receptor blockade. Together, our data show that EGCs produce GDNF to maintain IEB function in vitro through the RET receptor.

Keywords: GDNF5; RET6; enteric glial cells; enteric nervous system; gut barrier; inflammatory bowel disease; intercellular junctions; intestinal epithelial barrier; neurotrophic factors.


Conflict of interest statement

The authors declare no conflict of interest.

Figures

Figure 1
Figure 1
Enteric glial cells (EGC) express and secrete Glial cell line-derived neurotrophic factor (GDNF) at physiologically-relevant doses in vivo and in vitro. (A). Immunostaining of glial fibrillary acidic protein (GFAP) in the intestine from GFAPcre x Ai14floxed showed a co-localization of the inducible fluorescence protein tdTomato (red) and GFAP (green) at the plexus myentericus. (n = 8, scale 50µm). (B). qPCR of tdTomato positive cells that were sorted by Fluorescence-activated cell sorting (FACS) revealed that the cells express glial markers Sox10 and GFAP ex vivo and in primary cell culture (PC) (n = 5). (C). qPCR of that cells confirmed that tdTomato positive cells express GDNF ex vivo and in primary cell culture (n = 7). (D). GDNF ELISAs were performed of human (n = 5) and murine ileum lysates (n = 4) showing levels of GDNF at 56.0 ± 4.3 pg/mL and 42.6 ± 7.4 pg/mL. In supernatants from EGCs (CRL2690) (n = 4) GDNF levels of 88.7 ± 5.5 pg/mL and of primary EGCs GDNF levels of 241.7 ± 44.4 pg/mL were detected (n = 7; * = p < 0.05). (E). Lysates of primary EGCs as well as CRL2690 cells are positive for GDNF in Western Blots (n = 8). Quantification of the GDNF blots is shown in Supplementary Figure S1.
Figure 2
Figure 2
Co-culture of enteric glial cells (EGC) with Caco2 cells stabilizes epithelial barrier function. (A). Measurements of transepithelial electric resistance (TER) showed a significant increase beginning at 8 h after incubation with the supernatant of EGC and raised to 3.01 ± 0.1-fold of baseline (equates to 2.24-fold of controls) while incubation with glial cell line-derived neurotrophic factor (GDNF) at 100 ng/mL increased TER significantly to 2.99 ± 0.07 of baseline (2.23-fold of controls) after 24 h. Similar results were obtained when GDNF was applied at 80 pg/mL when TER increased to 2.52 ± 0.09 -fold of baseline (1.88-fold of controls); (n = 6, * = significant different vs. control after 8 h for all other conditions; p < 0.05, two-way ANOVA). Control = Caco2 monolayer without treatment. (B). Western Blots of Caco2 cells and EGC cells (wilde type (WT) and GDNF-knockdown) confirmed that all these cell lines express GDNF receptors and RET (n = 3). Quantification of the blots is shown in Supplementary Figure S1 (C). Schematic picture of the co-culture model of Caco2 cells and enteric glia cells. (D). Permeability coefficients (PE) of 4-kDa FITC dextran flux across Caco2 monolayers were significantly reduced 24 h after co-culture with EGC (p < 0.05, n = 16, student’s t-test). Control = Caco2 monolayer without treatment. (E). Immunostaining of the transwell filters showed an augmented and more linear staining pattern of desmosomal protein Desmoglein2 (Dsg2), adherens junction protein E-Cadherin and tight junction protein Claudin1 24 h after co-culture of confluent Caco2 cells with EGC compared to untreated controls (representatives are shown for n = 10, scale = 20 µm). Control = Caco2 monolayer without treatment.
Figure 3
Figure 3
Depletion of glial cell line-derived neurotrophic factor (GDNF) attenuated effects of enteric glial cells (EGC) on enterocytes. (A). Representative Western blot is shown for GDNF with and without depletion of GDNF from EGC supernatants using sepharose beads and GDNF antibodies. Human recombinant GDNF served as a positive control (n = 3). (B). Quantification of the western blot signal showed a significant reduction of GDNF concentration in the cell lysates following the incubation with sepharose beads (n = 3, * = p < 0.05, Kruskal Wallis Test). Control = EGC supernatant. (C). ELISA- based measurements of the GDNF concentration in the supernatant showed a reduction of GDNF to 17 ± 10% after depletion with sepharose beads (n = 6, p < 0.05 Wilcoxon signed-ranked test). (D). Measurements of transepithelial electric resistance (TER) on Caco2 monolayers demonstrated, that the effect of EGC supernatant after depletion of GDNF by sepharose beads was blunted, compared to EGC supernatants without depletion of GDNF (n = 6, * = p < 0.05, two-way ANOVA). Control = Caco2 monolayer without treatment.
Figure 4
Figure 4
Knockdown of glial cell line-derived neurotrophic factor (GDNF) reduced effects of enteric glial cells (EGC) on barrier properties of Caco2 cells. (A). Representative Western blot of cell lysates of EGC to confirm reduced GDNF levels following knockdown of GDNF in EGC (EGCGDNF KD); (n = 10). (B). Representative Western blots of cell culture supernatants from EGCs and EGCGDNF KD to confirm reduced secretion of EGCs into cell culture supernatants; (n = 8). (C). Quantifications of Western blots following knockdown of GDNF showed reduced levels to 45 ± 19% of control EGCs correlated to β-actin; (n = 10, ** = p < 0.01, Wilcoxon signed-ranked test). Control = EGC WT. (D). Quantifications of Western blots from supernatants from EGC supernatants compared to EGCGDNF KD demonstrated reduced GDNF levels of 27 ± 12%; (n = 8, ** = p < 0.01, Wilcoxon signed-ranked test). Control = EGC WT. (E). Measurements of TER revealed that incubation of Caco2 with EGC supernatant significantly increased TER to 330% ± 16% after 24 h whereas incubation with supernatants from EGCGDNF KD resulted in a significantly less pronounced increase of TER to 230% ± 18% (equates to 0.69-fold of EGC supernatants); (n = 10 for each condition, § = p< 0.05 control vs. EGC, # = p < 0.05 EGC vs. EGCGDNF KD, * = p < 0.05 control EGC; two-way ANOVA); Control = Caco2 monolayer without treatment.
Figure 5
Figure 5
Enteric glial cells (EGC)-mediated effects on junctional proteins are glial cell line-derived neurotrophic factor (GDNF) dependent. Representative immunostainings under various conditions are shown. In immature Caco2 cells junctional proteins distribution of desmosomal Desmoglein2 (Dsg2) (a) and tight junction proteins Claudin5 (b), Claudin1 (c) and adherens protein E-Cadherin (d) were not regularly located at the cell borders. Application of recombinant GDNF augmented linear staining of all junctional proteins at the cell borders (eh). Similar effects were observed following incubation with supernatants from EGCs (il). These effects of EGC on enterocytes were absent when cells were incubated with supernatants from EGCGDNF KD (mp) and with EGC supernatant in which GNDF had been depleted (qt); (representatives are shown for n = 6, Scale 20 µm).
Figure 6
Figure 6
Effects of enteric glial cells (EGC) on epithelial barrier function are RET-dependent. (A). Representative Western blots of Caco2 cells are shown. Glial cell line-derived neurotrophic factor (GDNF) increased the ratio of phosphorylated RETY1062 to 131 ± 9%- of controls, while application of Blue667 reduced basal phosphorylation of RET and blocked GDNF-induced RET phosphorylation to 67.5 ± 9% of controls; (n = 8). (B). Quantification of the western blots are shown which demonstrated that GDNF increased RET phosphorylation to 131.1 ± 9% of controls whereas Blue667 reduced RET phosphorylation; (n = 8, Kruskal Wallis Test); Control = Caco2 monolayer without treatment. (C,D). Transepithelial electric resistance (TER) measurements of Caco2 monolayers are shown. The inhibition of the RET by Blue667 blocked the effect of GDNF and of EGC supernatant on intestinal epithelial barrier maturation; (n = 8 for each set of experiments; * p < 0.05; 2-way ANOVA); Control = Caco2 monolayer without treatment.
Figure 7
Figure 7
Tumor necrosis factor α (TNFα) increased the expression and secretion of glial cell line-derived neurotrophic factor (GDNF) in enteric glial cells (EGC). (A). Representative Western blot of EGC cell lysates showing that TNFα and lipopolysaccharide (LPS) but not lipoteichoic acid (LTA) led to increased expression of GDNF, membranes were reprobed for β-actin to ensure equal protein loading; (n = 9). (B). Quantification of all Western blots showed a significantly increased expression of GDNF by TNFα and LPS but not by LTA; (n = 9; * = p < 0.05, Kruskal Wallis Test); Control = Caco2 monolayer without treatment. (C). Representative Western blot of EGC cell culture supernatants is shown which demonstrates increased release of GDNF by TNFα and LTA but not LPS; (n = 9). (D). Quantification of all Western blots showed a significantly increased release of GDNF by TNFα and LTA but not by LPS (n = 9; * = p < 0.05, Kruskal Wallis Test); Control = Caco2 supernatant without treatment. (E). MTT assays served to test for cell viability. Except for incubation with staurosporine EGC cell viability was not changed for the different experimental conditions (n = 10; * = p < 0.05 control, TNFα, LPS, LTA vs. Strauosporine; Kruskal Wallis Test); Control = Caco2 monolayer without treatment.
Figure 8
Figure 8
Barrier protective effects by enteric glial cells (EGC) in inflammation are glial cell line-derived neurotrophic factor (GDNF)-dependent. (A). Permeability coefficients (PE) of 4-kDa FITC dextran flux across Caco2 monolayers was increased following the application of Tumor necrosis factor α (TNFα) to 1.78 ± 0.10 × 10⁻⁶ compared to 1.32 ± 0.08 × 10⁻⁶. This was blocked under co-culture conditions together with EGC cells. Protective effects of the co-culture were diminished by Blue667 when PE was 1.67 ± 0.06 × 10⁻⁶ (n = 9; * = p < 0.05; One-way ANOVA). Control = Caco2 monolayer without treatment. (B). In PE measurements barrier protection of EGCs after TNFα incubation were absent when co-cultures were performed with EGCGDNF KD (n = 9; * = p < 0.05; One-way ANOVA). (C). Representative immunostaining for junctional proteins Dsg2, E-Cadherin, Claudin1 and 5 are shown. TNFα reduced the staining pattern of these junctional proteins at the cell borders of Caco2 cells. This effect was attenuated when Caco2 cells were cultivated with EGC supernatants. The beneficial effects of EGC supernatants were blocked by RET Inhibitor Blue667; arrowheads point to examples of reduced or lost staining patterns at the cell borders (representatives are shown for n = 6, Scale 20 µm); Control = Caco2 monolayer without treatment.
Figure 9
Figure 9
Effects of enteric glial cells (EGC) on organoids after the inflammation-induced breakdown of the intestinal barrier are dependent on RET-mediated pathways. (A): Representative images of organoids 1 h after incubation with 4 kDa FITC-Dextran are shown. Compared to controls (a) Tumor necrosis factor α (TNFα) increased the fluorescence inside the organoids (b), while simultaneous application of recombinant glial cell line-derived neurotrophic factor (GDNF) (c) or EGC supernatants attenuated (e) this inflammation-induced breakdown of the intestinal epithelial barrier, while RET inhibitor Blue667 blocked the effects of GDNF and EGC on organoid permeability (d,f). (representative figures are shown for n = 7, scale 120 µm); control = organoids without treatment. (B): Permeability in organoids was quantified by the quotient of the fluorescence in the organoid lumen and outside of the organoid. These measurements revealed an inflammation-induced increase to 1.94 ± 0.09-fold of controls. Incubation with GDNF or EGC supernatants reduced the effects of TNFα and the permeability quotient was reduced to 1.11 ± 0.08-fold of controls. This protective effect of EGC supernatants was blunted by concurrent application of Blue667, where the permeability quotient increased again to 2.04 ± 0.07-fold of controls (n = 7; * = p < 0.05; One-way ANOVA); control = organoids without treatment. (C): Representative immunostaining for junctional proteins Desmoglein2 (Dsg2), E-Cadherin, Claudin1 and 5 are shown. TNFα reduced the staining pattern of the tight junction proteins Claudin1 and 5 as well as the staining of Dsg2 at the cell borders (b,h,n,t). This effect was attenuated when organoid cells were cultivated with recombinant GDNF and EGC supernatants (c,i,o,u and e,k,q,w). The beneficial effects of EGC supernatants were blocked by RET Inhibitor Blue667 (d,j,p,v and f,l,r,x) (representatives are shown for n = 6, Scale bar = 80 µm); control = organoids without treatment (a,g,m,s).

Similar articles

Cited by

References

    1. Luissint A.C., Parkos C.A., Nusrat A. Inflammation and the Intestinal Barrier: Leukocyte-Epithelial Cell Interactions, Cell Junction Remodeling, and Mucosal Repair. Gastroenterology. 2016;151:616–632. doi: 10.1053/j.gastro.2016.07.008. - DOI - PMC - PubMed
    1. Bischoff S.C., Barbara G., Buurman W., Ockhuizen T., Schulzke J.D., Serino M., Tilg H., Watson A., Wells J.M. Intestinal permeability—A new target for disease prevention and therapy. BMC Gastroenterol. 2014;14:189. doi: 10.1186/s12876-014-0189-7. - DOI - PMC - PubMed
    1. Schlegel N., Boerner K., Waschke J. Targeting desmosomal adhesion and signalling for intestinal barrier stabilization in inflammatory bowel diseases-Lessons from experimental models and patients. Acta Physiol. 2021;231:e13492. doi: 10.1111/apha.13492. - DOI - PubMed
    1. Martini E., Krug S.M., Siegmund B., Neurath M.F., Becker C. Mend Your Fences: The Epithelial Barrier and its Relationship with Mucosal Immunity in Inflammatory Bowel Disease. Cell Mol. Gastroenterol. Hepatol. 2017;4:33–46. doi: 10.1016/j.jcmgh.2017.03.007. - DOI - PMC - PubMed
    1. Neunlist M., Toumi F., Oreschkova T., Denis M., Leborgne J., Laboisse C.L., Galmiche J.P., Jarry A. Human ENS regulates the intestinal epithelial barrier permeability and a tight junction-associated protein ZO-1 via VIPergic pathways. Am. J. Physiol. Gastrointest. Liver Physiol. 2003;285:G1028–G1036. doi: 10.1152/ajpgi.00066.2003. - DOI - PubMed

MeSH terms

Substances