

AKT3 Expression in Mesenchymal Colorectal Cancer Cells Drives Growth and Is Associated with Epithelial-Mesenchymal Transition
- PMID: 33673003
- PMCID: PMC7918753
- DOI: 10.3390/cancers13040801
AKT3 Expression in Mesenchymal Colorectal Cancer Cells Drives Growth and Is Associated with Epithelial-Mesenchymal Transition
Abstract
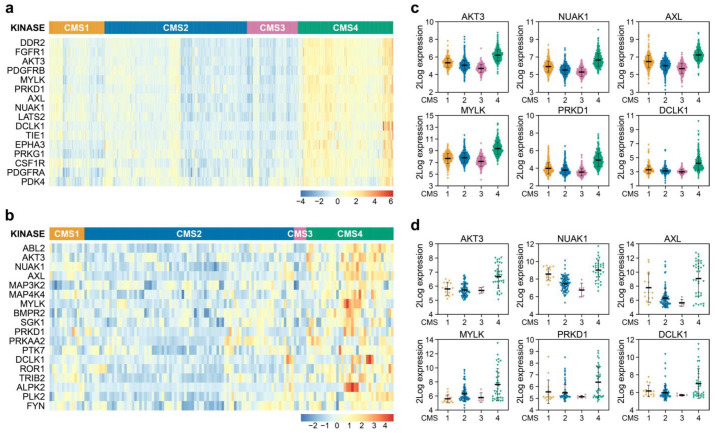
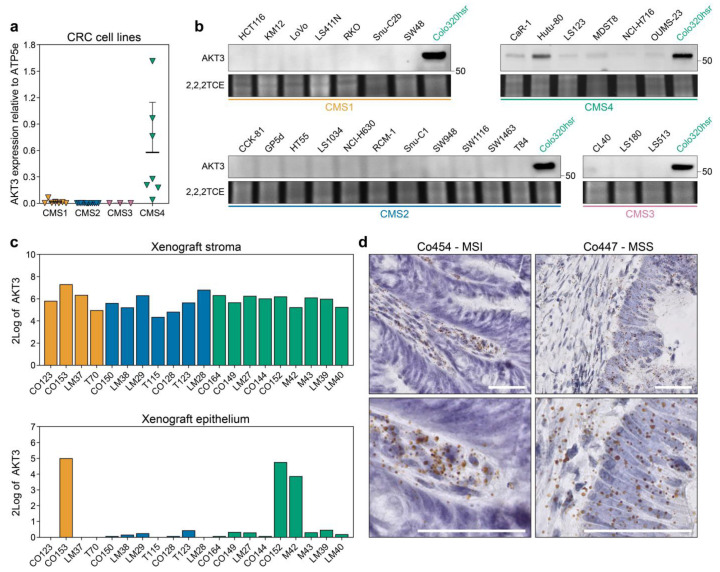
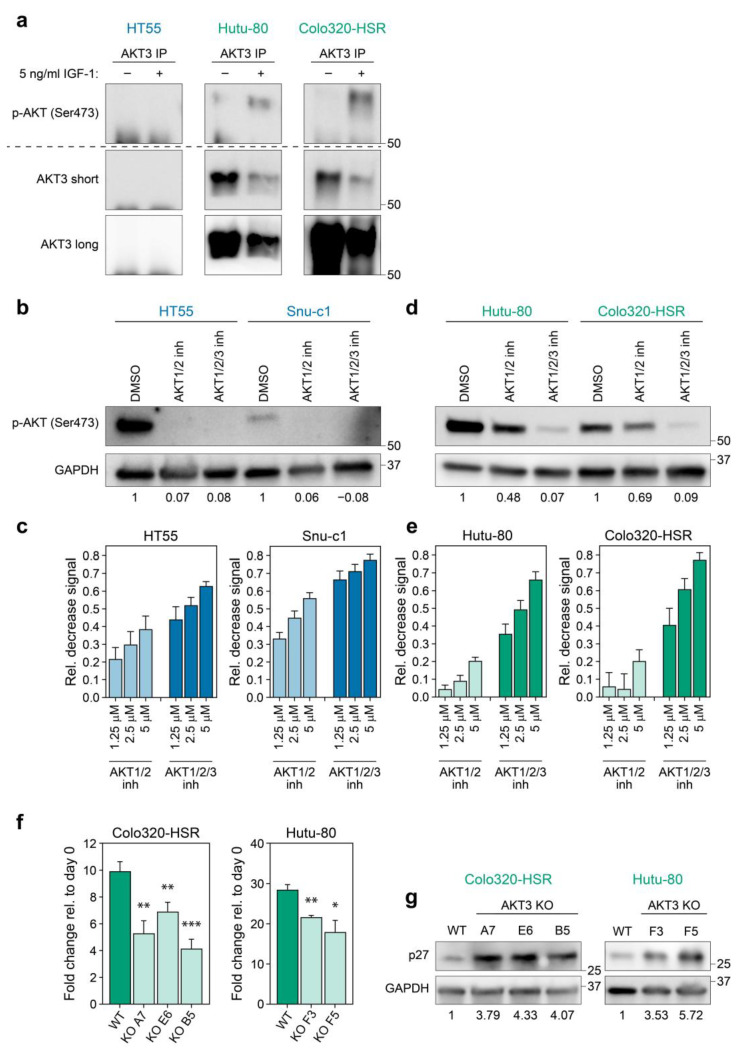
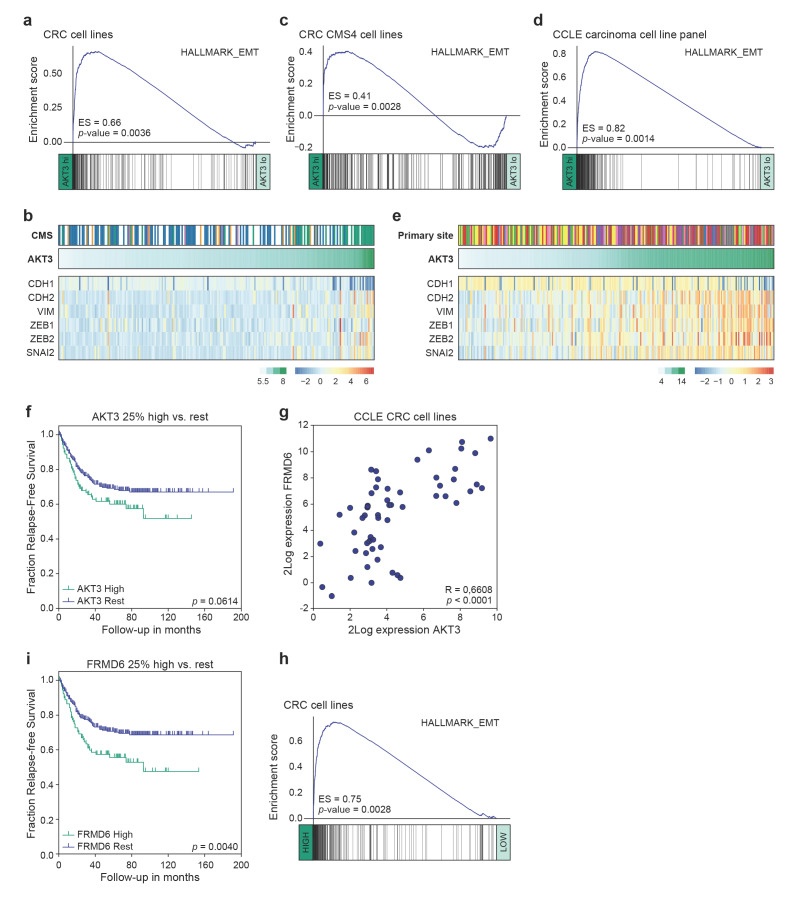
Colorectal cancer (CRC) is a heterogeneous disease that can currently be subdivided into four distinct consensus molecular subtypes (CMS) based on gene expression profiling. The CMS4 subtype is marked by high expression of mesenchymal genes and is associated with a worse overall prognosis compared to other CMSs. Importantly, this subtype responds poorly to the standard therapies currently used to treat CRC. We set out to explore what regulatory signalling networks underlie the CMS4 phenotype of cancer cells, specifically, by analysing which kinases were more highly expressed in this subtype compared to others. We found AKT3 to be expressed in the cancer cell epithelium of CRC specimens, patient derived xenograft (PDX) models and in (primary) cell cultures representing CMS4. Importantly, chemical inhibition or knockout of this gene hampers outgrowth of this subtype, as AKT3 controls expression of the cell cycle regulator p27KIP1. Furthermore, high AKT3 expression was associated with high expression of epithelial-mesenchymal transition (EMT) genes, and this observation could be expanded to cell lines representing other carcinoma types. More importantly, this association allowed for the identification of CRC patients with a high propensity to metastasise and an associated poor prognosis. High AKT3 expression in the tumour epithelial compartment may thus be used as a surrogate marker for EMT and may allow for a selection of CRC patients that could benefit from AKT3-targeted therapy.
Keywords: AKT3; CMS; growth; mesenchymal CRC.
Conflict of interest statement
The authors declare no conflict of interest.
Figures
Similar articles
-
A multidimensional network approach reveals microRNAs as determinants of the mesenchymal colorectal cancer subtype.Oncogene. 2016 Nov 17;35(46):6026-6037. doi: 10.1038/onc.2016.134. Epub 2016 May 9. Oncogene. 2016. PMID: 27157610 Free PMC article.
-
Subtype-specific kinase dependency regulates growth and metastasis of poor-prognosis mesenchymal colorectal cancer.J Exp Clin Cancer Res. 2023 Mar 3;42(1):56. doi: 10.1186/s13046-023-02600-9. J Exp Clin Cancer Res. 2023. PMID: 36869386 Free PMC article.
-
Downregulation of mitochondrial complex I induces ROS production in colorectal cancer subtypes that differently controls migration.J Transl Med. 2023 Aug 3;21(1):522. doi: 10.1186/s12967-023-04341-x. J Transl Med. 2023. PMID: 37533102 Free PMC article.
-
Investigation of colorectal cancer in accordance with consensus molecular subtype classification.Ann Gastroenterol Surg. 2020 Jul 21;4(5):528-539. doi: 10.1002/ags3.12362. eCollection 2020 Sep. Ann Gastroenterol Surg. 2020. PMID: 33005848 Free PMC article. Review.
-
Consensus molecular subtypes of colorectal cancer in clinical practice: A translational approach.World J Clin Oncol. 2021 Nov 24;12(11):1000-1008. doi: 10.5306/wjco.v12.i11.1000. World J Clin Oncol. 2021. PMID: 34909395 Free PMC article. Review.
Cited by
-
Down-regulation of AKT proteins slows the growth of mutant-KRAS pancreatic tumors.bioRxiv [Preprint]. 2024 May 5:2024.05.03.592345. doi: 10.1101/2024.05.03.592345. bioRxiv. 2024. Update in: Cells. 2024 Jun 19;13(12):1061. doi: 10.3390/cells13121061. PMID: 38746217 Free PMC article. Updated. Preprint.
-
Enterocyte-like differentiation defines metabolic gene signatures of CMS3 colorectal cancers and provides therapeutic vulnerability.Nat Commun. 2025 Jan 2;16(1):264. doi: 10.1038/s41467-024-55574-3. Nat Commun. 2025. PMID: 39747069 Free PMC article.
-
A novel anoikis-related risk model predicts prognosis in patients with colorectal cancer and responses to different immunotherapy strategies.J Cancer Res Clin Oncol. 2023 Sep;149(12):10879-10892. doi: 10.1007/s00432-023-04945-2. Epub 2023 Jun 15. J Cancer Res Clin Oncol. 2023. PMID: 37318595 Free PMC article.
-
NR2F1-AS1/miR-190a/PHLDB2 Induces the Epithelial-Mesenchymal Transformation Process in Gastric Cancer by Promoting Phosphorylation of AKT3.Front Cell Dev Biol. 2021 Oct 22;9:688949. doi: 10.3389/fcell.2021.688949. eCollection 2021. Front Cell Dev Biol. 2021. Retraction in: Front Cell Dev Biol. 2024 Sep 11;12:1491753. doi: 10.3389/fcell.2024.1491753. PMID: 34746118 Free PMC article. Retracted.
-
E-Cadherin-Deficient Cells Are Sensitive to the Multikinase Inhibitor Dasatinib.Cancers (Basel). 2022 Mar 22;14(7):1609. doi: 10.3390/cancers14071609. Cancers (Basel). 2022. PMID: 35406381 Free PMC article.
References
-
- Schlicker A., Beran G., Chresta C.M., McWalter G., Pritchard A., Weston S., Runswick S., Davenport S., Heathcote K., Castro D.A., et al. Subtypes of primary colorectal tumors correlate with response to targeted treatment in colorectal cell lines. BMC Med. Genom. 2012;5:66. doi: 10.1186/1755-8794-5-66. - DOI - PMC - PubMed
-
- de Sousa e Melo F., Wang X., Jansen M., Fessler E., Trinh A., de Rooij L.P., de Jong J.H., de Boer O.J., van Leersum R., Bijlsma M.F., et al. Poor-prognosis colon cancer is defined by a molecularly distinct subtype and develops from serrated precursor lesions. Nat. Med. 2013;19:614–618. doi: 10.1038/nm.3174. - DOI - PubMed
Grants and funding
LinkOut - more resources
Full Text Sources
Other Literature Sources
Medical
Miscellaneous
