. 2021 Feb 12;26(4):970.
doi: 10.3390/molecules26040970.

On the Protein Fibrillation Pathway: Oligomer Intermediates Detection Using ATR-FTIR Spectroscopy

Affiliations

On the Protein Fibrillation Pathway: Oligomer Intermediates Detection Using ATR-FTIR Spectroscopy

Jelica Milošević et al. Molecules. .

Abstract

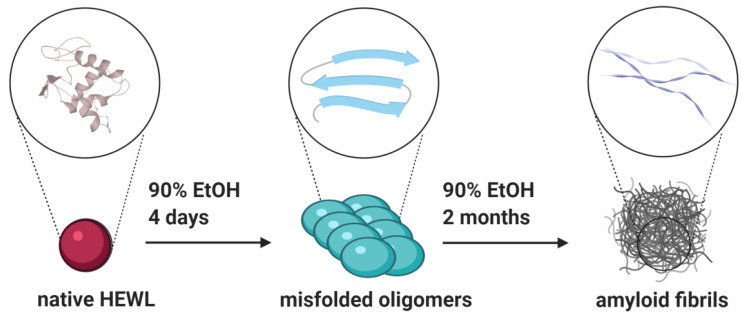
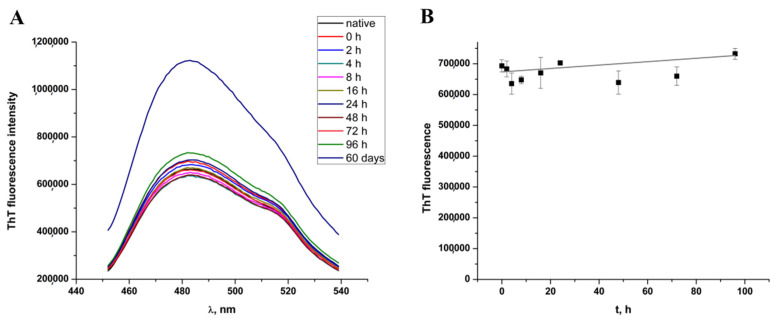
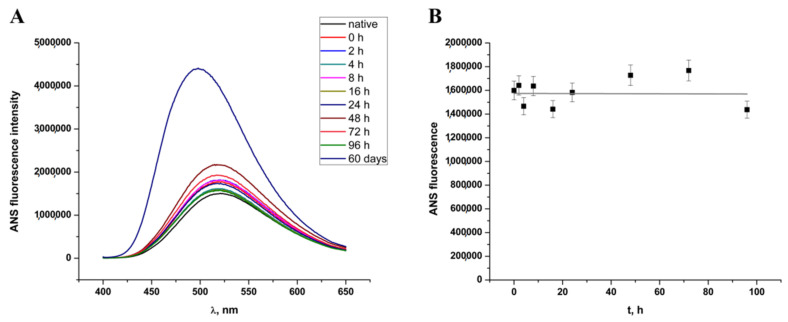
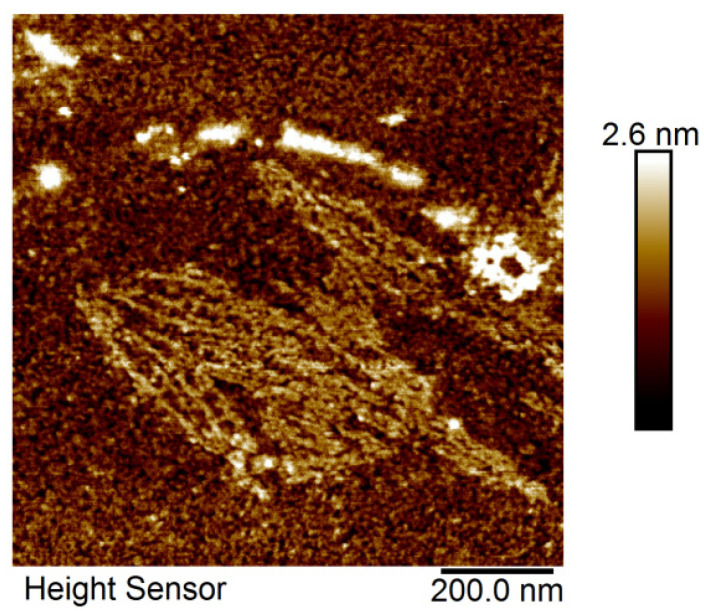
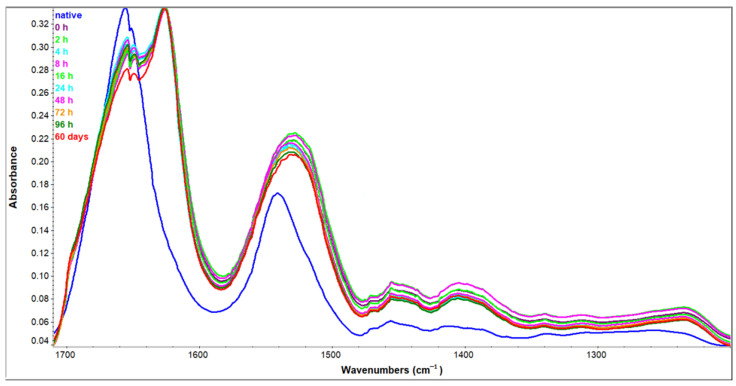
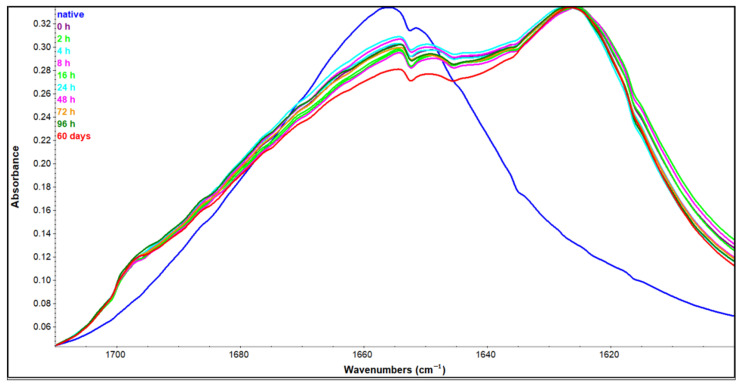
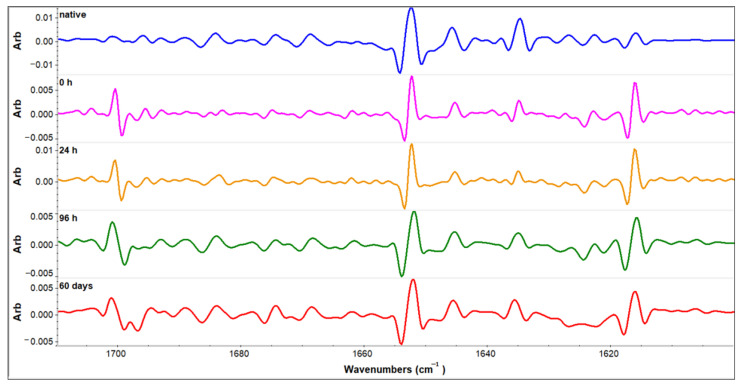
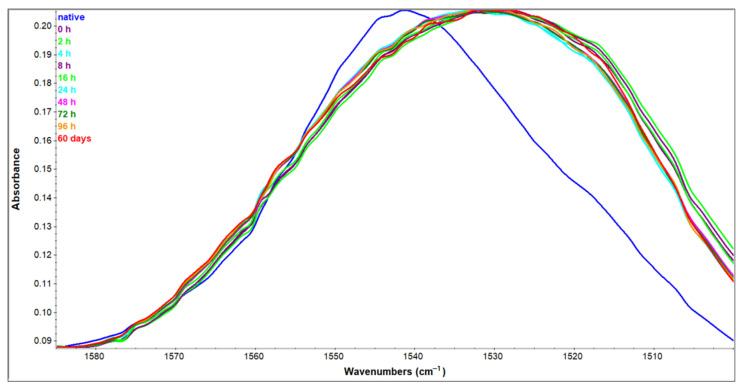
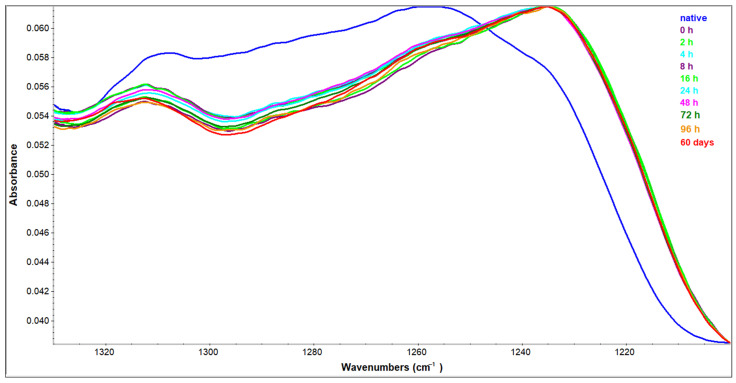
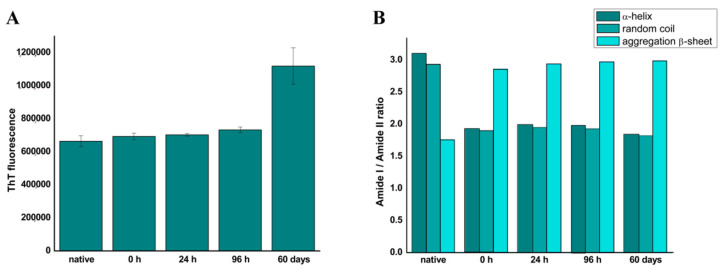
Oligomeric intermediates on the pathway of amyloid fibrillation are suspected as the main cytotoxins responsible for amyloid-related pathogenicity. As they appear to be a part of the lag phase of amyloid fibrillation when analyzed using standard methods such as Thioflavin T (ThT) fluorescence, a more sensitive method is needed for their detection. Here we apply Fourier transform infrared spectroscopy (FTIR) in attenuated total reflectance (ATR) mode for fast and cheap analysis of destabilized hen-egg-white lysozyme solution and detection of oligomer intermediates of amyloid fibrillation. Standard methods of protein aggregation analysis- Thioflavin T (ThT) fluorescence, atomic force microscopy (AFM), and 8-anilinonaphthalene-1-sulphonic acid (ANS) fluorescence were applied and compared to FTIR spectroscopy data. Results show the great potential of FTIR for both, qualitative and quantitative monitoring of oligomer formation based on the secondary structure changes. While oligomer intermediates do not induce significant changes in ThT fluorescence, their secondary structure changes were very prominent. Normalization of specific Amide I region peak intensities by using Amide II peak intensity as an internal standard provides an opportunity to use FTIR spectroscopy for both qualitative and quantitative analysis of biological samples and detection of potentially toxic oligomers, as well as for screening of efficiency of fibrillation procedures.

Keywords: ATR FTIR; HEWL; amyloid fibrillation; oligomer intermediates; secondary structure perturbation.


Conflict of interest statement

The authors declare no conflict of interest.

Figures

Scheme 1
Scheme 1
Schematic representation of hen egg-white lysozyme (HEWL) fibrillation in 90% ethanol solution.
Figure 1
Figure 1
(A) Thioflavin T (ThT) fluorescence spectra during four day’s HEWL incubation in 90% ethanol and after a 60-day incubation period. (B) Time-dependent change of ThT fluorescence over four days’ incubation of HEWL in 90% ethanol solution.
Figure 2
Figure 2
(A) 8-anilinonaphthalene-1-sulphonic acid (ANS) fluorescence spectra during four days’ HEWL incubation in 90% ethanol and after a 60-day incubation period. (B) Time-dependent change of ANS fluorescence during four days’ incubation of HEWL in 90% ethanol solution.
Figure 3
Figure 3
AFM microscopy of HEWL oligomer intermediates.
Figure 4
Figure 4
Amide I—Amide III regions of HEWL ATR-FTIR spectra. Native—HEWL in H2O, 0 h–60 days—HEWL samples incubated in 90% C2H5OH for the time period indicated.
Figure 5
Figure 5
Amide I region of native HEWL sample in H2O solution and HEWL samples incubated in 90% C2H5OH for the time period indicated.
Figure 6
Figure 6
Second derivative spectra of native HEWL sample in H2O solution and HEWL samples incubated in 90% C2H5OH for the time period indicated.
Figure 7
Figure 7
Amide II region of HEWL native sample in H2O solution and HEWL samples incubated in 90% C2H5OH for the time period indicated.
Figure 8
Figure 8
Amide III region of HEWL native sample in H2O solution and HEWL samples incubated in 90% C2H5OH for the time period indicated.
Figure 9
Figure 9
(A) ThT fluorescence and (B) Amide I/Amide II ratio for native, 0 h-, 24 h-, 96 h-, and 60-day-incubated HEWL sample in 90% ethanol. Bands were attributed to the secondary structures as follows: 1654 cm1 to the α-helix, 1644 cm1 to the random coil, 1620 cm1, and 1698 cm−1 to the aggregation-specific β-sheet, 1542 and 1534 cm−1 to the Amide II internal standards.

Similar articles

Cited by

References

    1. Arosio P., Knowles T.P., Linse S. On the lag phase in amyloid fibril formation. Phys. Chem. Chem Phys. PCCP. 2015;17:7606–7618. doi: 10.1039/C4CP05563B. - DOI - PMC - PubMed
    1. Breydo L., Uversky V.N. Molecular Mechanisms of Protein Misfolding. In: Vladimir Uversky V.N., Lyubchenko Y.L., editors. Bio-Nanoimaging: Protein Misfolding and Aggregation. 1st ed. Academic Press; Cambridge, MA, USA: 2014. pp. 1–14.
    1. Knowles T.P., Vendruscolo M., Dobson C.M. The amyloid state and its association with protein misfolding diseases. Nat. Rev. Mol. Cell Biol. 2014;15:384–396. doi: 10.1038/nrm3810. - DOI - PubMed
    1. Urbic T., Najem S., Dias C.L. Thermodynamic properties of amyloid fibrils in equilibrium. Biophys. Chem. 2017;231:155–160. doi: 10.1016/j.bpc.2017.03.001. - DOI - PMC - PubMed
    1. Kodali R., Wetzel R. Polymorphism in the intermediates and products of amyloid assembly. Curr. Opin. Struct. Biol. 2007;17:48–57. doi: 10.1016/j.sbi.2007.01.007. - DOI - PubMed

LinkOut - more resources