

SARS-CoV-2 Subgenomic N (sgN) Transcripts in Oro-Nasopharyngeal Swabs Correlate with the Highest Viral Load, as Evaluated by Five Different Molecular Methods
- PMID: 33673182
- PMCID: PMC7923082
- DOI: 10.3390/diagnostics11020288
SARS-CoV-2 Subgenomic N (sgN) Transcripts in Oro-Nasopharyngeal Swabs Correlate with the Highest Viral Load, as Evaluated by Five Different Molecular Methods
Abstract
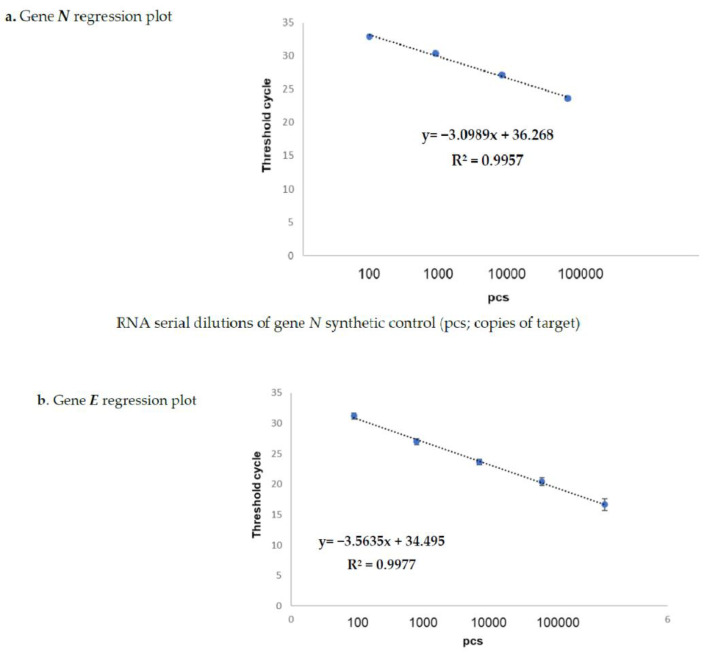
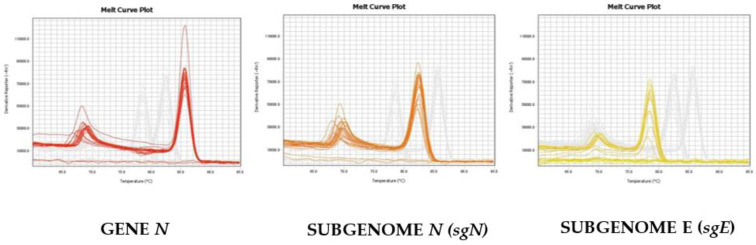
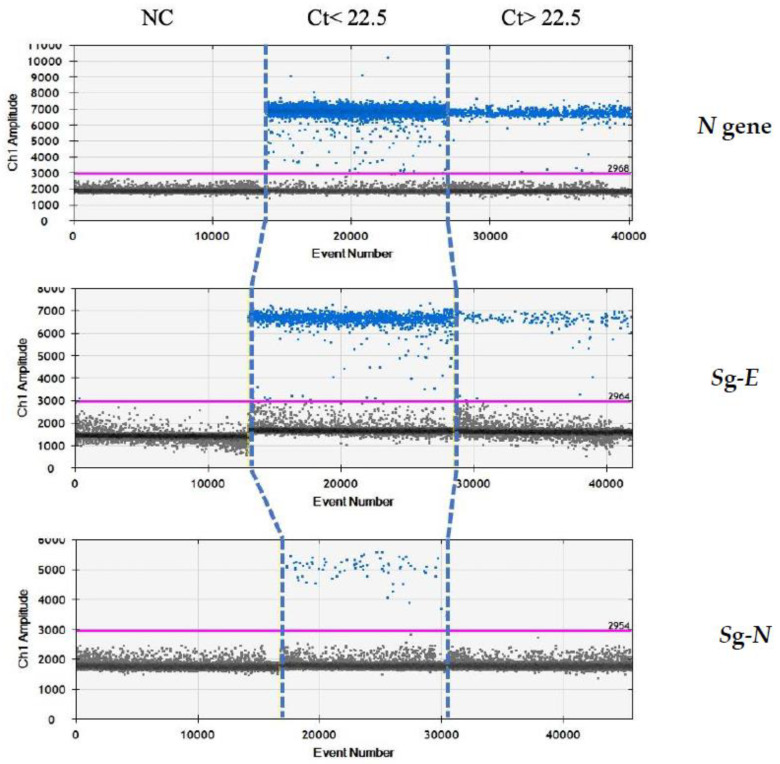
The COVID-19 pandemic has forced diagnostic laboratories to focus on the early diagnostics of SARS-CoV-2. The positivity of a molecular test cannot respond to the question regarding the viral capability to replicate, spread, and give different clinical effects. Despite the fact that some targets are covered by commercially-available assays, the identification of new biomarkers is desired in order to improve the quality of the information given by these assays. Therefore, since the subgenomic transcripts (sgN and sgE) are considered markers of viral activity, we evaluated these subgenomic transcripts in relation to the genomic amplification obtained using five different commercial CE-IVD tools. Methods: Five CE-IVD kits were compared in terms of their capability to detect both synthetic SARS-CoV-2 viral constructs (spiked in TMB or PBS medium) and targets (N, E, RdRp and Orf1ab genes) in twenty COVID-19-positive patients' swabs. The sgN and sgE were assayed by real-time RT-qPCR and digital PCR. Results: None of the diagnostic kits missed the viral target genes when they were applied to targets spiked in TMB or PBS (at dilutions ranging from 100 pg to 0.1 pg). Nevertheless, once they were applied to RNA extracted from the patients' swabs, the superimposability ranged from 50% to 100%, regardless of the extraction procedure. The sgN RNA transcript was detected only in samples with a higher viral load (Ct ≤ 22.5), while sgE was within all of the Ct ranges. Conclusions: The five kits show variable performances depending on the assay layout. It is worthy of note that the detection of the sgN transcript is associated with a higher viral load, thus representing a new marker of early and more severe infection.
Keywords: CE-IVD; SARS-CoV-2 subgenomic regions; viral load.
Conflict of interest statement
The authors declare no conflict of interest.
Figures
Similar articles
-
Loss of Detection of sgN Precedes Viral Abridged Replication in COVID-19-Affected Patients-A Target for SARS-CoV-2 Propagation.Int J Mol Sci. 2022 Feb 9;23(4):1941. doi: 10.3390/ijms23041941. Int J Mol Sci. 2022. PMID: 35216056 Free PMC article.
-
Severe Acute Respiratory Syndrome Coronavirus 2 Total and Subgenomic RNA Viral Load in Hospitalized Patients.J Infect Dis. 2021 Oct 28;224(8):1287-1293. doi: 10.1093/infdis/jiab215. J Infect Dis. 2021. PMID: 33870434 Free PMC article.
-
Total and Subgenomic RNA Viral Load in Patients Infected With SARS-CoV-2 Alpha, Delta, and Omicron Variants.J Infect Dis. 2023 Aug 11;228(3):235-244. doi: 10.1093/infdis/jiad061. J Infect Dis. 2023. PMID: 36883903 Free PMC article.
-
SARS-CoV-2 Total and Subgenomic RNA Viral Load in Hospitalized Patients.medRxiv [Preprint]. 2021 Mar 1:2021.02.25.21252493. doi: 10.1101/2021.02.25.21252493. medRxiv. 2021. Update in: J Infect Dis. 2021 Oct 28;224(8):1287-1293. doi: 10.1093/infdis/jiab215. PMID: 33688671 Free PMC article. Updated. Preprint.
-
[Establishment and preliminary application of quantitative real-time PCR assay for the detection of SARS-CoV-2 subgenomic nucleocapsid RNA].Zhonghua Yu Fang Yi Xue Za Zhi. 2023 Feb 6;57(2):268-272. doi: 10.3760/cma.j.cn112150-20220407-00331. Zhonghua Yu Fang Yi Xue Za Zhi. 2023. PMID: 36797587 Chinese.
Cited by
-
Further Findings Concerning Endothelial Damage in COVID-19 Patients.Biomolecules. 2021 Sep 16;11(9):1368. doi: 10.3390/biom11091368. Biomolecules. 2021. PMID: 34572581 Free PMC article.
-
Targeting ATP2B1 impairs PI3K/Akt/FOXO signaling and reduces SARS-COV-2 infection and replication.EMBO Rep. 2024 Jul;25(7):2974-3007. doi: 10.1038/s44319-024-00164-z. Epub 2024 May 30. EMBO Rep. 2024. PMID: 38816514 Free PMC article.
-
SARS-CoV-2 Pandemic Tracing in Italy Highlights Lineages with Mutational Burden in Growing Subsets.Int J Mol Sci. 2022 Apr 9;23(8):4155. doi: 10.3390/ijms23084155. Int J Mol Sci. 2022. PMID: 35456974 Free PMC article.
-
Identification of SARS-CoV-2 Proteins from Nasopharyngeal Swabs Probed by Multiple Reaction Monitoring Tandem Mass Spectrometry.ACS Omega. 2021 Dec 7;6(50):34945-34953. doi: 10.1021/acsomega.1c05587. eCollection 2021 Dec 21. ACS Omega. 2021. PMID: 34926968 Free PMC article.
-
SARS-CoV-2 Within-Host and in vitro Genomic Variability and Sub-Genomic RNA Levels Indicate Differences in Viral Expression Between Clinical Cohorts and in vitro Culture.Front Microbiol. 2022 May 19;13:824217. doi: 10.3389/fmicb.2022.824217. eCollection 2022. Front Microbiol. 2022. PMID: 35663867 Free PMC article.
References
Grants and funding
LinkOut - more resources
Full Text Sources
Other Literature Sources
Research Materials
Miscellaneous
