. 2021 Feb 12;22(4):1839.
doi: 10.3390/ijms22041839.

B Cells with a Senescent-Associated Secretory Phenotype Accumulate in the Adipose Tissue of Individuals with Obesity

Affiliations

B Cells with a Senescent-Associated Secretory Phenotype Accumulate in the Adipose Tissue of Individuals with Obesity

Daniela Frasca et al. Int J Mol Sci. .

Abstract

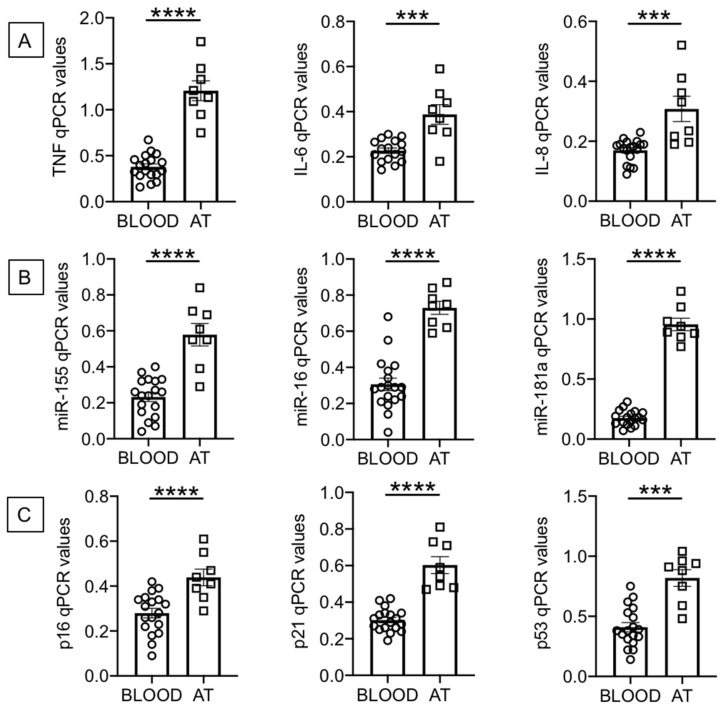
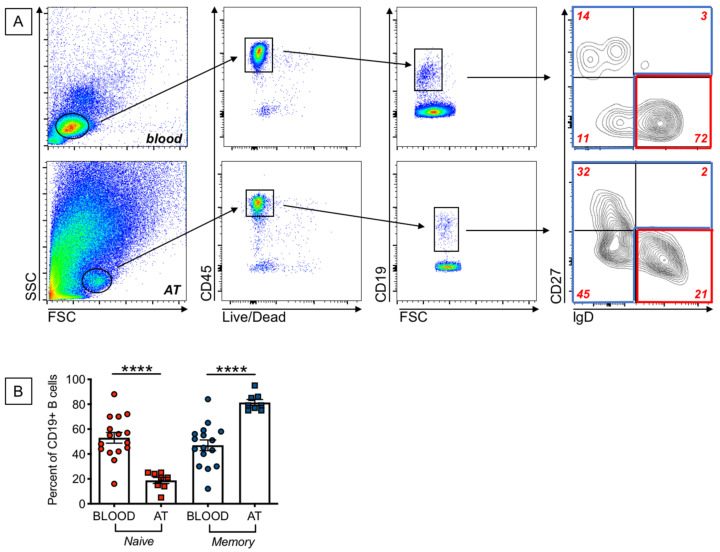
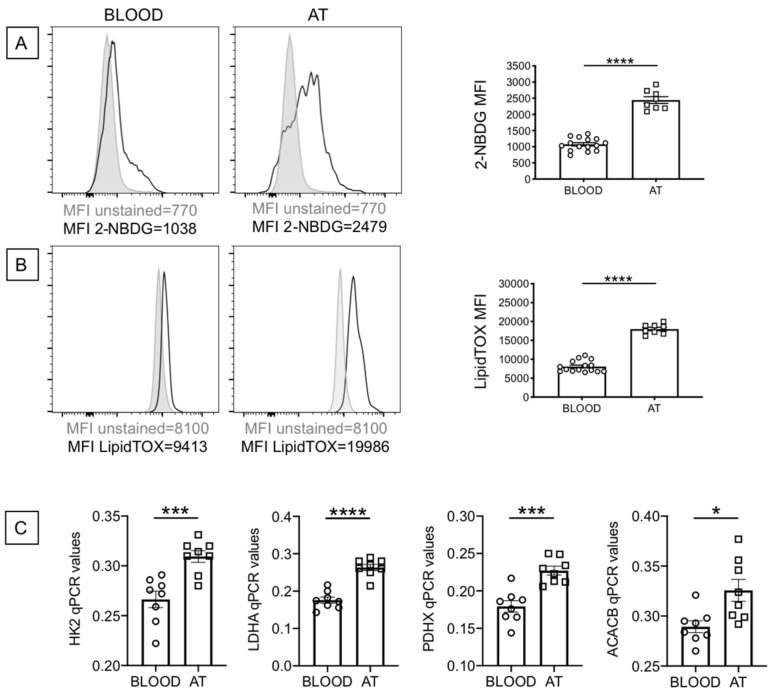
Senescent cells accumulate in the adipose tissue (AT) of individuals with obesity and secrete multiple factors that constitute the senescence-associated secretory phenotype (SASP). This paper aimed at the identification of B cells with a SASP phenotype in the AT, as compared to the peripheral blood, of individuals with obesity. Our results show increased expression of SASP markers in AT versus blood B cells, a phenotype associated with a hyper-metabolic profile necessary to support the increased immune activation of AT-derived B cells as compared to blood-derived B cells. This hyper-metabolic profile is needed for the secretion of the pro-inflammatory mediators (cytokines, chemokines, micro-RNAs) that fuel local and systemic inflammation.

Keywords: B cells; inflammation; obesity; senescence.


Conflict of interest statement

The authors declare no conflict of interest. The funders had no role in the design of the study; in the collection, analyses, or interpretation of data; in the writing of the manuscript, or in the decision to publish the results.

Figures

Figure 1
Figure 1
Increased expression of senescence-associated secretory phenotype (SASP) markers in B cells from the adipose tissue (AT), as compared to those from the peripheral blood, of individuals with obesity. B cells isolated from peripheral blood mononuclear cells (PBMC) and stromal vascular fraction (SVF) were resuspended in TRIzol, then the RNA was extracted and the expression of SASP markers detected by qPCR to evaluate expression of RNA for pro-inflammatory cytokines and chemokines (A), pro-inflammatory miRs (B), and cell cycle regulators p16INK4, p21CIP1/WAF1 and p53 (C). qPCR values are measures of RNA expression of target genes, relative to the housekeeping genes GAPDH or U6 (for miRs quantification), calculated as 2−ΔCts. Mean comparisons between groups were performed by unpaired Student’s t test (two-tailed). *** p < 0.001, **** p < 0.0001.
Figure 2
Figure 2
Increased frequencies of memory B cells, and decreased frequencies of naïve B cells, in the AT, as compared to the peripheral blood, of individuals with obesity. (A). Gating strategies and a representative dot plot from PBMC (top) and SVF (bottom) to show naïve and memory B cell subsets. (B). Frequencies of naïve and the memory B cell subsets that include IgM memory, switched memory and DN memory B cells. Mean comparisons between groups were performed by Student’s t test (two-tailed). **** p < 0.0001.
Figure 3
Figure 3
B cells from the AT of individuals with obesity are highly metabolic as compared to those from the peripheral blood. (A) Glucose uptake was measured by flow cytometry and the glucose fluorescent analog 2-NBDG.Results show the MFI (mean fluorescence intensity) profile of one representative blood donor and one representative AT donor (left 2 panels) and data from all donors (right). (B) Lipid uptake was measured by flow cytometry and the Deep Red Neutral Lipid Stain LipidTOX. Results show the MFI profile of one representative blood donor and one representative AT donor (left 2 panels) and data from all donors (right). (C) The mRNA was extracted and qPCR performed to evaluate expression of HK2, LDHA, PDHX and ACACB. qPCR values are measures of RNA expression of target genes, relative to the housekeeping gene GAPDH, calculated as 2−ΔCts. Mean comparisons between groups were performed by Student’s t test (two-tailed). * p < 0.05, *** p < 0.001, **** p < 0.0001.

References

    1. Childs B.G., Durik M., Baker D.J., Van Deursen J.M. Cellular Senescence in Aging and Age-Related Disease: From Mechanisms to Therapy. Nat. Med. 2015;21:1424–1435. doi: 10.1038/nm.4000. - DOI - PMC - PubMed
    1. Van Deursen J.M. The Role of Senescent Cells in Ageing. Nat. Cell Biol. 2014;509:439–446. doi: 10.1038/nature13193. - DOI - PMC - PubMed
    1. Campisi J. Cellular Senescence: Putting the Paradoxes in Perspective. Curr. Opin. Genet. Dev. 2011;21:107–112. doi: 10.1016/j.gde.2010.10.005. - DOI - PMC - PubMed
    1. Sikora E., Arendt T., Bennett M., Narita M. Impact of Cellular Senescence Signature on Ageing Research. Ageing Res. Rev. 2011;10:146–152. doi: 10.1016/j.arr.2010.10.002. - DOI - PubMed
    1. Campisi J. Cellular Senescence and Apoptosis: How Cellular Responses Might Influence Aging Phenotypes. Exp. Gerontol. 2003;38:5–11. doi: 10.1016/S0531-5565(02)00152-3. - DOI - PubMed

LinkOut - more resources