. 2021 Feb 12;11(2):231.
doi: 10.3390/brainsci11020231.

Infant Eye Gaze While Viewing Dynamic Faces

Affiliations

Infant Eye Gaze While Viewing Dynamic Faces

Lisa M Oakes et al. Brain Sci. .

Abstract

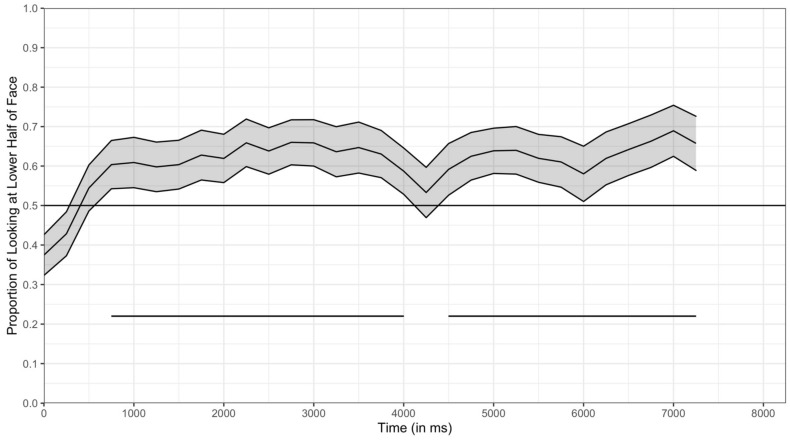
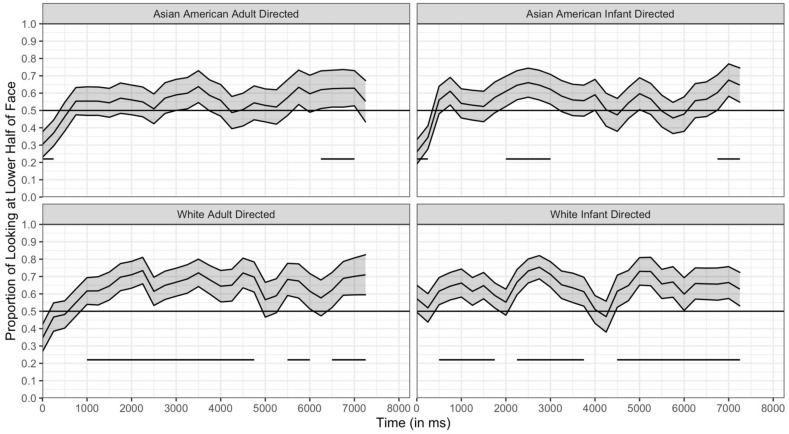
Research using eye tracking methods has revealed that when viewing faces, between 6 to 10 months of age, infants begin to shift visual attention from the eye region to the mouth region. Moreover, this shift varies with stimulus characteristics and infants' experience with faces and languages. The current study examined the eye movements of a racially diverse sample of 98 infants between 7.5 and 10.5 months of age as they viewed movies of White and Asian American women reciting a nursery rhyme (the auditory component of the movies was replaced with music to eliminate the influence of the speech on infants' looking behavior). Using an analytic approach inspired by the multiverse analysis approach, several measures from infants' eye gaze were examined to identify patterns that were robust across different analyses. Although in general infants preferred the lower regions of the faces, i.e., the region containing the mouth, this preference depended on the stimulus characteristics and was stronger for infants whose typical experience included faces of more races and for infants who were exposed to multiple languages. These results show how we can leverage the richness of eye tracking data with infants to add to our understanding of the factors that influence infants' visual exploration of faces.

Keywords: eye movements; eye tracking; face processing; face race; infancy.


Conflict of interest statement

The authors declare no conflict of interest.

Figures

Figure 1
Figure 1
Screenshots from four of the stimulus movies used in this study. On the top row, the women are using infant-directed speech, and on the bottom row the women are using adult-directed speech. The women on the left are Asian American, and the women on the right are White.
Figure 2
Figure 2
Examples of our dynamic AOIs for two of our stimuli. Note that the AOIs move with the face, so they capture the same region of the face even as the face moves.
Figure 3
Figure 3
Mean preference for the lower half of the face for each stimulus type, collapsed across all infants. The line bisecting the graph at 0.50 represents chance, or equal looking at the upper and lower regions. Each open circle represents the score for an individual infant. Error bars represent 95% confidence intervals. The biological sex of each infant is indicated by the shape of the point.
Figure 4
Figure 4
Duration of (A) looking summed across fixations within a trial and (B) for each individual fixation on each trial to the upper and lower halves, averaged across infants and trial types. Each open circle is the duration on a single trial from a single infant (A) or a single fixation on a single trial from a single infant (B). The lines represent the estimated marginal means for each of the three models, and the error bars represent 95% Sidak-adjusted confidence intervals calculated from the models. Note, for clarity, the graph for the fixation durations does not include three fixations that were between 6000 and 8000 ms, but those fixations were included in the model. The biological sex of each infant is indicated by the shape of the point.
Figure 5
Figure 5
Duration of (A) total looking on each trial and (B) of individual fixations on each trial to the upper and lower regions, separated by Asian American and White faces. Each open circle is the duration on a single trial from a single infant (A) or a single fixation on a single trial from a single infant (B). The lines represent the estimated marginal means for each of the two models, and the error bars represent 95% Sidak-adjusted confidence intervals calculated from the models. Note, for clarity, the graph for the fixation durations does not include three fixations that were between 6000 and 8000 ms, but those fixations were included in the model. The biological sex of each infant is indicated by the shape of the point.
Figure 6
Figure 6
Looking at the upper and lower regions of the faces by (A) mother’s race, (B) diversity of experience, and (C) language experience, averaged across infants and trial type. The colored letters that correspond to each marginal mean point represent simple contrasts of the estimated marginal means with Tukey post-hoc corrected p-values for multiple comparisons. Marginal means with different corresponding letters (i.e., points “a” and “b” in panel c) significantly differ. Error bars represent 95% Sidak-adjusted confidence intervals.
Figure 7
Figure 7
The duration of fixations as a function of fixation index. Each dot represents a single fixation from a single infant; the three lines represent the estimated marginal means from the three models. Note, this figure removed three fixations that had durations greater than 6000 ms (all fixation index <3), but all fixations were included in the model. In addition, as this figure demonstrates, the number of fixations decreased dramatically as the fixation index increased. In fact, 93% of the fixations were index 1 through 14. In future figures, we show model estimates to index 14. Error bars represent 95% Sidak-adjusted confidence intervals.
Figure 8
Figure 8
Top: The estimated marginal means for the duration of fixations as a function of (A) face race, speech type and fixation index and (B) face race, AOI, and fixation index (B), taken from the model including diversity of experience. Bottom: The observed means for the interactions of (C) face race, speech type, and fixation index, and (D) face race, AOI, and fixation index. Error bars represent non-adjusted 95% confidence intervals. Although fixations are only plotted to fixation index 14, all fixations were entered in the models.
Figure 9
Figure 9
Top: The estimated marginal means for the duration of fixations at each fixation index as a function of experience: (A) mother’s race (B) diversity of experience, and (C) language experience. Bottom: the observed means for the duration of fixations at each fixation index as a function of experience: (D) mother’s race (E) diversity of experience, and (F) language experience. Error bars represent non-adjusted 95% confidence intervals. Although fixations are only plotted to fixation index 14, all fixations were entered in the models.
Figure 10
Figure 10
The probability of a fixation that is directed to the lower region of the face; higher numbers indicate a larger probability of fixations to the lower half: (A) depicts the fixed effect of Index, and shows how the probability of fixations to the lower half changes over fixation index. (B) depicts the interaction between speech type and fixation index and shows how the change in the probability of fixations directed to the lower half over fixation index is different for infant-directed and adult-directed stimuli. The line bisecting each figure at 0.50 indicates change (e.g., equal proportion of looking to the upper and lower halves). For each graph, the open circles represent the observed proportion of fixations directed to the lower half of the faces collapsed across all infants and for all trials; the green open circles only contain fixations from infants that were considered multilingual or monolingual and used for the language analyses, the black open circles represent fixations from all infants regardless of language experience. The filled circles connected by colored lines represent the marginal means from each of the models. The brown circles are the marginal means from the diversity of experience model, the green circles are from the language experience model, and the blue circles are from the mother’s race model. Error bars represent asymptotic upper and lower confidence limits.
Figure 11
Figure 11
The probability of a fixation to the lower half of the face. Top: Model estimate for the probabilities on each index as a function of (A) face race, (B) face race and mother’s race, and (C) face race and diversity of experience. Bottom: Observed proportions on each index as a function of (D) face race, (E) face race and mother’s race, and (F) face race and diversity of experience. Error bars represent asymptotic upper and lower confidence limits. Although fixations are only plotted to fixation index 14, all fixations were entered in the models.
Figure 12
Figure 12
The significant clusters of t-tests comparing the proportion of fixations to the upper region to chance (0.50) are indicated by a line at the bottom of the figure and are listed in Table 5. Recall that the significance of these clusters was established using a permutation analysis which therefore helps to control for multiple comparisons. It can be seen that overall infants fixated on the lower region more than chance between 750 and 4000 ms and between 4500 and 7250 ms, so for nearly the entire trial.
Figure 13
Figure 13
Subject-weighted mean time course for each trial type. The x axis represents time bins and the y axis represents the proportion of looking at the lower half of the face. Each line represents the subject-weighted mean proportion of looking at the lower half of the face and the shading around the lines represents 95 percent confidence intervals. The horizontal bar bisecting the y axis represents chance (0.50). Individual line segments displayed below the subject-weighted mean time course for each condition indicate clusters that were significantly different from chance as indicated by our permutation analysis.

References

    1. Fantz R.L. The origin of form perception. Sci. Am. 1961;204:66–72. doi: 10.1038/scientificamerican0561-66. - DOI - PubMed
    1. Fagan J.F. Infants’ recognition memory for faces. J. Exp. Child Psychol. 1972;14:453–476. doi: 10.1016/0022-0965(72)90065-3. - DOI - PubMed
    1. Kwon M.-K., Setoodehnia M., Baek J., Luck S.J., Oakes L.M. The development of visual search in infancy: Attention to faces versus salience. Dev. Psychol. 2016;52:537–555. doi: 10.1037/dev0000080. - DOI - PMC - PubMed
    1. Oakes L.M., Ellis A.E. An Eye-Tracking Investigation of Developmental Changes in Infants’ Exploration of Upright and Inverted Human Faces. Infancy. 2013;18:134–148. doi: 10.1111/j.1532-7078.2011.00107.x. - DOI - PMC - PubMed
    1. Xiao N.G., Quinn P.C., Liu S., Ge L., Pascalis O., Lee K. Eye tracking reveals a crucial role for facial motion in recognition of faces by infants. Dev. Psychol. 2015;51:744–757. doi: 10.1037/dev0000019. - DOI - PMC - PubMed