. 2021 Feb 12;22(4):1852.
doi: 10.3390/ijms22041852.

Evidence for 2-Methoxyestradiol-Mediated Inhibition of Receptor Tyrosine Kinase RON in the Management of Prostate Cancer

Affiliations

Evidence for 2-Methoxyestradiol-Mediated Inhibition of Receptor Tyrosine Kinase RON in the Management of Prostate Cancer

Izhar Singh Batth et al. Int J Mol Sci. .

Abstract

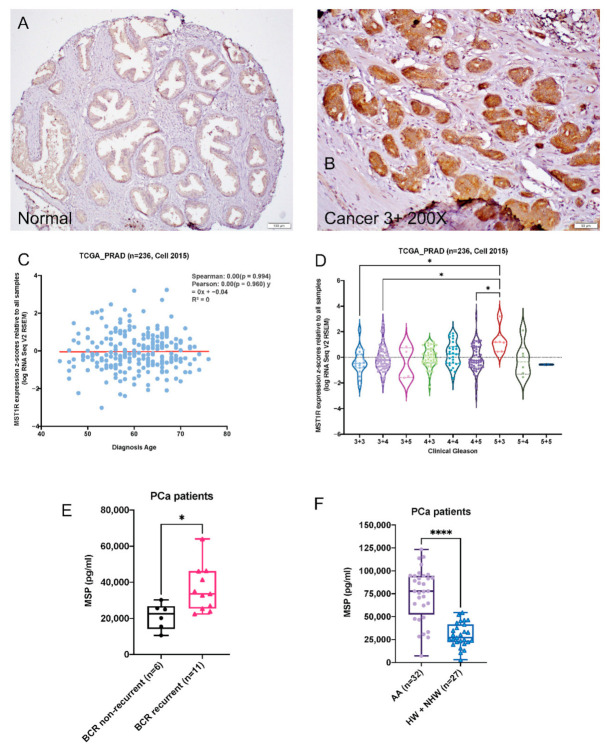
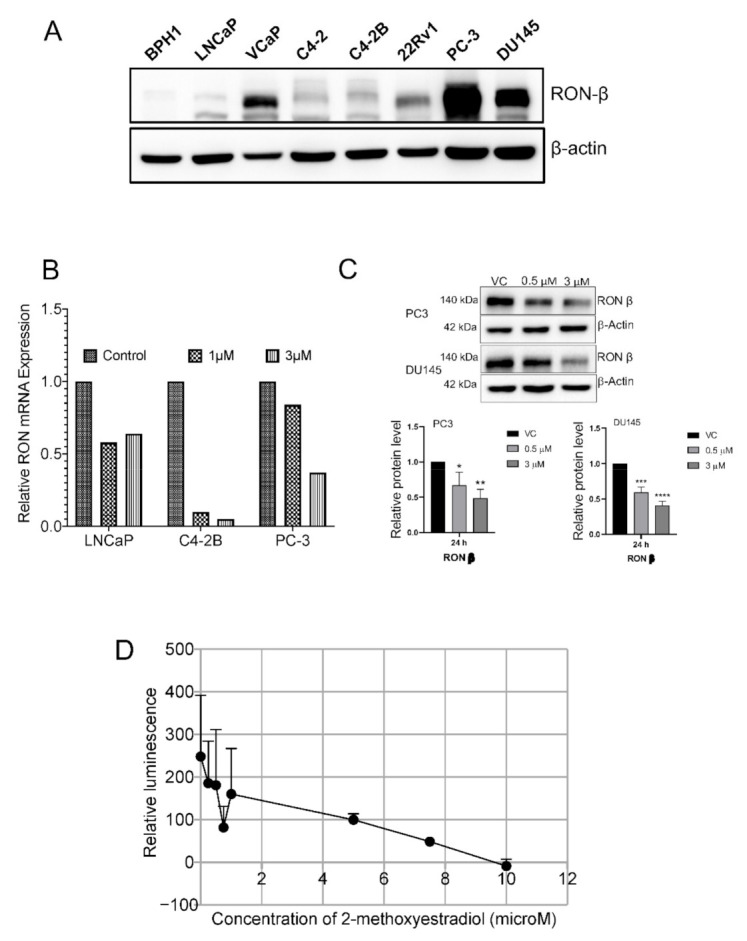
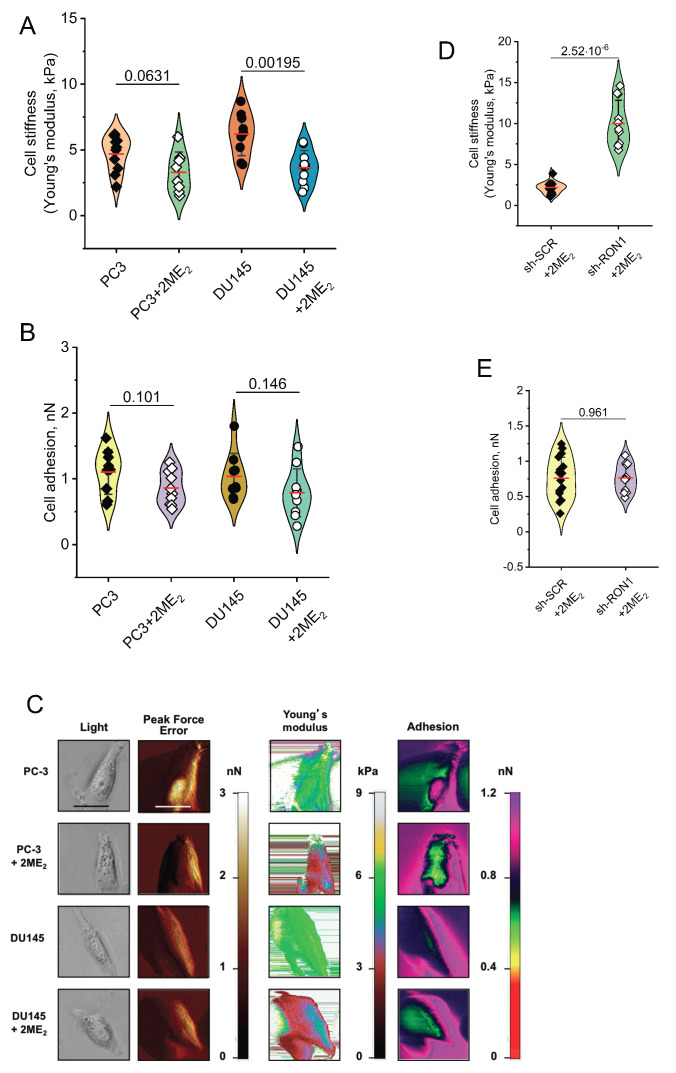
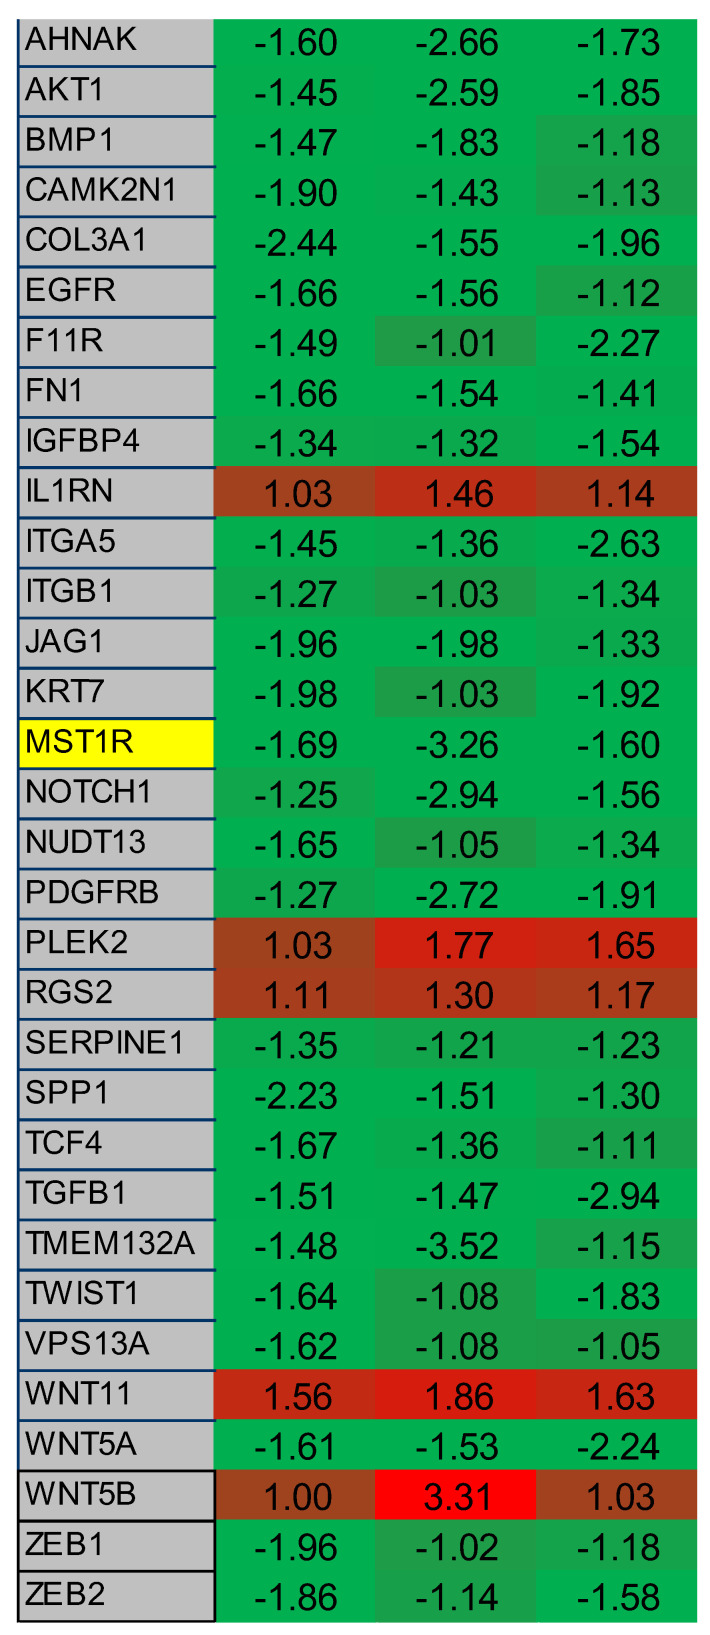
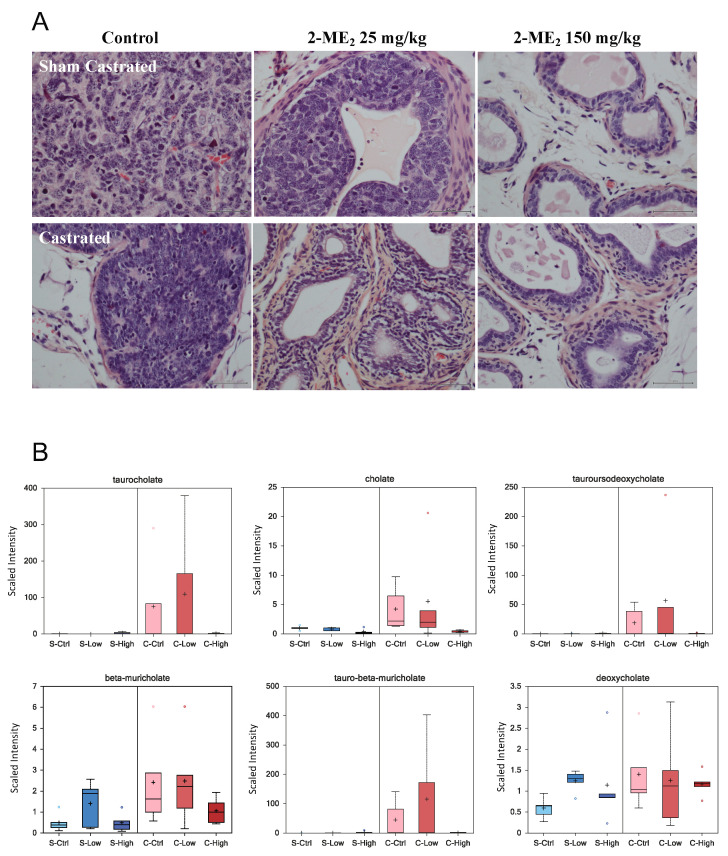
2-Methoxyestradiol (2-ME2) possesses anti-tumorigenic activities in multiple tumor models with acceptable tolerability profile in humans. Incomplete understanding of the mechanism has hindered its development as an anti-tumorigenic compound. We have identified for the first-time macrophage stimulatory protein 1 receptor (MST1R) as a potential target of 2-ME2 in prostate cancer cells. Human tissue validation studies show that MST1R (a.k.a RON) protein levels are significantly elevated in prostate cancer tissues compared to adjacent normal/benign glands. Serum levels of macrophage stimulatory protein (MSP), a ligand for RON, is not only associated with the risk of disease recurrence, but also significantly elevated in samples from African American patients. 2-ME2 treatment inhibited mechanical properties such as adhesion and elasticity that are associated with epithelial mesenchymal transition by downregulating mRNA expression and protein levels of MST1R in prostate cancer cell lines. Intervention with 2-ME2 significantly reduced tumor burden in mice. Notably, global metabolomic profiling studies identified significantly higher circulating levels of bile acids in castrated animals that were decreased with 2-ME2 intervention. In summary, findings presented in this manuscript identified MSP as a potential marker for predicting biochemical recurrence and suggest repurposing 2-ME2 to target RON signaling may be a potential therapeutic modality for prostate cancer.

Keywords: 2-methoxyestradiol; RON; atomic force microscopy; bile acids; castration-resistant prostate cancer; epithelial mesenchymal transition; mechanical properties; prostate cancer disparities; receptor tyrosine kinase.


Conflict of interest statement

Authors declare no conflicts of interest. The funders had no role in the design of the study; in the collection, analyses, or interpretation of data; in the writing of the manuscript, or in the decision to publish the results.

Figures

Figure 1
Figure 1
Alterations of RON in human prostate cancer cells and tumors. (A,B). Expression changes of RON in normal and human prostate tumors. (C). Scatter plot with regression straight line showing the correlation of MST1R mRNA expression in primary prostate tumor tissues and patients’ age in TCGA_PRAD dataset (n = 236) [27] determined by Spearman and Pearson correlation analysis. (D). Violin plot showing expression of MST1R in primary prostate tumor tissues categorized by Gleason status (TCGA_PRAD, n = 236) [27]. Each dot represents a single tumor tissue. Kruskal–Wallis Test was used for statistical analysis, * p < 0.05. Kruskal–Wallis Test was used for statistical analysis, * p < 0.05, **** p < 0.001. (EF) Box plot shows MSP levels in sera of PCa patients with BCR (n = 11) and without BCR (n = 6; E) and AAs (n = 32), HWs and NHWs (n = 27; F). Statistical significance of the data was determined by Mann–Whitney test.
Figure 2
Figure 2
(A) Whole cell lysates from indicated cell lines was used to determine the protein levels of RON using immunoblot analysis. β-actin was used as the loading control. Blot shown are representative of two individual experiments. (B). RON mRNA levels following 24 h 2-ME2 treatment. Data presented is from 3 independent experiments. (C). Protein levels of RON following treatment with 2-ME2 (24 h) in PC-3 and DU145 cell lines using immunoblot analysis. β-actin was used as the loading control. A representative blot from three individual experiments is shown (D). Impact of 2-ME2 on RON kinase activity was determined using ADP-GloTM Kinase Assay (Promega Corporation, Madison, WI). The assay is based on monitoring the production of ADP concentration using luminescence which is directly proportional to kinase activity. Kinase reaction was performed essentially as per manufacturer’s protocol in the presence of increasing concentrations of 2-ME2. To test if 2-ME2 interferes with assay components, kinase reaction was performed excluding RON kinase and considered as background. Kinase activity is expressed as relative to kinase activity in the absence of 2-ME2. Data presented is an average of triplicate measurements.
Figure 3
Figure 3
2-ME2 affects cell elasticity and adhesion of PCa cells (AE). PC-3 and DU145 cells treated with 2-ME2 for 6 h at 3 μM. Increased stiffness of treated cells is reflected by a decrease of Young’s modulus (A). Treated cells are more adhesive (B). Each point represents an individual cell from repeated experiments. kPa = kiloPascals; pN = picoNewtons. (C) A panel of images obtained with the Peak Force QNM AFM shows distinct nanomechanical properties of individual PC-3 and DU145 control or 2-ME2-treated cells. Each row displays four different properties of a single cell with or without 2-ME2 treatment. Each column shows individual property of the cell collected in four channels: light microscopy image, peak force error (edge detection and fine topographical details), cell elasticity (Young’s modulus, kPa) and cell adhesion (nN). Peak Force Error images were used to determine the cell boundary collected in elasticity and adhesion channels. All images (except light microscopy) are false colored. The Peak Force Error scale shows smaller to taller objects progressing from dark brown to white color. The Young’s modulus (elasticity) scale shows softer objects as black and brown (lower modulus) and more rigid as green and yellow (higher modulus). The adhesion scale shows less adhesive objects as yellow and green (less force needed to separate an AFM tip from a cell) and stickier objects as dark blue and pink (more force needed). The black and white scale bars represent 40 and 20 μm, respectively (D,E). Mechanical properties of PC-3 cells stably silenced for RON in the presence and absence of 2-ME2 at 3 μM (6 h). Decreased stiffness is reflected by an increase of Young’s modulus (D). Adhesion of cells does not respond to silencing for RON and 2-ME2-treatement (E). Each point represents an individual cell.
Figure 4
Figure 4
2-ME2 treatment in PC-3 cells affects multiple genes associated with EMT. A 96-well qPCR array of genes associated with EMT was screened using cDNA derived from control or 24 h 2-ME2 treated (3 µM) PC-3 cells. Each column represents a single experiment. Table shows fold change in gene expression relative to β-actin with consistent results across three experiments. RON (listed as MST1R) is highlighted in yellow. A heatmap was created based on relative overexpression (red) and under expression (green). Green indicates upregulated gene expression from 0 to +4 and red indicates downregulated gene expression from 0 to −4.
Figure 5
Figure 5
(A). Sham castrated or castrated TRAMP mice received water control (n = 10 each for sham or castrated group) or 25 or 150 mg/kg 2-ME2 (n = 10 each for sham or castrated group per respective dose). The experiment was terminated following 10 week-intervention and prostate tumor, or tissue was collected for histopathological evaluation. A representative image of H&E staining is shown. (B) Box plots showing levels of indicated bile acids in serum from castrated or sham-castrated mice (n = 5 per each group).

Similar articles

Cited by

References

    1. Siegel R.L., Miller K.D., Jemal A. Cancer statistics, 2020. CA Cancer J. Clin. 2020;70:7–30. doi: 10.3322/caac.21590. - DOI - PubMed
    1. American Cancer Society . Cancer Facts & Figures 2020. American Cancer Society; Atlanta, GA, USA: 2020. pp. 1–76.
    1. Litwin M.S., Tan H.-J. The Diagnosis and Treatment of Prostate Cancer. JAMA. 2017;317:2532. doi: 10.1001/jama.2017.7248. - DOI - PubMed
    1. Iida M., Brand T.M., Campbell D.A., Li C., Wheeler D.L. Yes and Lyn play a role in nuclear translocation of the epidermal growth factor receptor. Oncogene. 2013;32:759–767. doi: 10.1038/onc.2012.90. - DOI - PMC - PubMed
    1. Du Y., Shen J., Hsu J.L., Han Z., Hsu M.-C., Yang C.-C., Kuo H.-P., Wang Y.-N., Yamaguchi H., Miller S.A., et al. Syntaxin 6-mediated Golgi translocation plays an important role in nuclear functions of EGFR through microtubule-dependent trafficking. Oncogene. 2014;33:756–770. doi: 10.1038/onc.2013.1. - DOI - PMC - PubMed

MeSH terms