. 2021 Feb 12;10(2):384.
doi: 10.3390/cells10020384.

Scrutinizing Mechanisms of the 'Obesity Paradox in Sepsis': Obesity Is Accompanied by Diminished Formation of Neutrophil Extracellular Traps (NETs) Due to Restricted Neutrophil-Platelet Interactions

Affiliations

Scrutinizing Mechanisms of the 'Obesity Paradox in Sepsis': Obesity Is Accompanied by Diminished Formation of Neutrophil Extracellular Traps (NETs) Due to Restricted Neutrophil-Platelet Interactions

Iwona Cichon et al. Cells. .

Abstract

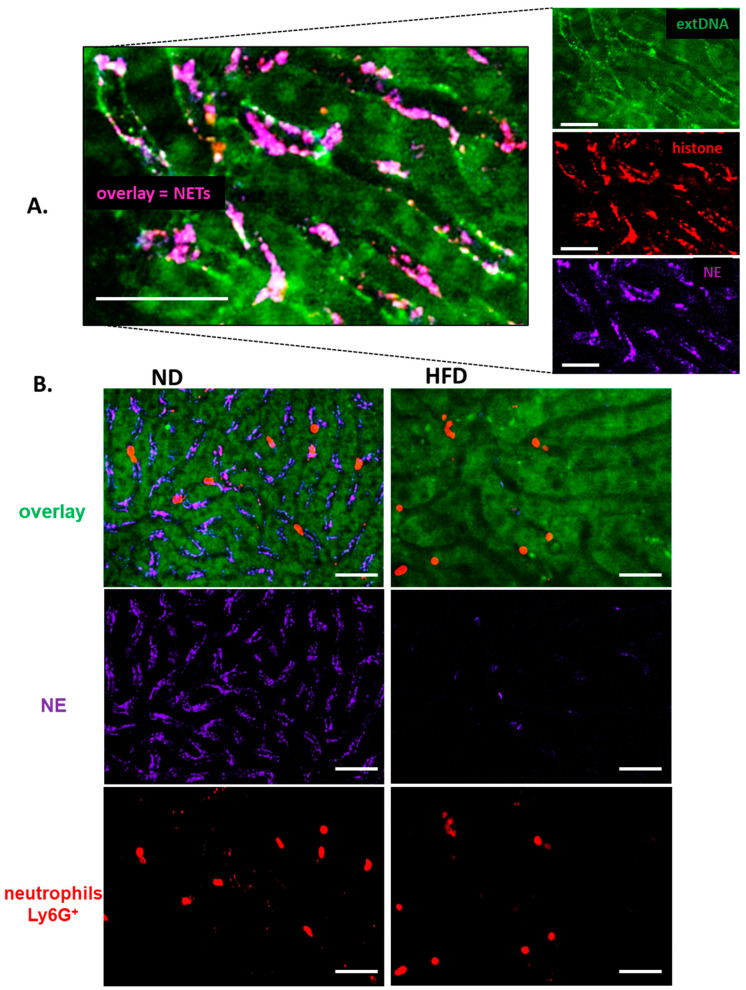
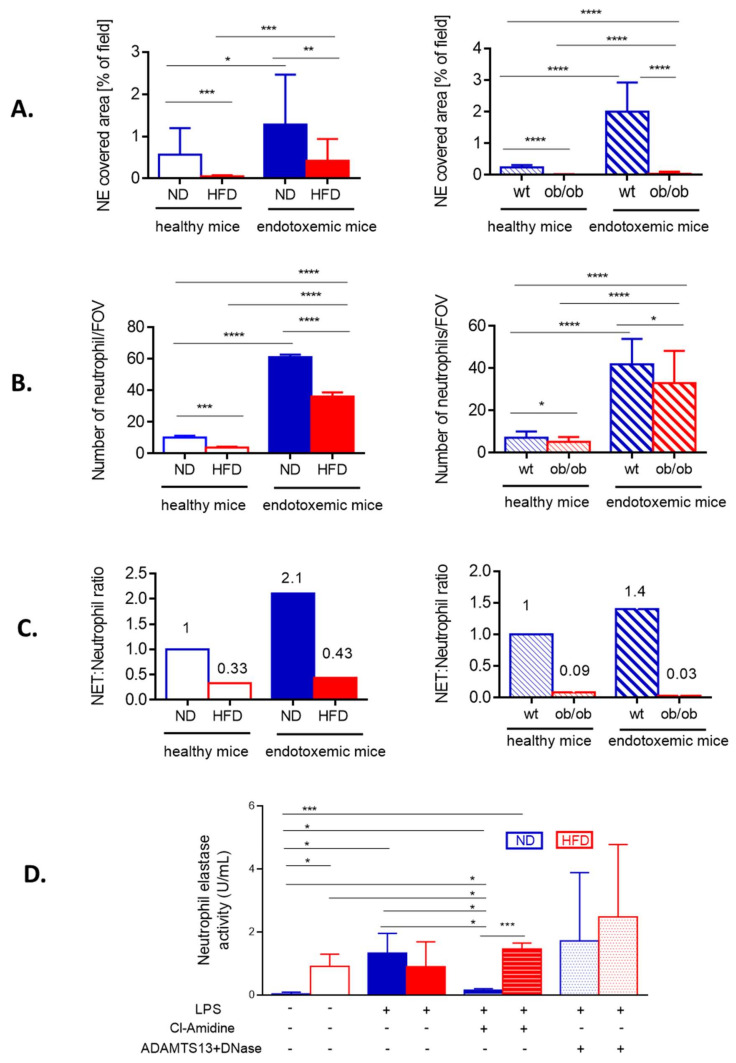
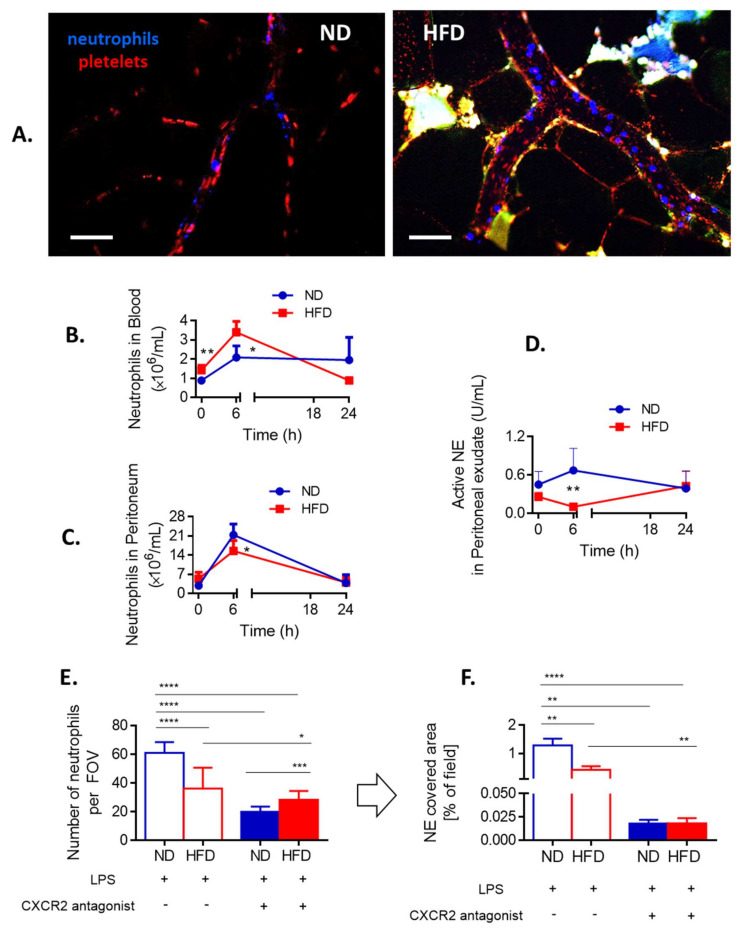
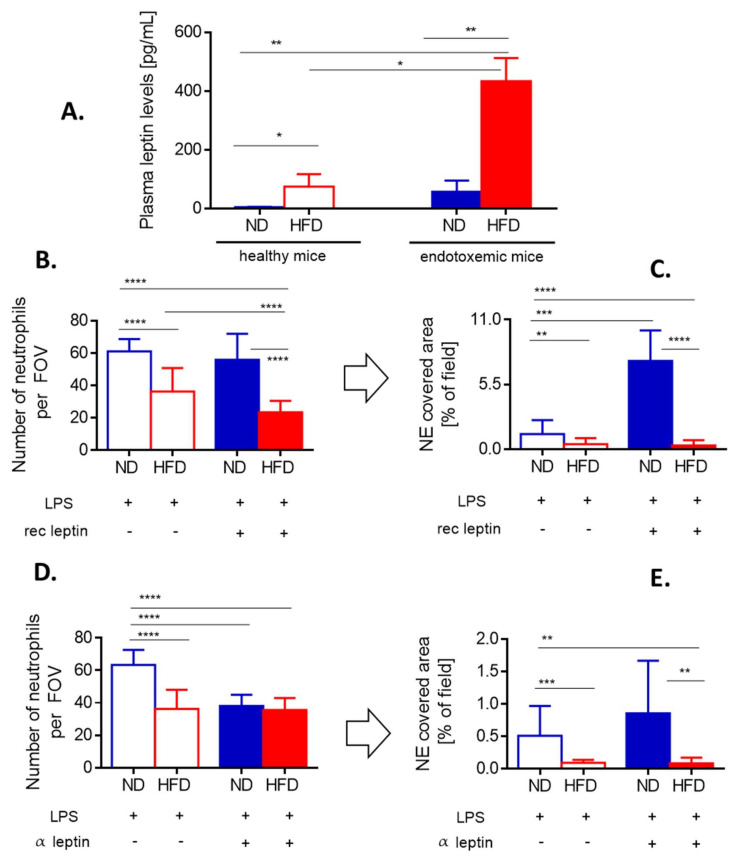
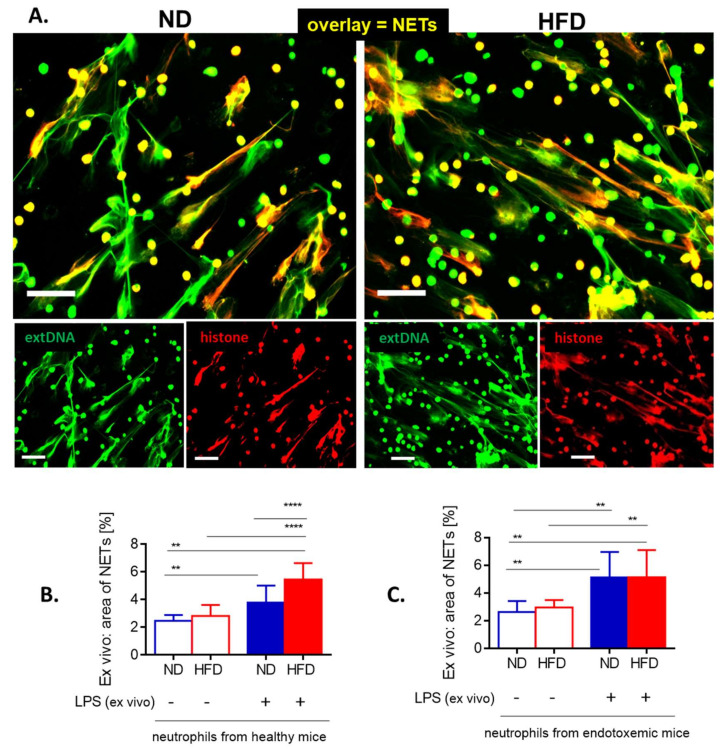
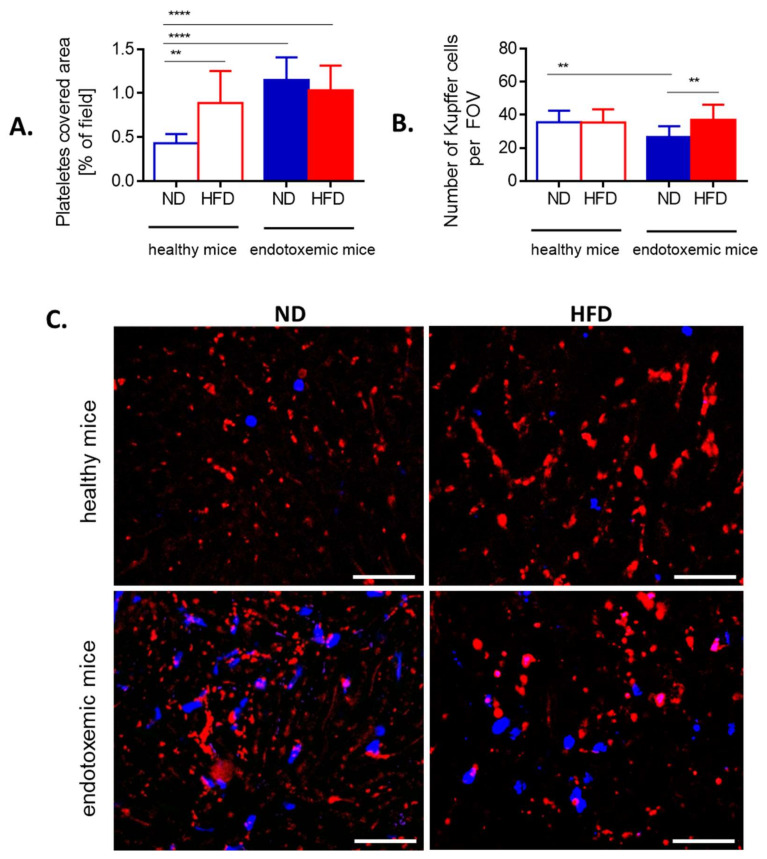
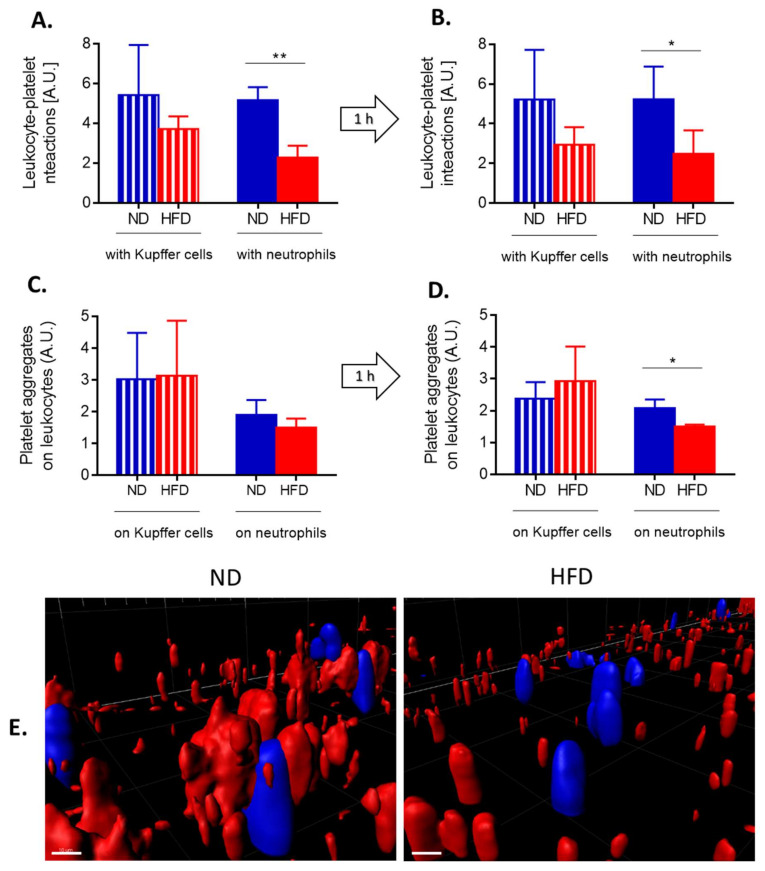
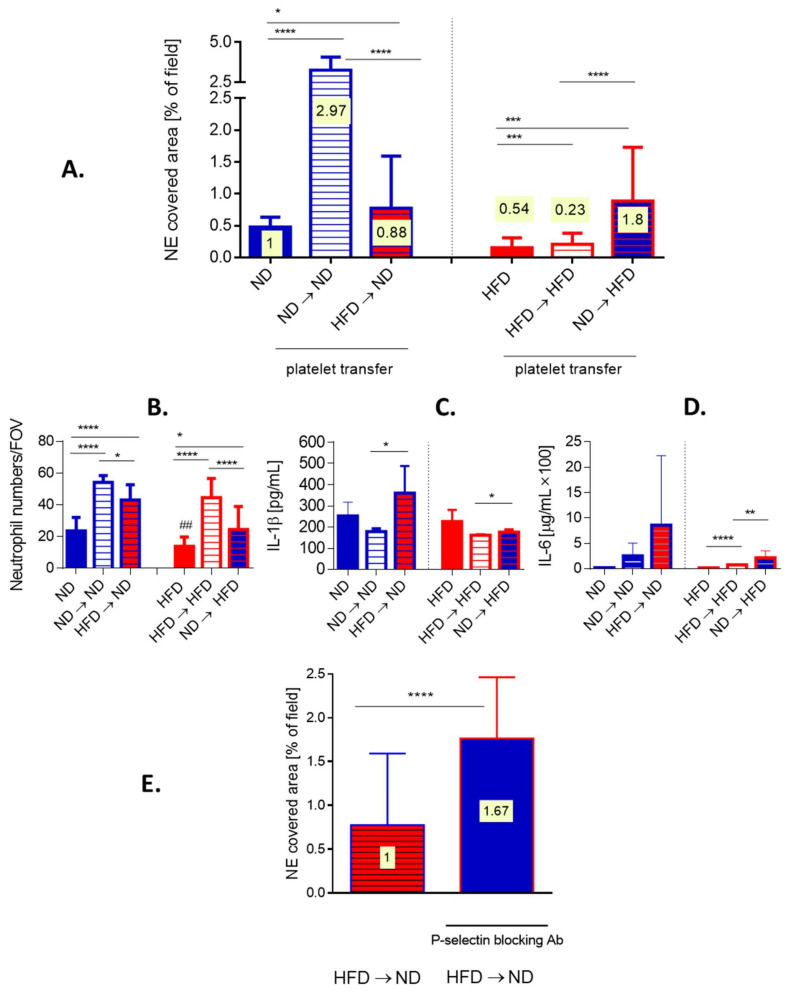
Systemic inflammation is a detrimental condition associated with high mortality. However, obese individuals seem to have higher chances of surviving sepsis. To elucidate what immunological differences exist between obese and lean individuals we studied the course of endotoxemia in mice fed high-fat diet (HFD) and ob/ob animals. Intravital microscopy revealed that neutrophil extracellular trap (NET) formation in liver vasculature is negligible in obese mice in sharp contrast to their lean counterparts (ND). Unlike in lean individuals, neutrophil influx is not driven by leptin or interleukin 33 (IL-33), nor occurs via a chemokine receptor CXCR2. In obese mice less platelets interact with neutrophils forming less aggregates. Platelets transfer from ND to HFD mice partially restores NET formation, and even further so upon P-selectin blockage on them. The study reveals that in obesity the overexaggerated inflammation and NET formation are limited during sepsis due to dysfunctional platelets suggesting their targeting as a therapeutic tool in systemic inflammation.

Keywords: endotoxemia; neutrophil extracellular traps; neutrophils; obesity; platelets; sepsis; systemic inflammation.


Conflict of interest statement

The authors declare no conflict of interest.

Figures

Figure 1
Figure 1
Deposition of neutrophil extracellular traps (NETs) in liver sinusoids during endotoxemia in lean (ND, left) and obese (HFD, right) mice. (A) Representative images of NETs were acquired with Spinning Disk Confocal Intravital Microscopy (SD-IVM) at 24 h of endotoxemia. To visualize colocalization of NET components, the frames from each channel were overlaid. On images autofluorescent hepatocytes (dim green) can be observed in between which sinusoids are localized (black ducts). In the latter structures, neutrophil elastase (NE, violet), histone H2A.X (red), and extracellular DNA (extDNA, bright green) overlaying signal is visible lining along endothelium. (B) Representative images revealing differences in NET deposition (NE and extDNA) and neutrophil numbers in sinusoids of ND and HFD mice at 24 h of endotoxemia. The scale bar indicates 50 μm.
Figure 2
Figure 2
Quantification of neutrophil extracellular trap (NET) formation and neutrophil accumulation in liver sinusoids during endotoxemia in lean and obese mice. The analyses were performed in both models of obesity, in high fat diet (HFD) animals and their controls (ND) (left column), and ob/ob mice and their wild-type counterparts (wt) (right column). (A) Quantitative analysis of NETs within the liver sinusoids: area (%) covered by neutrophil elastase (NE). (B) The numbers of infiltrating neutrophils were quantified with ImageJ v1.53a software and are expressed as number per field of view (FOV). (C) Ratio of NETs to neutrophils was calculated by dividing % of formed NETs by number of neutrophils. A 1 represents arbitrary value for NET formation by neutrophils of healthy either ND (left panel in C) or wt mice (right panel in C). (D) Activity of neutrophil elastase (NE) was measured in blood plasma. The legend under the graph (LPS, Cl-Amidine, ADAMTS13+DNase) refers to treatments received by animals to either induce endotoxemia (lipopolysaccharide, LPS), to block NET formation (Cl-amidine) or to detach NETs from the vasculature (ADAMTS13+DNase). Asterisks indicate significant differences between lean (either ND or wt) and obese (either HFD or ob/ob) mice using unpaired two-tailed Student’s t-test (* p ≤ 0.05, ** p ≤ 0.01, *** p ≤ 0.001, **** p ≤ 0.0001). Data are shown as mean ± s.d.; n ≥ 3 per group.
Figure 3
Figure 3
Neutrophil infiltration of the adipose tissue and peripheral tissues, and CXCR2-dependency of neutrophil accumulation in the sinusoids of lean (ND) and obese (HFD) mice. (A) Representative images of the vasculature in the adipose tissue of ND and HFD animals. To visualize blood flow, platelets were stained (red) and neutrophils labelled in blue. Autofluorescent adipose tissue is seen as white/green as the background signal. The scale bar indicates 50 μm. Neutrophil counts in blood (B) and peritoneal lavage (C) were performed with a hemocytometer at different time points of endotoxemia. Additionally, neutrophil elastase (NE) activity was evaluated in the peritoneal exudate (D). To verify if neutrophil infiltration of liver sinusoids depends on a chemokine receptor CXCR2 some ND and HFD mice were pretreated with its antagonist (SB225002) and 24 h after induction of endotoxemia neutrophil infiltration (E) as well as neutrophil extracellular trap (NET) formation (F) in the liver vasculature were estimated. In E-F blue line/filling is always used for NDs and red for HFD mice. Asterisks indicate significant differences between lean (either ND or wt) and obese (either HFD or ob/ob) mice using unpaired two-tailed Student’s t-test (* p ≤ 0.05, ** p ≤ 0.01, *** p ≤ 0.001, **** p ≤ 0.0001). Data are shown as mean ± s.d.; n ≥ 3 per group. We attempted to detect NETs in the vasculature of the adipose tissue but no positive signal for any of their components was spotted at any time. We also verified numbers of neutrophils present in the blood (heart puncture). Although at first more neutrophils were detected in the peripheral blood (6 h) of obese individuals, at 24 h of sepsis their numbers were lower than those found in lean animals (Figure 3B). Thus, at the latter time point the pattern was the same as in liver sinusoids (Figure 2B). Importantly, we verified that also at 6 h of endotoxemia neutrophils of obese individuals were releasing less NETs than those of lean mice despite higher neutrophil counts (Supplementary Figure S6).
Figure 4
Figure 4
Leptin levels and impact of either exogenous leptin or endogenous leptin neutralization on neutrophil accumulation and neutrophil extracellular trap (NET) formation in liver sinusoids of lean (ND) and obese (HFD) mice. (A) Levels of leptin were compared between untreated (healthy) ND and HFD animals as well as endotoxemic mice, 24 h post lipopolysaccharide (LPS) injection. Some animals received a bolus of exogenous recombinant leptin (rec leptin) prior to endotoxemia induction, and subsequently neutrophil infiltration (B) and NET formation (C) in the liver vasculature were estimated. Control mice received saline. Another group of mice received mouse anti-Leptin/OB antibody to neutralize their endogenous leptin (α leptin) whereas respective controls were injected with an isotype control as detailed in Section 2.4. Upon induction of endotoxemia, neutrophil accumulation (D) and NET formation (E) in liver sinusoids were studied. Asterisks indicate significant differences between ND and HFD mice using unpaired two-tailed Student’s t-test (* p ≤ 0.05, ** p ≤ 0.01, *** p ≤ 0.001, **** p ≤ 0.0001). Data are shown as mean ± s.d.; n ≥ 3 per group.
Figure 5
Figure 5
Release of neutrophil extracellular traps (NETs) by isolated bone marrow neutrophils of lean (ND) and obese (HFD) mice. (A) Representative images: NETs were visualized by costaining of citrullinated histone H3 (citH3, red) and extracellular DNA (extDNA, green) and their formation was evaluated 6 h after stimulation with lipopolysaccharide (LPS). The scale bar indicates 50 μm. (B, C) NET quantification: area (%) covered by extDNA. Neutrophils were collected either from healthy mice (B) or mice with LPS-induced endotoxemia (C). Asterisks indicate significant differences using unpaired two-tailed Student’s t-test (** p ≤ 0.01, **** p ≤ 0.0001). Data are shown as mean ± s.d.; n ≥ 3 per group.
Figure 6
Figure 6
Presence of platelets and Kupffer cells in liver sinusoids of lean (ND) and obese (HFD) mice. (A) Area covered by platelets is expressed as percentage of covered area (as calculated by ImageJ v1.53a), and (B) Kupffer cells were counted per field of view (FOV) on acquired images. (C) Representative images of area covered by platelets (red) and localization of neutrophils (blue). The scale bar indicates 50 μm. Asterisks indicate significant differences using unpaired two-tailed Student’s t-test (** p ≤ 0.01, **** p ≤ 0.0001). Data are shown as mean ± s.d.; n ≥ 3 per group.
Figure 7
Figure 7
Quantification of interactions between platelets and neutrophils/Kupffer cells, and formation of platelet aggregates on the leukocytes of lean (ND) and obese (HFD) mice. Interactions between respective cells (A platelet–neutrophil, B platelet–Kupffer cells) were estimated in liver sinusoids as a sustained contact lasting at least 6 s. An average number of platelet-leukocyte interactions over 60 s is presented on the graph. Average number of platelet aggregates forming on the surface of neutrophils (C) and Kupffer cells (D) within 60 s. (E) Exemplary images of z stacks made through the liver of ND and HFD mice visualizing platelet aggregates of platelets (red) on neutrophils (blue). The scale bar indicates 10 μm. Asterisks indicate significant differences using unpaired two-tailed Student’s t-test (* p ≤ 0.05, ** p ≤ 0.01). Data are shown as mean ± s.d.; n ≥ 3 per group.
Figure 8
Figure 8
Effects of platelet transfer between lean (ND) and obese (HFD) mice on the formation of neutrophil extracellular traps (NETs), cytokine release and neutrophil accumulation in liver sinusoids. Platelets isolated from blood collected from healthy ND and HFD animals were subsequently intravenously (i.v.) injected into different recipients. Namely, platelets isolated from lean mice were injected into lean mice (ND → ND), platelets isolated from lean mice were injected into obese mice (ND → HFD), platelets isolated from obese mice were injected into lean mice (HFD → ND), and platelets isolated from obese mice were injected into obese mice (HFD → HFD). (A) neutrophil extracellular trap (NET) deposition in liver sinusoids and (B) neutrophil accumulation therein was estimated with intravital microscopy imaging (IVM), and IL-1b (C) and IL-6 (D) release into blood plasma by ELISAs. (E) Additionally, before transfer of platelets isolated from obese mice into lean mice (HFD → ND) they were incubated with P-selectin blocking antibody and NET formation was estimated with IVM. On bars in (A) and (E) ratio of NET-to-neutrophils is plotted (numbers on yellow background). Asterisks indicate significant differences between ND and HFD mice using unpaired two-tailed Student’s t-test (* p ≤ 0.05, ** p ≤ 0.01, *** p ≤ 0.001, **** p ≤ 0.0001). Data are shown as mean ± s.d.; n ≥ 3 per group.

Similar articles

Cited by

References

    1. Singer M., Deutschman C.S., Seymour C., Shankar-Hari M., Annane D., Bauer M., Bellomo R., Bernard G.R., Chiche J.D., Coopersmith C.M., et al. The third international consensus definitions for sepsis and septic shock (sepsis-3) Jama J. Am. Med. Assoc. 2016;315:801–810. doi: 10.1001/jama.2016.0287. - DOI - PMC - PubMed
    1. Cecconi M., Evans L., Levy M., Rhodes A. Sepsis and septic shock. Lancet. 2018;392:75–87. doi: 10.1016/S0140-6736(18)30696-2. - DOI - PubMed
    1. Genga K.R., Russell J.A. Update of Sepsis in the Intensive Care Unit. J. Innate Immun. 2017;9:441–455. doi: 10.1159/000477419. - DOI - PMC - PubMed
    1. Van Der Poll T., Van De Veerdonk F.L., Scicluna B.P., Netea M.G. The immunopathology of sepsis and potential therapeutic targets. Nat. Rev. Immunol. 2017;17:407–420. doi: 10.1038/nri.2017.36. - DOI - PubMed
    1. Hotchkiss R.S., Monneret G., Payen D. Sepsis-induced immunosuppression: From cellular dysfunctions to immunotherapy. Nat. Rev. Immunol. 2013;13:862–874. doi: 10.1038/nri3552. - DOI - PMC - PubMed

Publication types

LinkOut - more resources