. 2021 Feb 27;10(3):505.
doi: 10.3390/cells10030505.

Generation and Breeding of EGFP-Transgenic Marmoset Monkeys: Cell Chimerism and Implications for Disease Modeling

Affiliations

Generation and Breeding of EGFP-Transgenic Marmoset Monkeys: Cell Chimerism and Implications for Disease Modeling

Charis Drummer et al. Cells. .

Abstract

Genetic modification of non-human primates (NHP) paves the way for realistic disease models. The common marmoset is a NHP species increasingly used in biomedical research. Despite the invention of RNA-guided nucleases, one strategy for protein overexpression in NHP is still lentiviral transduction. We generated three male and one female enhanced green fluorescent protein (EGFP)-transgenic founder marmosets via lentiviral transduction of natural preimplantation embryos. All founders accomplished germline transmission of the transgene by natural mating, yielding 20 transgenic offspring together (in total, 45 pups; 44% transgenic). This demonstrates that the transgenic gametes are capable of natural fertilization even when in competition with wildtype gametes. Importantly, 90% of the transgenic offspring showed transgene silencing, which is in sharp contrast to rodents, where the identical transgene facilitated robust EGFP expression. Furthermore, we consistently discovered somatic, but so far, no germ cell chimerism in mixed wildtype/transgenic litters. Somatic cell chimerism resulted in false-positive genotyping of the respective wildtype littermates. For the discrimination of transgenic from transgene-chimeric animals by polymerase chain reaction on skin samples, a chimeric cell depletion protocol was established. In summary, it is possible to establish a cohort of genetically modified marmosets by natural mating, but specific requirements including careful promoter selection are essential.

Keywords: chimerism; embryo; genetic modification; germ cell; germline transmission; hematopoietic stem cell; marmoset monkey; non-human primate; transgenesis.


Conflict of interest statement

The authors declare no conflict of interest.

Figures

Figure 1
Figure 1
Generation of EGFP-transgenic marmoset monkeys. (A) Injection of the virus suspension into the perivitelline space of an 8–16 cell embryo. Scale bar: 100 µm. (B) Bright-field image of an EGFP virus-injected embryo. (B′) Fluorescent image of the embryo shown in (B)), 4 h after virus injection. The arrows highlight a blastomere lacking green fluorescence. (B″) Merged images of (B) and (B′). (C) Ultrasonographic image of an embryo transfer (ET) into a surrogate mother. The transfer catheter (white arrow) is placed in the lumen of the uterus (red arrow; yellow arrow: embryo). (D) Ultrasonographic image of an embryo 49 days after ET and (E) of an embryo 85 days after ET. (F) PCR genotyping of monkeys obtained after virus injection and ET. Animals #87, #90, #91, and #85 were EGFP-positive. (G) A transgenic postnatal marmoset (#90). (H) A transgenic adult marmoset (#90). (I) Overview of the postnatal animals obtained from injected embryos.
Figure 2
Figure 2
Quantification of EGFP-positive cells by flow cytometry. (AE) Peripheral blood cells. (A) Wt control. (BE) EGFP-transgenic animals #90, #91, #87, and #85, respectively. The transgenic animals show between 1.5% and 21.2% EGFP-positive cells. (FJ) Cultured skin fibroblasts. Left column: bright-field images; middle column: fluorescence images; right column: flow-cytometric quantification of EGFP-positive fibroblasts. Scale bars: 100 µm. (F) Wt negative control. (GJ) EGFP-transgenic animals #90, #91, #87, and #85. The fibroblast cultures from the transgenic animals show between 4.7% and 29.8% EGFP-positive cells.
Figure 3
Figure 3
EGFP expression in the deceased neonate #83. (A) The transgene was detected by PCR on genomic DNA in all organs. (B) Bright-field image and (B′) fluorescence image of cultured skin fibroblasts from animal #83. Scale bars: 100 µm. (C) Genomic Southern blot of fibroblast DNA from #83 (GFP+) and from wt fibroblasts using an EGFP-specific probe. Only one band of around 6 kb is visible in the transgenic animal. Samples were loaded in duplicate. (D) EGFP western blot analysis of fibroblast protein from #83 (GFP+) and from wt control. From both samples cytoplasmic (C) and nuclear (N) protein fractions were analyzed. Only the cytoplasmic fraction of the cells of animal #83 showed an EGFP band.
Figure 4
Figure 4
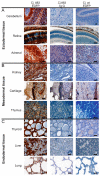
EGFP expression analysis in tissues of #83. Left column: images of tissues from the EGFP-transgenic animal #83 incubated with the EGFP antibody. Middle column: consecutive sections of the same samples incubated with the IgG control serum. Right column: corresponding wt samples incubated with the EGFP antibody. (A) shows tissue samples of ectodermal, (B) of mesodermal and (C) of endodermal origin. Scale bars: 50 µm.
Figure 5
Figure 5
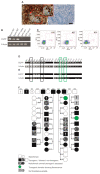
Germline transmission of the transgene. (A) Immunohistochemical detection of EGFP in the neonatal testis of #83. All germ cells show an intense EGFP signal, while intra-tubular somatic cells show only little EGFP signals. Interstitial somatic cells are strongly stained. The boxed area is shown at higher magnification (middle image in (A)). Right image: corresponding negative (wt) control. Scale bars: 50 µm. (B) EGFP PCR on genomic DNA isolated from ejaculated sperm from transgenic founders #87 and #91. Both samples show EGFP amplicons. (C) Flow-cytometric analysis of semen samples from transgenic founders #87 and #91 and a wt control (#16). The transgenic samples show fluorescence above background levels. (D) Genotyping of an exemplary subset of F1 progeny using DNA directly isolated from skin. β-Actin was used as positive control. The genotyping results for all F1 animals are shown in Figure S1. (E) Genotyping of F1 progeny using DNA isolated from frozen-thawed and re-cultured skin fibroblasts. Only a subpopulation of the animals being positive in (D) remained EGFP-positive using selected fibroblasts (two animals exemplarily highlighted by green boxes), while chimeric littermates of transgenic animals switched from “positive” to “negative” (two animals exemplarily highlighted by black boxes). β-Actin was used as a positive control. Those animals that show no β-Actin band in (E) (#110 and #111) were not tested using hematopoietic cell-depleted cell cultures. (F) Pedigree showing the founders and 45 F1 animals obtained from natural mating of animals #87, #91, #90, and #85 with wt partners (latter not depicted). All founders were fertile and transmitted the transgene to progeny.
Figure 6
Figure 6
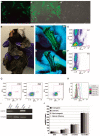
Phenotyping of the F1 animals. (A) Cultured fibroblasts of animal #97 showing EGFP fluorescence. A: Fluorescence image, (A′): Merge with (A″) (right panel, bright-field image). Scale bars: 50 µm. (B) Whole body view of transgenic F1 animal #97. (C) Epifluorescent image of the foot pad of transgenic #97. (D) Epifluorescent image of the foot pad of chimeric #95, which showed no EGFP fluorescence. (E) Flow cytometry of nucleated peripheral blood cells of #97 and (F) #95. (G) Flow-cytometric analyses of sperm cells of #16 (wt control), #95 (F1 chimeric), and #100 (F1 transgenic). In animal #100 the whole cell population is homogenously shifted to higher fluorescence signals with 96.6% in the gate representing EGFP-positive cells. The analyses of spermatozoa shown in Figure 5C and Figure 6G were performed in one run and the analysis of wildtype animal #16 is shown as a control in both figures for the purpose of clarity. (H) Histogram overlay from flow-cytometric sperm cell analyses of transgenic founders #87 and #91 and F1 animals #95 and #100. The grey filled histogram represents wt sperm (#16). (I) PCR genotyping of ejaculated sperm from #95 and #100. (J) Postnatal gain of body weight in the different study groups.

Similar articles

Cited by

References

    1. Phillips K.A., Bales K.L., Capitanio J.P., Conley A., Czoty P.W., ‘t Hart B.A., Hopkins W.D., Hu S.-L., Miller L.A., Nader M.A., et al. Why primate models matter. Am. J. Primatol. 2014;76:801–827. doi: 10.1002/ajp.22281. - DOI - PMC - PubMed
    1. Preuss T.M. Critique of Pure Marmoset. Brain Behav. Evol. 2019;93:92–107. doi: 10.1159/000500500. - DOI - PMC - PubMed
    1. Kwiecien T.D., Sy C., Ding Y. Rodent models of ischemic stroke lack translational relevance… are baboon models the answer? Neurol. Res. 2014;36:417–422. doi: 10.1179/1743132814Y.0000000358. - DOI - PubMed
    1. Florio M., Huttner W.B. Neural progenitors, neurogenesis and the evolution of the neocortex. Development. 2014;141:2182–2194. doi: 10.1242/dev.090571. - DOI - PubMed
    1. Lemon R.N. Descending Pathways in Motor Control. Annu. Rev. Neurosci. 2008;31:195–218. doi: 10.1146/annurev.neuro.31.060407.125547. - DOI - PubMed

Publication types

Substances

Grants and funding

LinkOut - more resources