

Injury-Induced Innate Immune Response During Segment Regeneration of the Earthworm, Eisenia andrei
- PMID: 33673408
- PMCID: PMC7956685
- DOI: 10.3390/ijms22052363
Injury-Induced Innate Immune Response During Segment Regeneration of the Earthworm, Eisenia andrei
Abstract
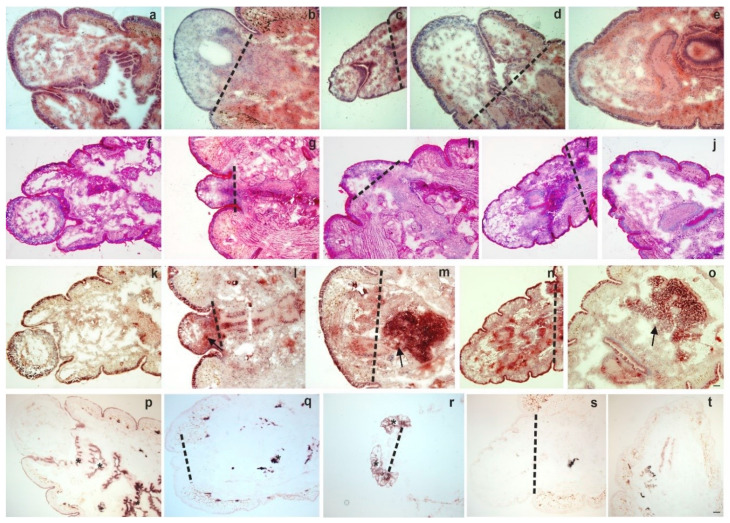
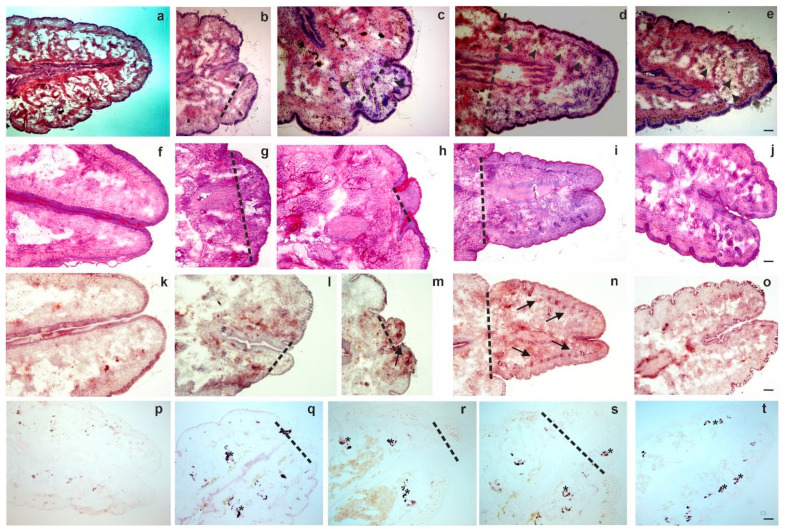
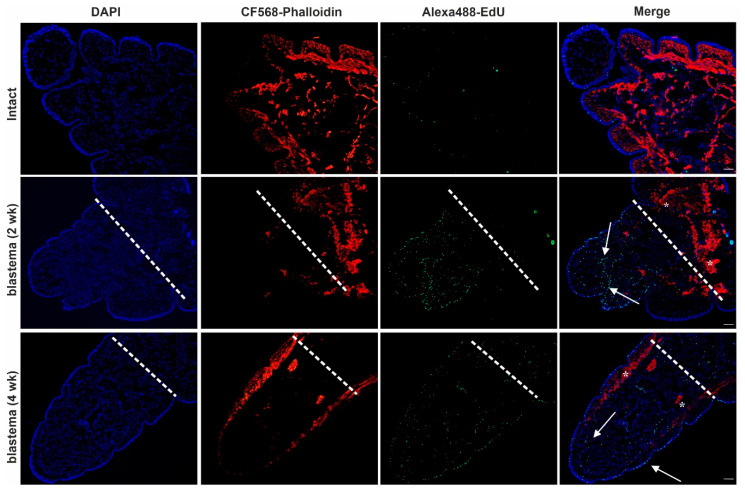
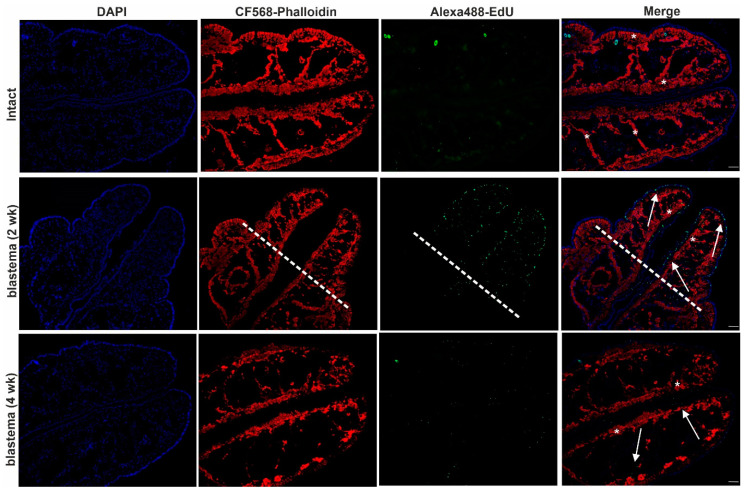
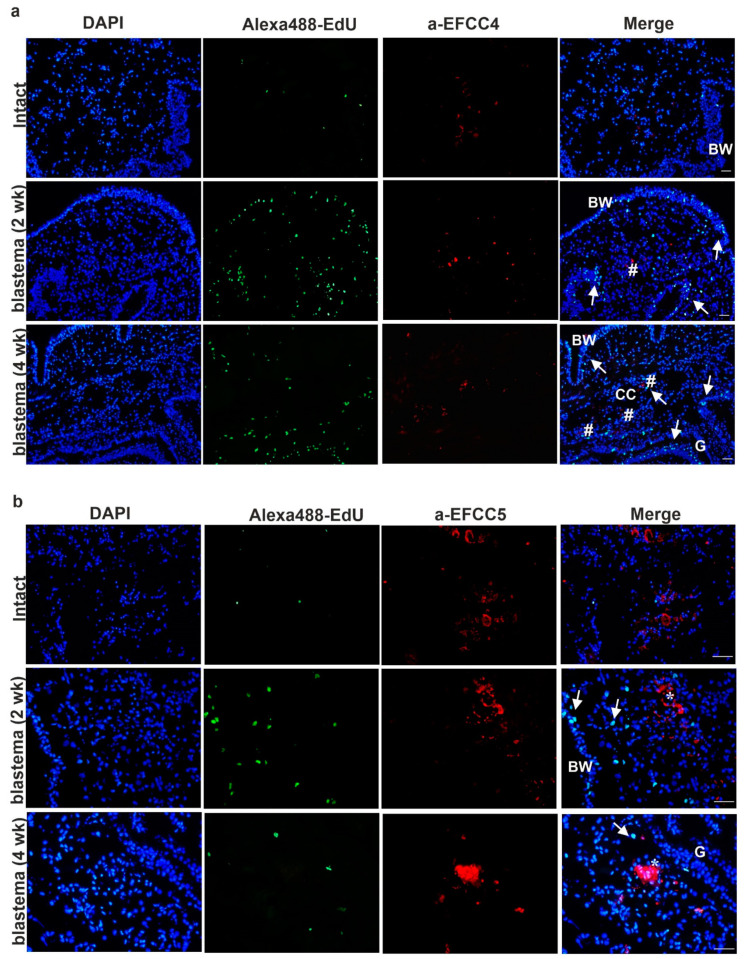
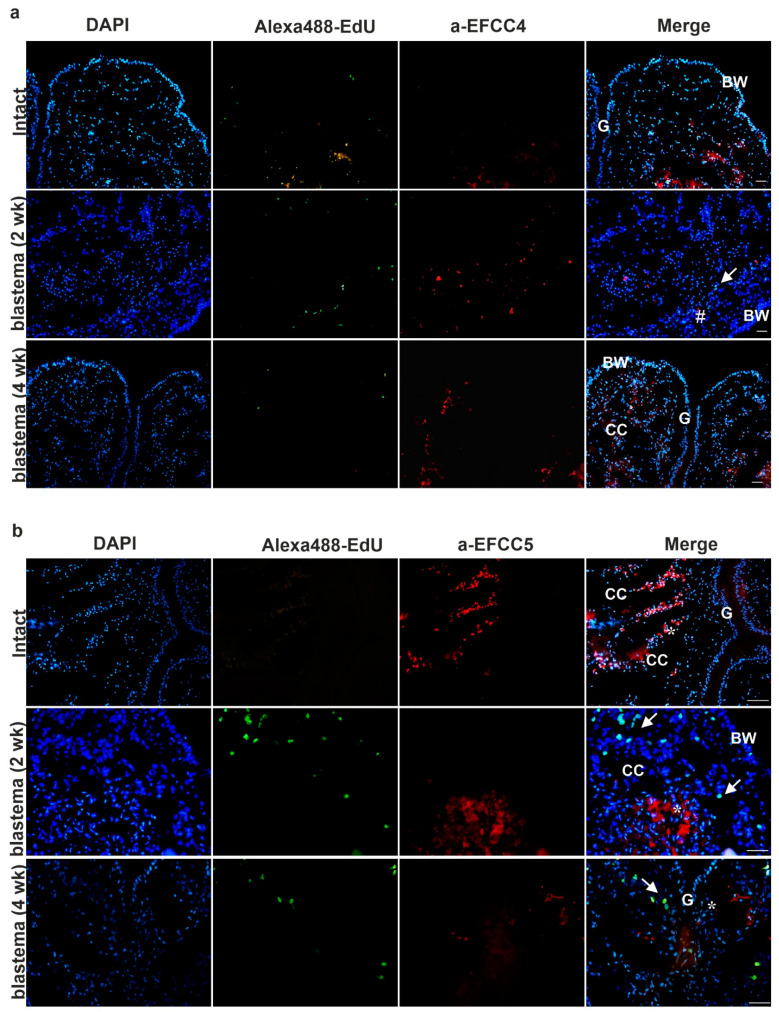
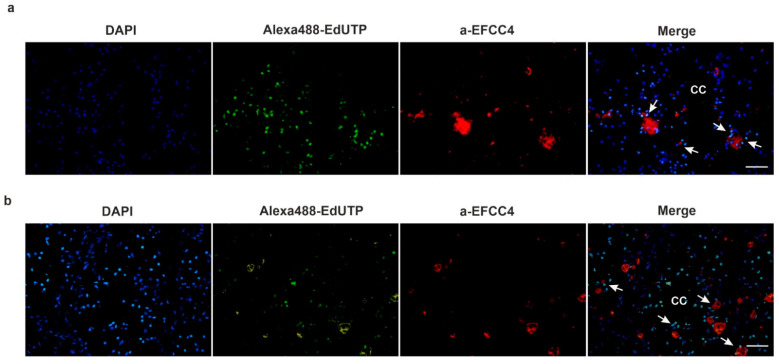
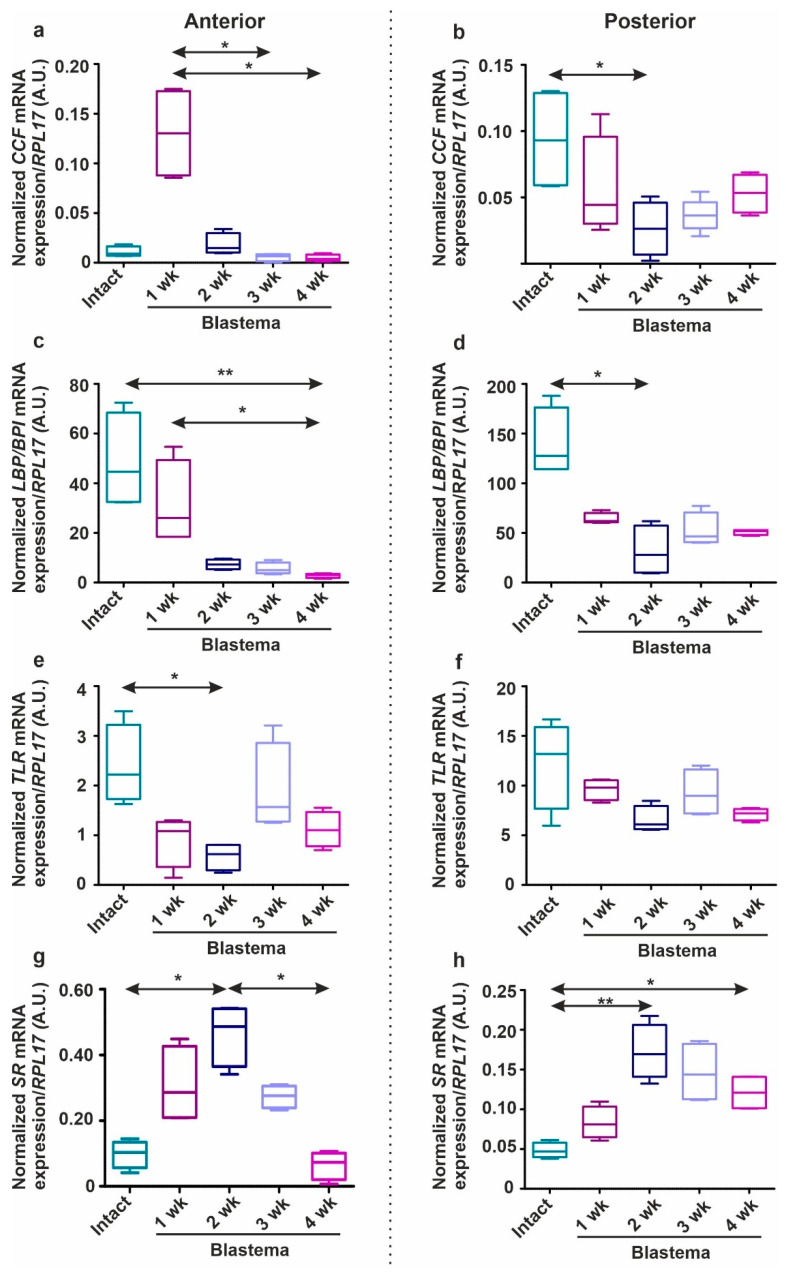
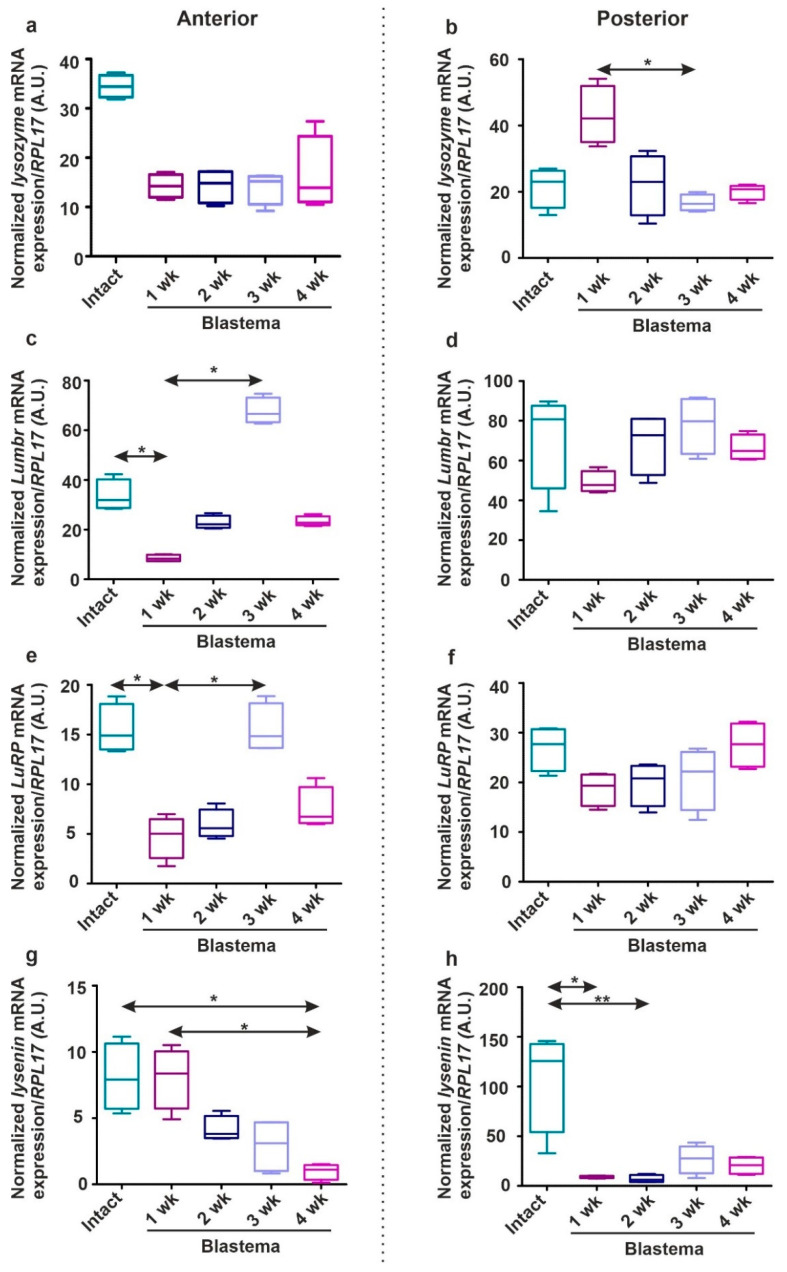
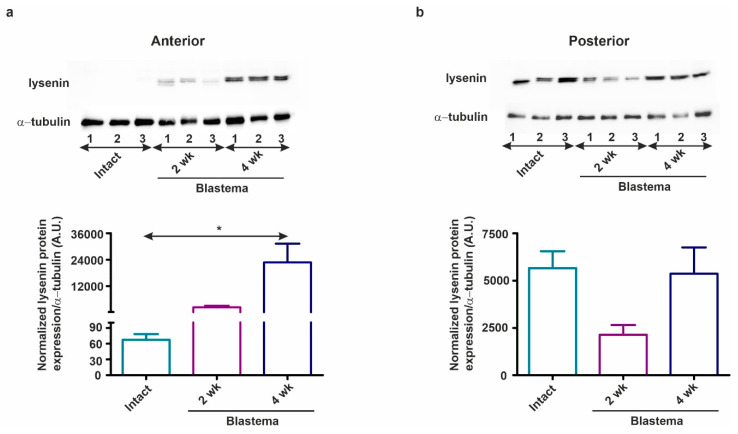
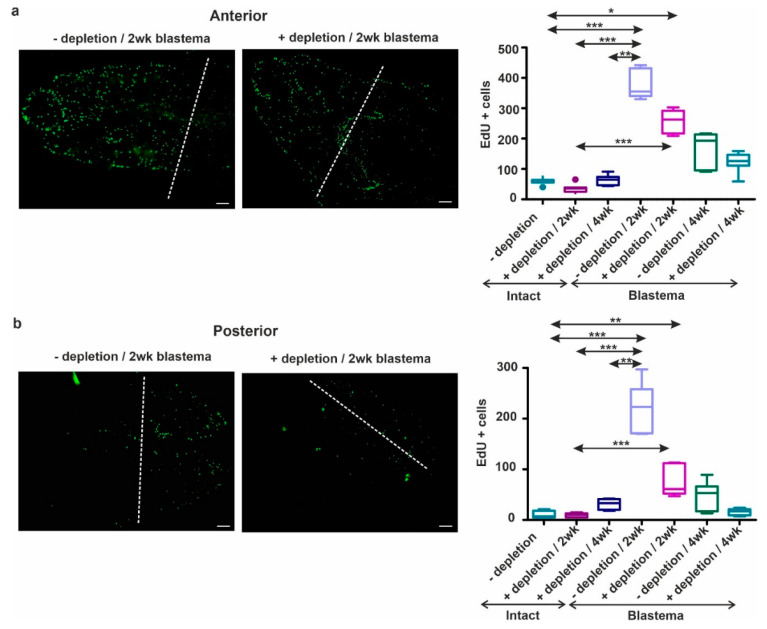
Regeneration of body parts and their interaction with the immune response is a poorly understood aspect of earthworm biology. Consequently, we aimed to study the mechanisms of innate immunity during regeneration in Eisenia andrei earthworms. In the course of anterior and posterior regeneration, we documented the kinetical aspects of segment restoration by histochemistry. Cell proliferation peaked at two weeks and remitted by four weeks in regenerating earthworms. Apoptotic cells were present throughout the cell renewal period. Distinct immune cell (e.g., coelomocyte) subsets were accumulated in the newly-formed blastema in the close proximity of the apoptotic area. Regenerating earthworms have decreased pattern recognition receptors (PRRs) (e.g., TLR, except for scavenger receptor) and antimicrobial peptides (AMPs) (e.g., lysenin) mRNA patterns compared to intact earthworms. In contrast, at the protein level, mirroring regulation of lysenins became evident. Experimental coelomocyte depletion caused significantly impaired cell divisions and blastema formation during anterior and posterior regeneration. These obtained novel data allow us to gain insight into the intricate interactions of regeneration and invertebrate innate immunity.
Keywords: apoptosis; cell proliferation; coelomocytes; earthworm; gene expression; innate immunity; regeneration.
Conflict of interest statement
The authors declare no conflict of interest.
Figures
Similar articles
-
Arginase Activity in Eisenia andrei Coelomocytes: Function in the Earthworm Innate Response.Int J Mol Sci. 2021 Apr 1;22(7):3687. doi: 10.3390/ijms22073687. Int J Mol Sci. 2021. PMID: 33916228 Free PMC article.
-
Microbial environment affects innate immunity in two closely related earthworm species Eisenia andrei and Eisenia fetida.PLoS One. 2013 Nov 1;8(11):e79257. doi: 10.1371/journal.pone.0079257. eCollection 2013. PLoS One. 2013. PMID: 24223917 Free PMC article.
-
Developmental and Immune Role of a Novel Multiple Cysteine Cluster TLR From Eisenia andrei Earthworms.Front Immunol. 2019 Jun 18;10:1277. doi: 10.3389/fimmu.2019.01277. eCollection 2019. Front Immunol. 2019. PMID: 31275304 Free PMC article.
-
Anticipating innate immunity without a Toll.Mol Immunol. 2005 May;42(8):931-42. doi: 10.1016/j.molimm.2004.09.038. Epub 2004 Nov 23. Mol Immunol. 2005. PMID: 15829285 Review.
-
Still waiting for the toll?Immunol Lett. 2006 Apr 15;104(1-2):18-28. doi: 10.1016/j.imlet.2005.11.012. Epub 2005 Dec 5. Immunol Lett. 2006. PMID: 16368151 Review.
Cited by
-
Distinct Uptake Routes Participate in Silver Nanoparticle Engulfment by Earthworm and Human Immune Cells.Nanomaterials (Basel). 2022 Aug 17;12(16):2818. doi: 10.3390/nano12162818. Nanomaterials (Basel). 2022. PMID: 36014683 Free PMC article.
-
Arginase Activity in Eisenia andrei Coelomocytes: Function in the Earthworm Innate Response.Int J Mol Sci. 2021 Apr 1;22(7):3687. doi: 10.3390/ijms22073687. Int J Mol Sci. 2021. PMID: 33916228 Free PMC article.
-
Nature's Secret Neuro-Regeneration Pathway in Axolotls, Polychaetes and Planarians for Human Therapeutic Target Pathways.Int J Mol Sci. 2024 Nov 6;25(22):11904. doi: 10.3390/ijms252211904. Int J Mol Sci. 2024. PMID: 39595973 Free PMC article. Review.
-
Chromosome-level genome assembly and single-cell analysis unveil molecular mechanisms of arm regeneration in the ophiuroid Ophiura sarsii vadicola.Genome Biol. 2025 Mar 31;26(1):82. doi: 10.1186/s13059-025-03542-5. Genome Biol. 2025. PMID: 40165295 Free PMC article.
-
Integrative biology of injury in animals.Biol Rev Camb Philos Soc. 2023 Feb;98(1):34-62. doi: 10.1111/brv.12894. Epub 2022 Sep 29. Biol Rev Camb Philos Soc. 2023. PMID: 36176189 Free PMC article. Review.
References
-
- Engelmann P., Bodó K., Najbauer J., Németh P. Annelida: Oligochaetes (Segmented Worms): Earthworm immunity, quo vadis? Advances and new paradigms in the omics era. In: Cooper E.L., editor. Advances in Comparative Immunology. Springer International Publishing; Heidelberg, Germany: 2018. pp. 135–159.
MeSH terms
Substances
Grants and funding
- 232-15-2106-00050/GINOP
- 361-16-2016-00004/EFOP
- -/Thematic Excellence Program 2020-Institutional Excellence Sub-program of the Ministry of Innovation and Technology, Hungary
- PTE-ÁOK-KA 2017/04, 2020/14/Medical School Research Foundation University of Pécs
- -/ÚNKP-19-3-I New National Excellence Program of the Ministry for Innovation and Technology
LinkOut - more resources
Full Text Sources
Other Literature Sources
Medical
