Review
. 2021 Feb 27;13(5):730.
doi: 10.3390/polym13050730.

Towards the Development of Portable and In Situ Optical Devices for Detection of Micro and Nanoplastics in Water: A Review on the Current Status

Affiliations
Review

Towards the Development of Portable and In Situ Optical Devices for Detection of Micro and Nanoplastics in Water: A Review on the Current Status

Benjamin O Asamoah et al. Polymers (Basel). .

Abstract

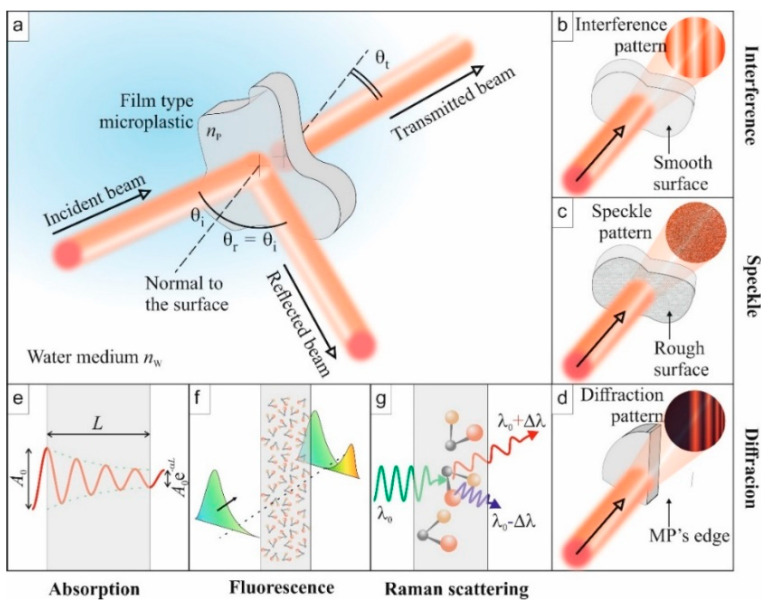
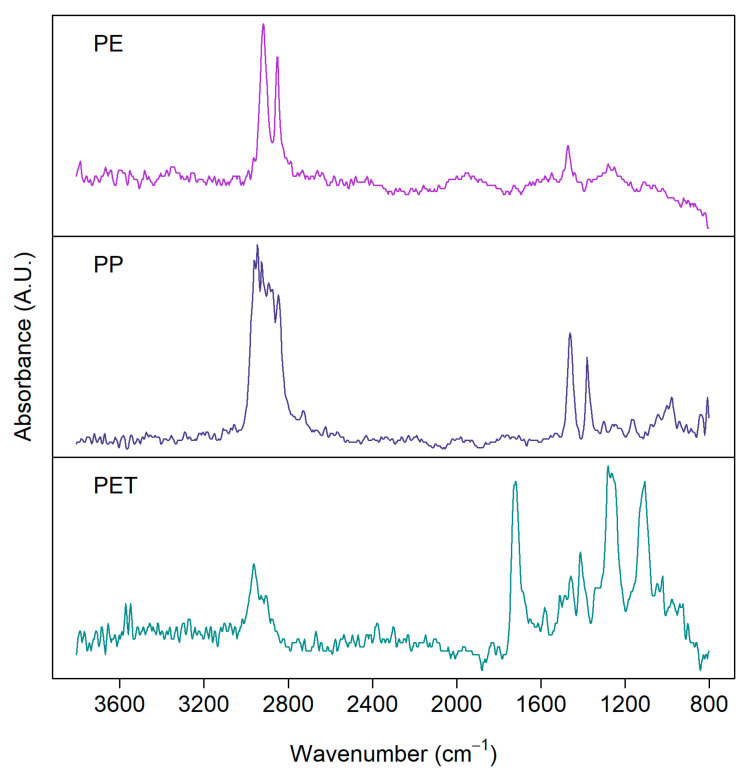
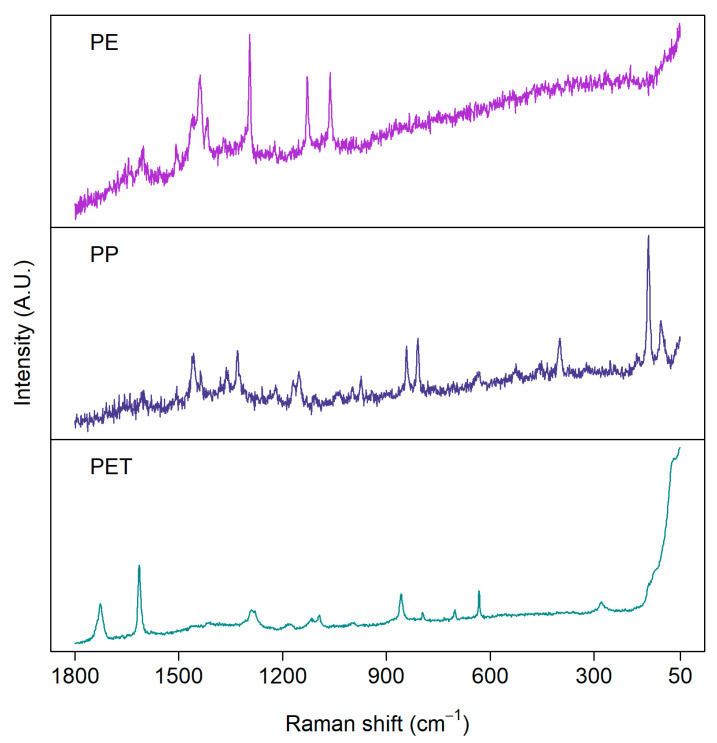
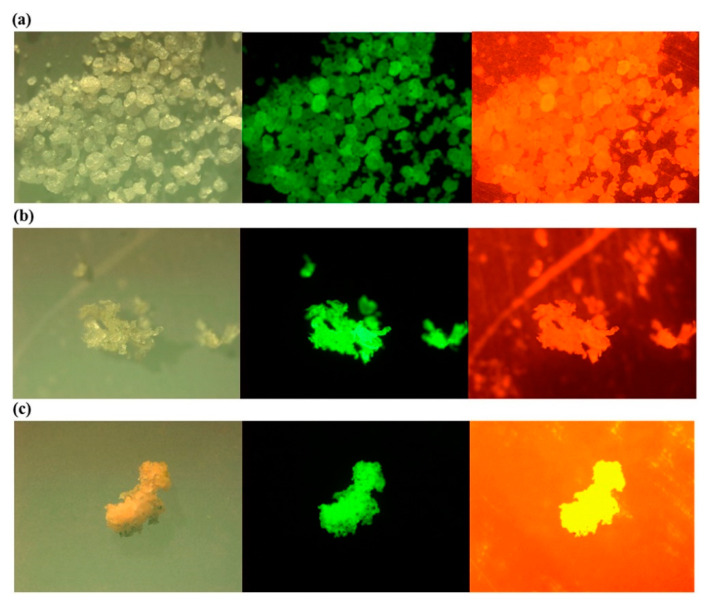
The prevalent nature of micro and nanoplastics (MP/NPs) on environmental pollution and health-related issues has led to the development of various methods, usually based on Fourier-transform infrared (FTIR) and Raman spectroscopies, for their detection. Unfortunately, most of the developed techniques are laboratory-based with little focus on in situ detection of MPs. In this review, we aim to give an up-to-date report on the different optical measurement methods that have been exploited in the screening of MPs isolated from their natural environments, such as water. The progress and the potential of portable optical sensors for field studies of MPs are described, including remote sensing methods. We also propose other optical methods to be considered for the development of potential in situ integrated optical devices for continuous detection of MPs and NPs. Integrated optical solutions are especially necessary for the development of robust portable and in situ optical sensors for the quantitative detection and classification of water-based MPs.

Keywords: freshwater; in situ detection; micro and nanoplastics; optical detection; portable devices; sludge.


Conflict of interest statement

The authors declare no conflict of interest.

Figures

Figure 1
Figure 1
Illustration of some optical phenomena to be exploited for the identification of microplastic (MP) properties. (a) Overview of a standard experiment: the incident light is reflected, transmitted, and absorbed. (b) Interference: If the MP has two smooth surfaces, multiple reflections inside the film lead to an interferogram. (c) Speckle: Rough surfaces will generate a speckle originating from multiple interferences. (d) Diffraction: edges of the MP particles can diffract light beams to create organized patterns. (e) Absorption: the output amplitude is lower than the incident one. (f) Fluorescence: absorbed light energy is re-emitted at other wavelengths when molecules relax. (g) Raman scattering: specific light frequencies excite vibrational states of molecules, which lead to the emission of secondary photons at a slightly shifted frequency (Stokes and anti-Stokes).
Figure 2
Figure 2
FTIR spectra of microplastics detected from environmental samples: polyethylene (PE), polypropylene (PP), polyethylene terephthalate (PET). Samples were measured with a focal plane array (FPA) detector in reflection mode from silver membrane filters.
Figure 3
Figure 3
Examples of Raman spectra of microplastics measured from environmental samples: polyethylene (PE), polypropylene (PP), and polyethylene terephthalate (PET). Samples were measured with a 785 nm laser from aluminum oxide (Anodisc) filters.
Figure 4
Figure 4
(a) Influence of surface roughness on the transmittance of film-type MPs, with a rough surface on both sides, in water [24]. MPs were prepared from polyethylene terephthalate (PET) plastic roughened with different sandpaper grits, 1200, 600, and 320, to achieve average surface roughness values of 0.34 μm, 0.60 μm, and 1.10 μm, respectively. The transmittance of the MPs nonlinearly decreases with increasing average surface roughness over the whole spectral range. (b) Difference in transmittance (ΔT) between the pure ethanol only and ethanol-containing MPs from a real sludge sample [submitted elsewhere]. It allows the immediate authentication of characteristic peaks of certain plastics in an extremely complex environment: polystyrene (PS, λ = 1158 nm), polyethylene (PE, λ = 1396 nm), and polyethylene terephthalate (PET, λ = 1660 nm).
Figure 5
Figure 5
Photos under a microscope (left), a fluorescence microscope with excitation and emission wavelength of 534–558 and 515–565 nm (middle); and 534–558 and >590 nm (right) for the Nile Red stained low density (a) polyethylene (LDPE); (b) polypropylene (PP); (c) expanded polystyrene (EPS) Reprinted from Marine Pollution Bulletin, 113, Shim, W.J.; Song, Y.K.; Hong, S.H.; Jang, M., Identification and Quantification of Microplastics Using Nile Red Staining, 469–476. [93], Copyright (2016), with permission from Elsevier.
Figure 6
Figure 6
An overview of SISUChema XL™ Chemical Workstation (Specim, Finland) Reprinted from Waste Management, 76, Serranti, S.; Palmieri, R.; Bonifazi, G.; Cózar, A. Charac-terization of Microplastic Litter from Oceans by an Innovative Approach Based on Hyperspectral Imaging, 117–125. [104], Copyright (2020), with permission from Elsevier.
Figure 7
Figure 7
Portable devices: (a) FTIR—Thermo Fisher Scientific; (b) Raman—BioTools RamTest; (c) Gemini-combined Raman and FT-IR handheld analyzer—Thermo Fisher Scientific; (d) HI-BaySpec’s GoldenEye. Reprinted from Applied Spectroscopy, 72, Crocombe, R.A. Portable Spectroscopy, 1701–1751. [69], Copyright (2018), with permission from SAGE Publications
Figure 8
Figure 8
(a) Image of a handheld optical sensor for MP detection [117]; (b) optical measurement setup. The diffractive optical element (DOE) spatially filters the reflected light signal to obtain the specular component of the light signal on the photodiode (PD). The speckle pattern is measured by the CCD camera Reprinted from Chemosphere, 254, Asamoah, B.O.; Roussey, M.; Peiponen, K. On Optical Sensing of Surface Roughness of Flat and Curved Microplastics in Water, 126789. [23], Copyright (2020), with permission from Elsevier.
Figure 9
Figure 9
(a) Recorded interference pattern for transparent and smooth PET MP [21]; speckle pattern of similar MP with a rough surface [23]; (b) using the handheld optical sensor. Identification of MPs in ethanol; (c) time-dependent speckle contrast calculated for pure ethanol only and ethanol-containing MPs (FEMPs) on a rough glass disk using a handheld optical sensor; (d) time-dependent transmittance signal from ethanol containing MPs at a fixed wavelength (800 nm) using a spectrophotometer. Figure 9a Reprinted from Chemosphere, 231, Asamoah, B.O.; Kanyathare, B.; Roussey, M.; Peiponen, K.E. A Prototype of a Portable Optical Sensor for the Detection of Transparent and Translucent Microplastics in Freshwater, 161–167. [21], Copyright (2019), with permission from Elsevier; Figure 9b Reprinted from Chemosphere, 254, Asamoah, B.O.; Roussey, M.; Peiponen, K. On Optical Sensing of Surface Roughness of Flat and Curved Microplastics in Water, 126789. [23], Copyright (2020), with permission from Elsevier.
Figure 10
Figure 10
Scheme of the photoluminescence (PL) setup. The blue and red arrows indicate the propagation direction of laser and photoluminescence light, respectively Reprinted from Applied Physics B: Lasers and Optics, 126, Ornik, J.; Sommer, S.; Gies, S.; Weber, M.; Lott, C.; Balzer, J.C.; Koch, M. Could Photoluminescence Spectroscopy Be an Alternative Technique for the Detection of Microplastics? First Experiments Using a 405 Nm Laser for Excitation, 1–7. [70], Copyright (2019), with permission from Springer.
Figure 11
Figure 11
Experimental setup: Col, collimator; BP, bandpass filter; SW, sapphire window; DBS, dichroic beam splitter; AF, attenuation filter; and LP, long pass filter. Trapped particles are probed with holography and Raman techniques [130].
Figure 12
Figure 12
Waveguide-based sensors/detectors. (a) The top surface of a waveguide can be functionalized to attract specific molecules. The exponentially decaying portion of the propagating mode is interacting with the trapped particles, which yields a signal modification; (b) multiple channel waveguides illuminate a sample (which can be very large), which can reflect, deflect, or diffract the beams.

References

    1. Campanale C., Massarelli C., Savino I., Locaputo V., Uricchio V.F. A Detailed Review Study on Potential Effects of Microplastics and Additives of Concern on Human Health. Int. J. Environ. Res. Public Health. 2020;17:1212. doi: 10.3390/ijerph17041212. - DOI - PMC - PubMed
    1. Wang J., Peng J., Tan Z., Gao Y., Zhan Z., Chen Q., Cai L. Microplastics in the Surface Sediments from the Beijiang River Littoral Zone: Composition, Abundance, Surface Textures and Interaction with Heavy Metals. Chemosphere. 2017;171:248–258. doi: 10.1016/j.chemosphere.2016.12.074. - DOI - PubMed
    1. Gong J., Xie P. Research Progress in Sources, Analytical Methods, Eco-Environmental Effects, and Control Measures of Microplastics. Chemosphere. 2020;254:126790. doi: 10.1016/j.chemosphere.2020.126790. - DOI - PubMed
    1. Derraik J.G.B. The Pollution of the Marine Environment by Plastic Debris: A Review. Mar. Pollut. Bull. 2002;44:842–852. doi: 10.1016/S0025-326X(02)00220-5. - DOI - PubMed
    1. Mao Y., Li H., Huangfu X., Liu Y., He Q. Nanoplastics Display Strong Stability in Aqueous Environments: Insights from Aggregation Behaviour and Theoretical Calculations. Environ. Pollut. 2020;258:113760. doi: 10.1016/j.envpol.2019.113760. - DOI - PubMed

Grants and funding

LinkOut - more resources