. 2021 Feb 27;13(3):788.
doi: 10.3390/nu13030788.

High-Intensity Interval Training and α-Linolenic Acid Supplementation Improve DHA Conversion and Increase the Abundance of Gut Mucosa-Associated Oscillospira Bacteria

Affiliations

High-Intensity Interval Training and α-Linolenic Acid Supplementation Improve DHA Conversion and Increase the Abundance of Gut Mucosa-Associated Oscillospira Bacteria

Claire Plissonneau et al. Nutrients. .

Abstract

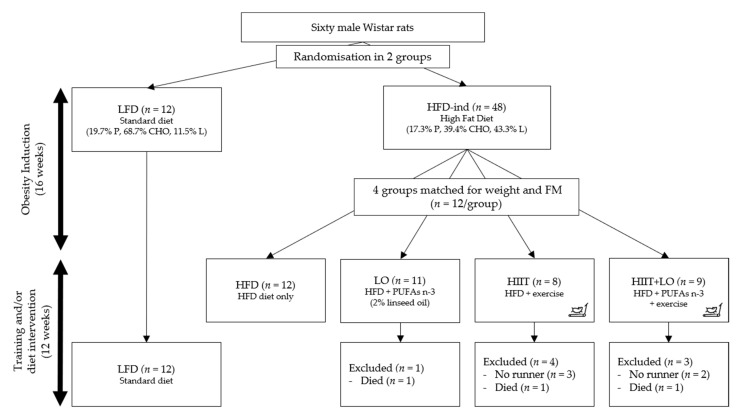
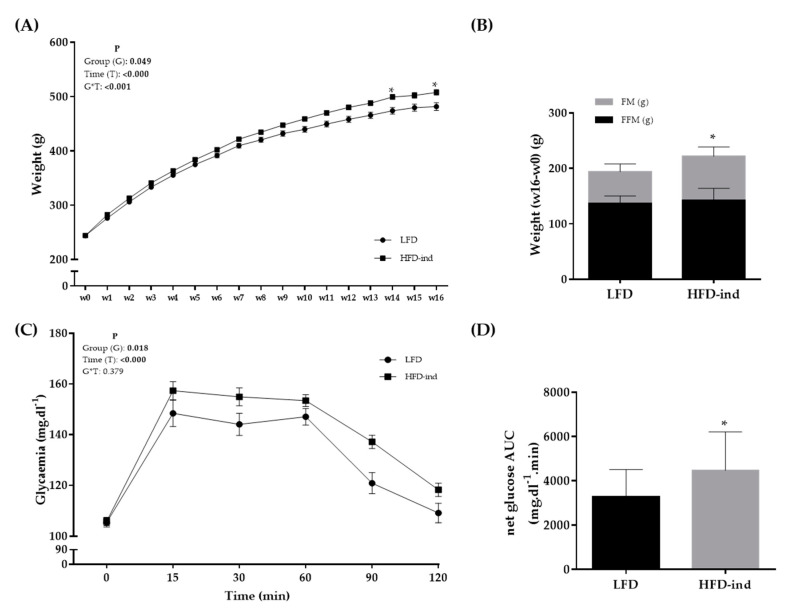
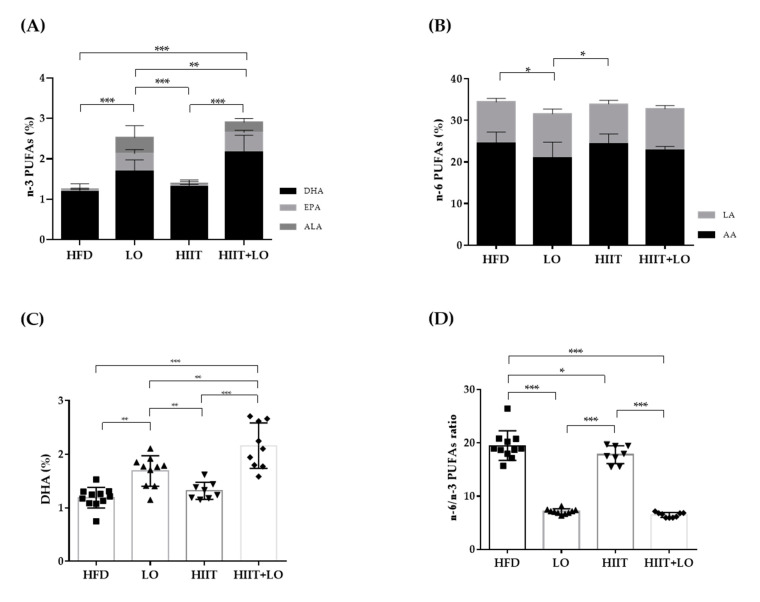
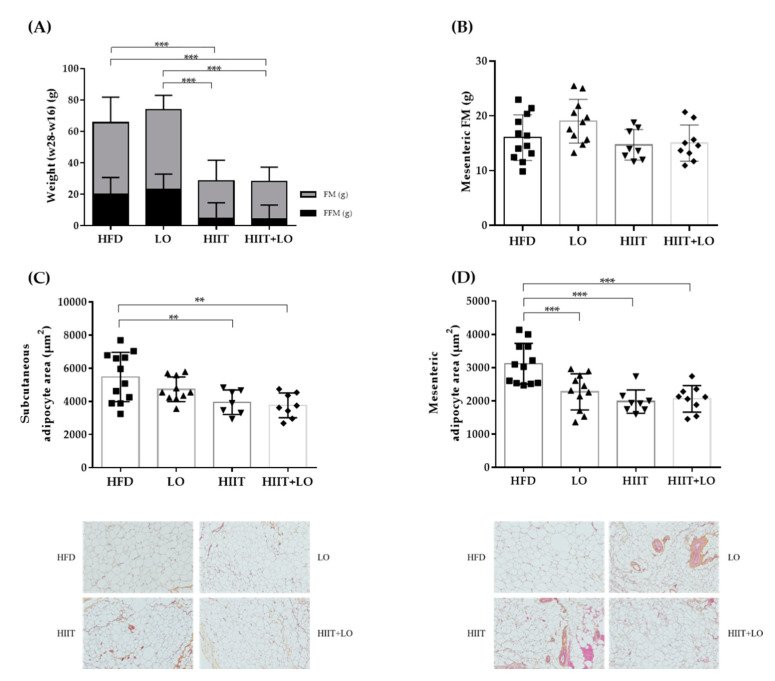
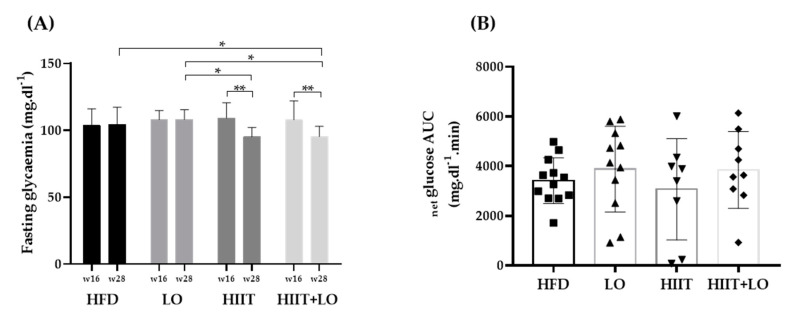
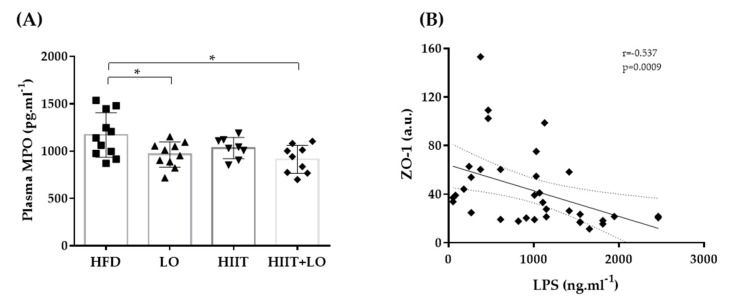
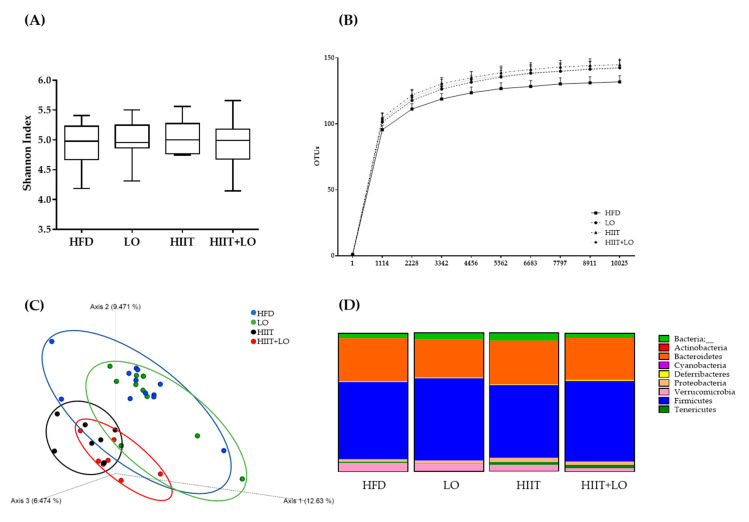
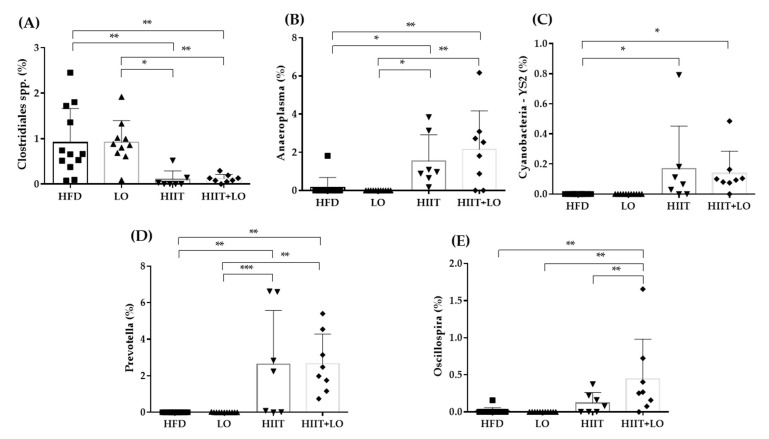
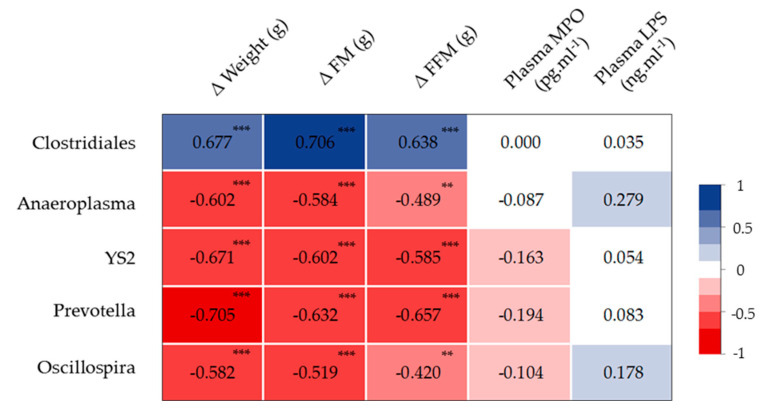
Obesity, a major public health problem, is the consequence of an excess of body fat and biological alterations in the adipose tissue. Our aim was to determine whether high-intensity interval training (HIIT) and/or α-linolenic acid supplementation (to equilibrate the n-6/n-3 polyunsaturated fatty acids (PUFA) ratio) might prevent obesity disorders, particularly by modulating the mucosa-associated microbiota. Wistar rats received a low fat diet (LFD; control) or high fat diet (HFD) for 16 weeks to induce obesity. Then, animals in the HFD group were divided in four groups: HFD (control), HFD + linseed oil (LO), HFD + HIIT, HFD + HIIT + LO. In the HIIT groups, rats ran on a treadmill, 4 days.week-1. Erythrocyte n-3 PUFA content, body composition, inflammation, and intestinal mucosa-associated microbiota composition were assessed after 12 weeks. LO supplementation enhanced α-linolenic acid (ALA) to docosahexaenoic acid (DHA) conversion in erythrocytes, and HIIT potentiated this conversion. Compared with HFD, HIIT limited weight gain, fat mass accumulation, and adipocyte size, whereas LO reduced systemic inflammation. HIIT had the main effect on gut microbiota β-diversity, but the HIIT + LO association significantly increased Oscillospira relative abundance. In our conditions, HIIT had a major effect on body fat mass, whereas HIIT + LO improved ALA conversion to DHA and increased the abundance of Oscillospira bacteria in the microbiota.

Keywords: body composition; exercise; linseed oil supplementation; microbiota.


Conflict of interest statement

The authors declare no conflict of interest.

Figures

Figure 1
Figure 1
Study design. Rats were randomized in two groups: LFD (n = 12) and HFD (n = 48) for 16 weeks (phase 1). After this period, the HFD group was divided in four groups (n = 12/group) matched for weight and fat mass: HFD, LO, HIIT, and HIIT + LO for 12 weeks (phase 2). In the HIIT and HIIT + LO groups, “no runner” rats were excluded from the study. LFD: low-fat diet, HFD-ind: high-fat diet induction, HFD: high-fat diet, LO: linseed oil, HIIT: high-intensity interval training, FM: fat mass, PUFAs: polyunsaturated fatty acids, P: proteins, CHO: carbohydrates, L: lipids.
Figure 2
Figure 2
Body composition changes and glycemic profile of the LFD (n = 12) and HFD (n = 48) groups at the end of phase 1 (obesity induction with the HFD for 16 weeks). (A) Weight (g) monitoring during phase 1. (B) Weight, fat mass, and fat-free mass changes (w16–w0) in the LFD and HFD groups. (C) Glycemia monitoring during the oral glucose tolerance test (mg.dL−1). (D) NetAUC for glucose (mg.dL−1 min) in the LFD and HFD groups. * p < 0.05. LFD: low-fat diet, HFD: high-fat diet, AUC: area under the curve, FM: fat mass, FFM: fat free mass.
Figure 3
Figure 3
Fatty acid composition in erythrocytes from the four groups: HFD (n = 12), LO (n = 11), HIIT (n = 8), and HIIT+LO (n = 9). (A) n-3 PUFAs (% of total fatty acids), and ALA, EPA, and DHA distribution (%) in erythrocytes. (B) n-6 PUFAs (% of total fatty acids), and LA and AA distribution (%) in erythrocytes. (C) DHA (%) in erythrocytes. (D) n-6/n-3 PUFAs ratio in erythrocytes. * p < 0.05, ** p < 0.01, *** p < 0.001; PUFAs: polyunsaturated fatty acids, LA: linoleic acid (C18:2 n-6), AA: arachidonic acid (C22:4 n-6), ALA: α-linolenic acid (C18:3 n-3), EPA: eicosapentaenoic acid (C20:5 n-3), DHA: docosahexaenoic acid (C22:6 n-3).
Figure 4
Figure 4
Body composition and adipocyte profiles in the four rat groups: HFD (n = 12), LO (n = 11), HIIT (n = 8), and HIIT + LO (n = 9) at the end of phase 2 (training and/or LO supplementation for 12 weeks). (A) Weight, fat mass (FM) and fat-free mass (FFM) changes (week 28–week 16) in the four groups (B) mesenteric fat mass (FM; g) in the four groups. (C) Subcutaneous and (D) mesenteric adipocyte area (µm2) in the four groups. ** p < 0.01 and *** p < 0.001.
Figure 5
Figure 5
Fasting glycemia and net glucose AUC during the oral glucose tolerance test at week 28 (end of phase 2) in the four groups: HFD (n = 12), LO (n = 11), HIIT (n = 8), and HIIT+LO (n = 9). (A) Fasting glycemia (mg.dL−1) at week 16 and week 28 in the four groups. (B) Net glucose AUC (mg.dL−1.min−1) at week 28. AUC: Area under the curve. * p < 0.05, ** p < 0.01.
Figure 6
Figure 6
(A) Plasma myeloperoxidase (MPO) levels in the four groups and (B) correlation of lipopolysaccharide (LPS) and ZO-1: HFD (n = 12), LO (n = 11), HIIT (n = 8), and HIIT + LO (n = 9) at the end of phase 2 (training and/or LO supplementation for 12 weeks). * p < 0.05.
Figure 7
Figure 7
Mucosa-associated microbiota composition analyzed by 16S rRNA gene sequencing in colon DNA samples (Illumina MiSeq system) from the four groups: HFD (n = 12), LO (n = 11), HIIT (n = 7), and HIIT + LO (n = 8) at the end of phase 2 (training and/or LO supplementation for 12 weeks). (A) Shannon index, (B) operational taxonomic units (OTUs) with a rarefaction depth of 10,025 sequences, (C) unweighted UniFrac analysis, and (D) phylum distribution (%).
Figure 8
Figure 8
Relative abundance (%) of specific bacterial types in the mucosa-associated microbiota of the four groups: Clostridiales spp (A), Anaeroplasma (B), Cyanobacteria YS2 (C), Prevotella (D), Oscillospira. (E). HFD (n = 12), LO (n = 11), HIIT (n = 7), and HIIT + LO (n = 8) at the end of phase 2 (training and/or LO supplementation for 12 weeks). * p < 0.05, ** p < 0.01, *** p < 0.001.
Figure 9
Figure 9
Heat map showing the association between the abundance of the indicated microbiota components, body composition, plasma myeloperoxidase (MPO), and LPS concentration. ** p < 0.01, *** p < 0.001. ΔFM and ΔFFM, changes in fat mass and fat-free mass between week 28 and week 16, respectively. Color scale indicates positive (blue) to negative (red) correlation.

Similar articles

Cited by

References

    1. WHO Fact Sheet: Obesity and Overweight 2016. [(accessed on 23 March 2018)]; Available online: http://www.who.int/mediacentre/factsheets/fs311/en/
    1. Esser N., Legrand-Poels S., Piette J., Scheen A.J., Paquot N. Inflammation as a Link between Obesity, Metabolic Syndrome and Type 2 Diabetes. Diabetes Res. Clin. Pract. 2014;105:141–150. doi: 10.1016/j.diabres.2014.04.006. - DOI - PubMed
    1. Després J.-P., Lemieux I. Abdominal Obesity and Metabolic Syndrome. Nature. 2006;444:881–887. doi: 10.1038/nature05488. - DOI - PubMed
    1. Gregor M.F., Hotamisligil G.S. Inflammatory Mechanisms in Obesity. Annu. Rev. Immunol. 2011;29:415–445. doi: 10.1146/annurev-immunol-031210-101322. - DOI - PubMed
    1. Jakicic J.M., Rogers R.J., Davis K.K., Collins K.A. Role of Physical Activity and Exercise in Treating Patients with Overweight and Obesity. Clin. Chem. 2018;64:99–107. doi: 10.1373/clinchem.2017.272443. - DOI - PubMed

MeSH terms

LinkOut - more resources