

Conditional power of antidepressant network meta-analysis
- PMID: 33673822
- PMCID: PMC7934491
- DOI: 10.1186/s12888-021-03094-5
Conditional power of antidepressant network meta-analysis
Abstract
Background: Conditional power of network meta-analysis (NMA) can support the planning of randomized controlled trials (RCTs) assessing medical interventions. Conditional power is the probability that updating existing inconclusive evidence in NMA with additional trial(s) will result in conclusive evidence, given assumptions regarding trial design, anticipated effect sizes, or event probabilities.
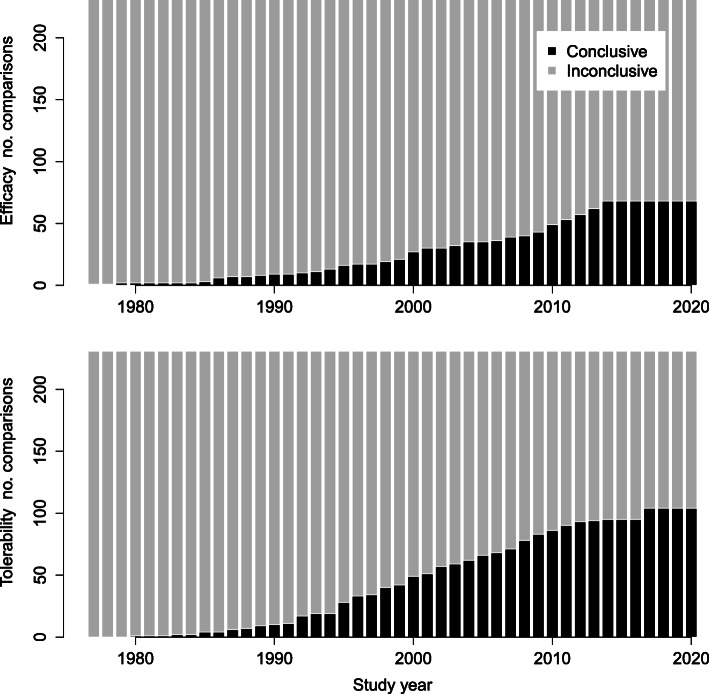
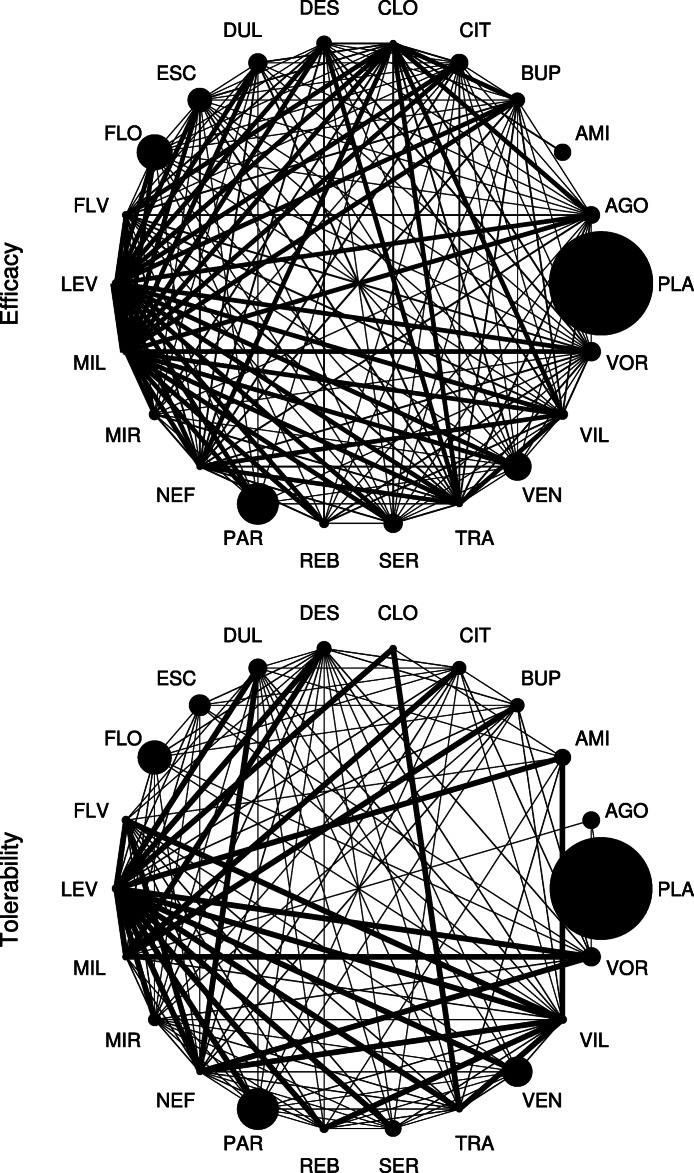
Methods: The present work aimed to estimate conditional power for potential future trials on antidepressant treatments. Existing evidence was based on a published network of 502 RCTs conducted between 1979-2018 assessing acute antidepressant treatment in major depressive disorder (MDD). Primary outcomes were efficacy in terms of the symptom change on the Hamilton Depression Scale (HAMD) and tolerability in terms of the dropout rate due to adverse events. The network compares 21 antidepressants consisting of 231 relative treatment comparisons, 164 (efficacy) and 127 (tolerability) of which are currently assumed to have inconclusive evidence.
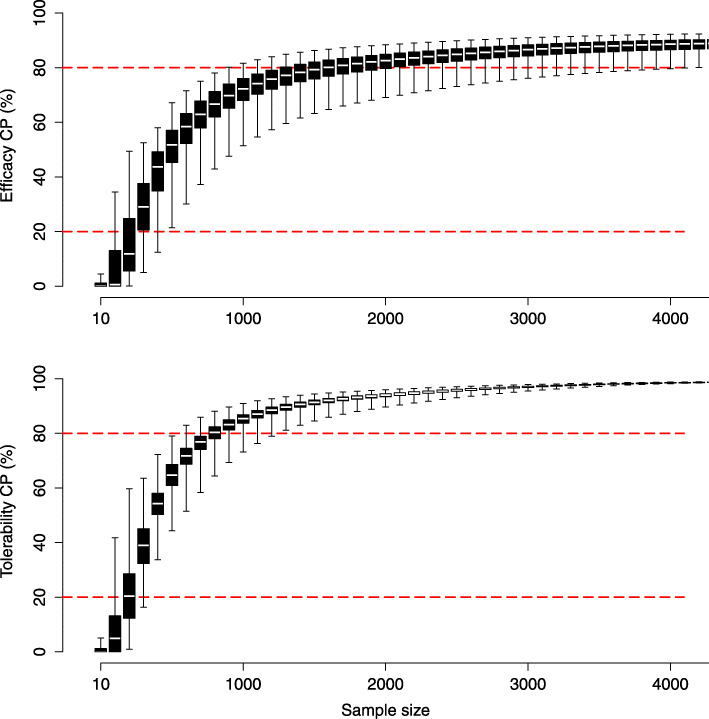
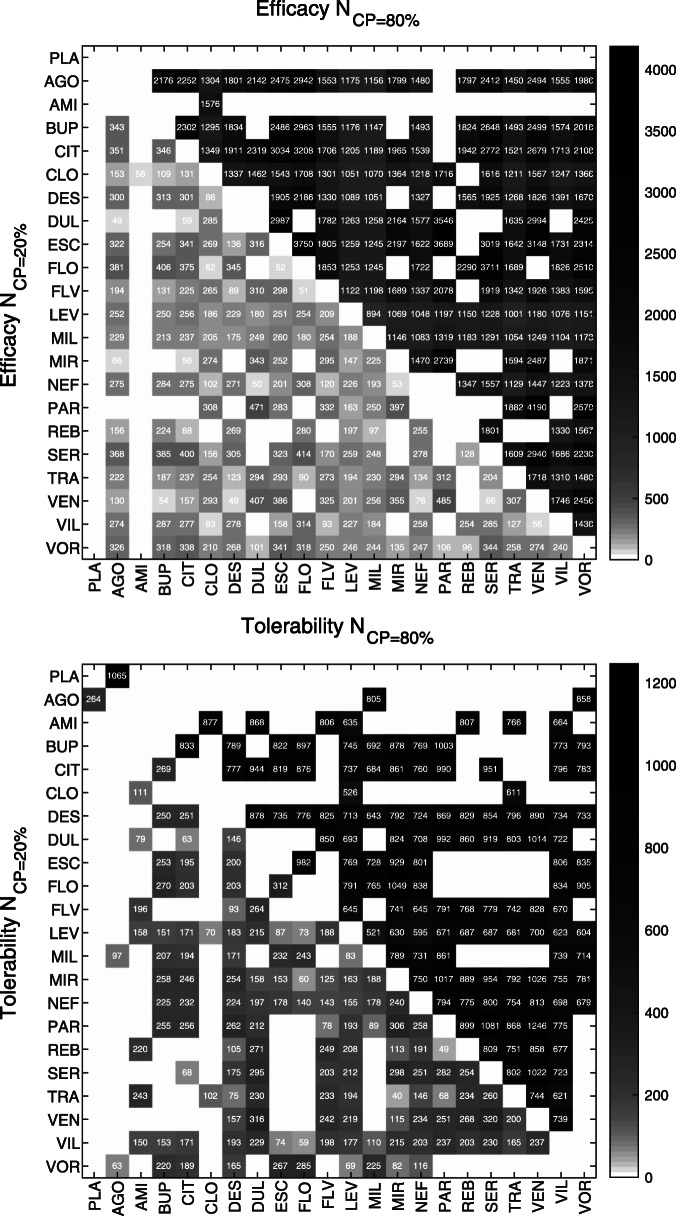
Results: Required sample sizes to achieve new conclusive evidence with at least 80% conditional power were estimated to range between N = 894 - 4190 (efficacy) and N = 521 - 1246 (tolerability). Otherwise, sample sizes ranging between N = 49 - 485 (efficacy) and N = 40 - 320 (tolerability) may require stopping for futility based on a boundary at 20% conditional power. Optimizing trial designs by considering multiple trials that contribute both direct and indirect evidence, anticipating alternative effect sizes or alternative event probabilities, may increase conditional power but required sample sizes remain high. Antidepressants having the greatest conditional power associated with smallest required sample sizes were identified as those on which current evidence is low, i.e., clomipramine, levomilnacipran, milnacipran, nefazodone, and vilazodone, with respect to both outcomes.
Conclusions: The present results suggest that conditional power to achieve new conclusive evidence in ongoing or future trials on antidepressant treatments is low. Limiting the use of the presented conditional power analysis are primarily due to the estimated large sample sizes which would be required in future trials as well as due to the well-known small effect sizes in antidepressant treatments. These findings may inform researchers and decision-makers regarding the clinical relevance and justification of research in ongoing or future antidepressant RCTs in MDD.
Keywords: Antidepressants; Conclusive evidence; Conditional power; Network meta-analysis; Sample size.
Conflict of interest statement
The author declares that she has no competing interests.
Figures
Similar articles
-
The future of Cochrane Neonatal.Early Hum Dev. 2020 Nov;150:105191. doi: 10.1016/j.earlhumdev.2020.105191. Epub 2020 Sep 12. Early Hum Dev. 2020. PMID: 33036834
-
Antidepressants for people with epilepsy and depression.Cochrane Database Syst Rev. 2021 Apr 16;4(4):CD010682. doi: 10.1002/14651858.CD010682.pub3. Cochrane Database Syst Rev. 2021. PMID: 33860531 Free PMC article.
-
Quetiapine monotherapy in acute phase for major depressive disorder: a meta-analysis of randomized, placebo-controlled trials.BMC Psychiatry. 2012 Sep 27;12:160. doi: 10.1186/1471-244X-12-160. BMC Psychiatry. 2012. PMID: 23017200 Free PMC article.
-
Antidepressants for the treatment of depression in people with cancer.Cochrane Database Syst Rev. 2023 Mar 31;3(3):CD011006. doi: 10.1002/14651858.CD011006.pub4. Cochrane Database Syst Rev. 2023. PMID: 36999619 Free PMC article. Review.
-
Comparative effectiveness of continuation and maintenance treatments for persistent depressive disorder in adults.Cochrane Database Syst Rev. 2019 May 20;5(5):CD012855. doi: 10.1002/14651858.CD012855.pub2. Cochrane Database Syst Rev. 2019. PMID: 31106850 Free PMC article.
Cited by
-
OssaNMA: An R package for using information from network meta-analyses to optimize the power and sample allocation of a new two-arm trial.PLoS One. 2023 Dec 21;18(12):e0296020. doi: 10.1371/journal.pone.0296020. eCollection 2023. PLoS One. 2023. PMID: 38128003 Free PMC article.
References
-
- De Meulemeester J, Fedyk M, Jurkovic L, Reaume M, Dowlatshahi D, Stotts G, Shamy M. Many randomized clinical trials may not be justified: a cross-sectional analysis of the ethics and science of randomized clinical trials. J Clin Epidemiol. 2018;97:20–5. doi: 10.1016/j.jclinepi.2017.12.027. - DOI - PubMed
Publication types
MeSH terms
Substances
LinkOut - more resources
Full Text Sources
Other Literature Sources
Medical
