. 2021 Mar 5;40(1):89.
doi: 10.1186/s13046-021-01883-0.

TP53 drives abscopal effect by secretion of senescence-associated molecular signals in non-small cell lung cancer

Affiliations

TP53 drives abscopal effect by secretion of senescence-associated molecular signals in non-small cell lung cancer

Anna Tesei et al. J Exp Clin Cancer Res. .

Abstract

Background: Recent developments in abscopal effect strongly support the use of radiotherapy for the treatment of metastatic disease. However, deeper understanding of the molecular mechanisms underlying the abscopal effect are required to best benefit a larger proportion of patients with metastasis. Several groups including ours, reported the involvement of wild-type (wt) p53 in radiation-induced abscopal effects, however very little is known on the role of wtp53 dependent molecular mechanisms.

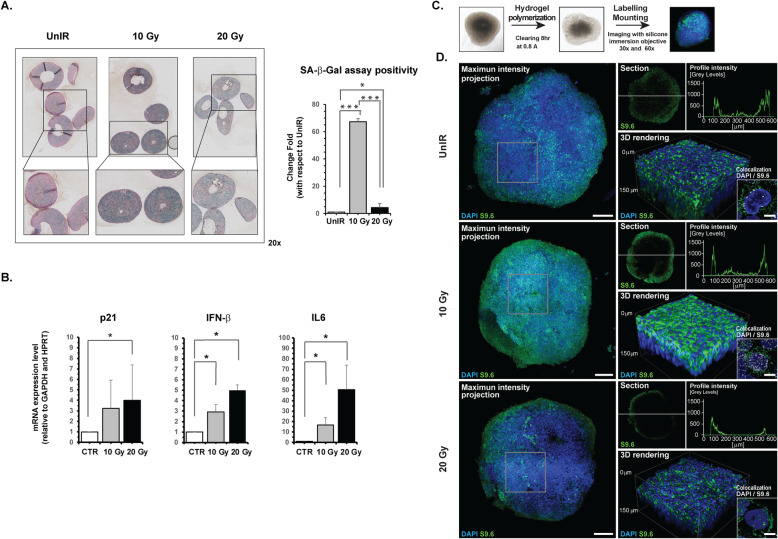
Methods: We investigated through in vivo and in vitro approaches how wtp53 orchestrates radiation-induced abscopal effects. Wtp53 bearing (A549) and p53-null (H1299) NSCLC lines were xenotransplanted in nude mice, and cultured in 2D monolayers and 3D tumor spheroids. Extracellular vesicles (EVs) were isolated from medium cell culture by ultracentrifugation protocol followed by Nanoparticle Tracking Analysis. Gene expression was evaluated by RT-Real Time, digital qRT-PCR, and dot blot technique. Protein levels were determined by immunohistochemistry, confocal anlysis, western blot techniques, and immunoassay.

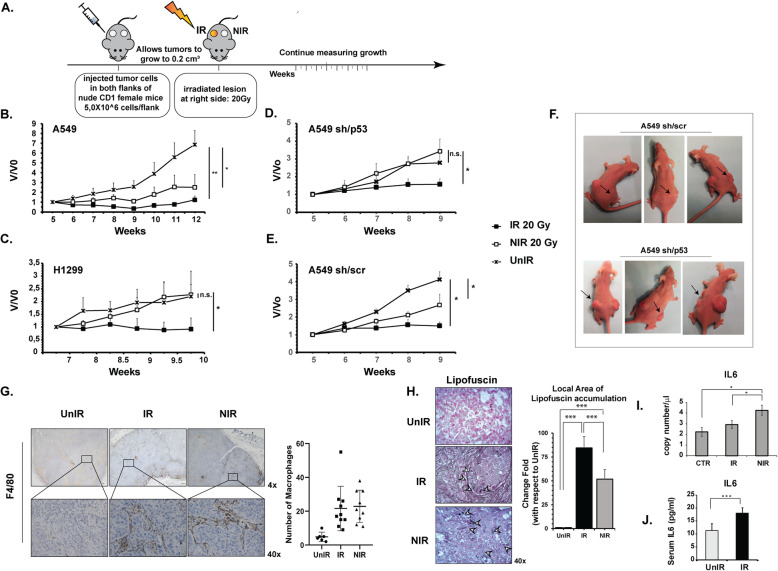
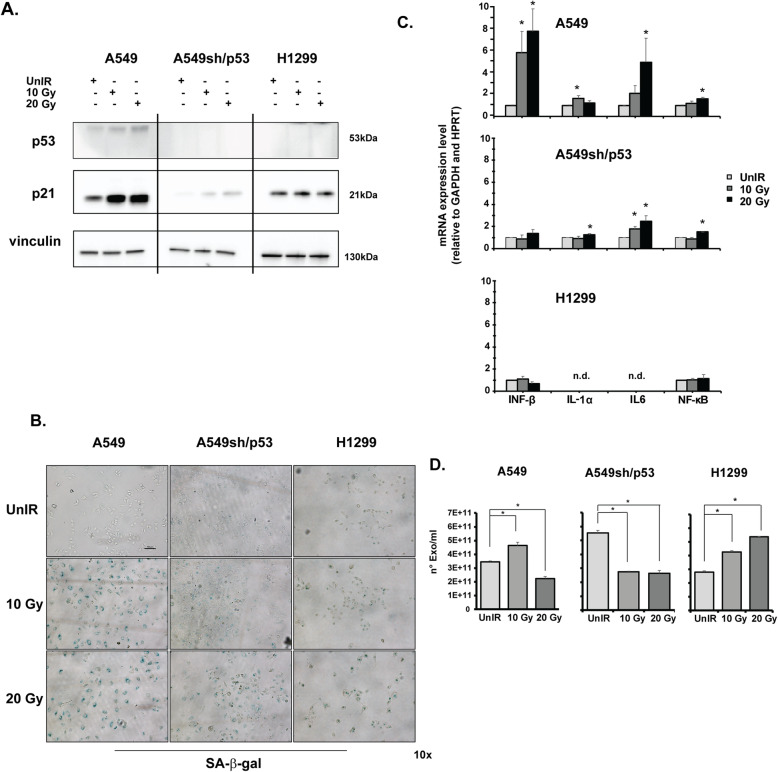
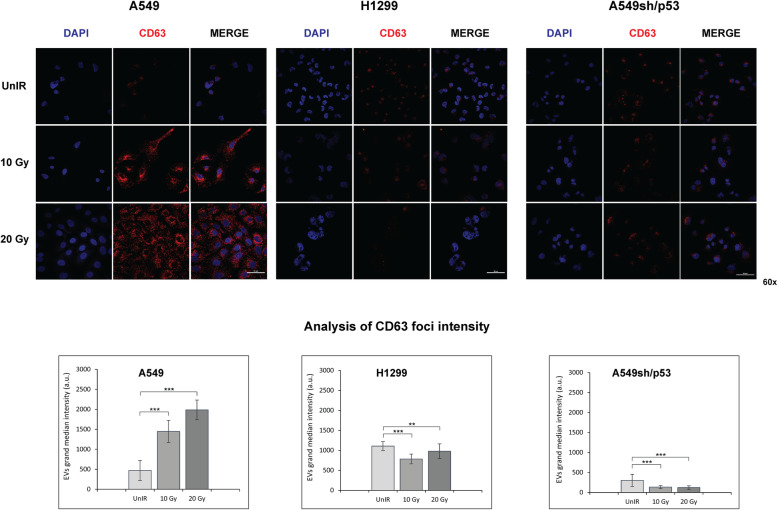
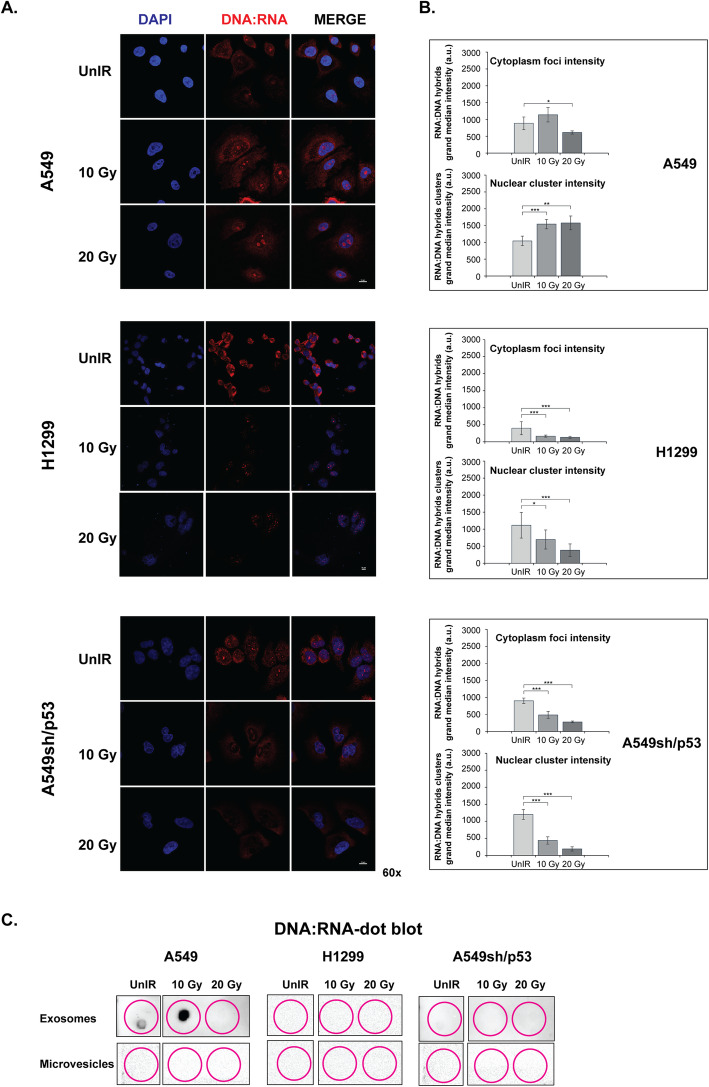
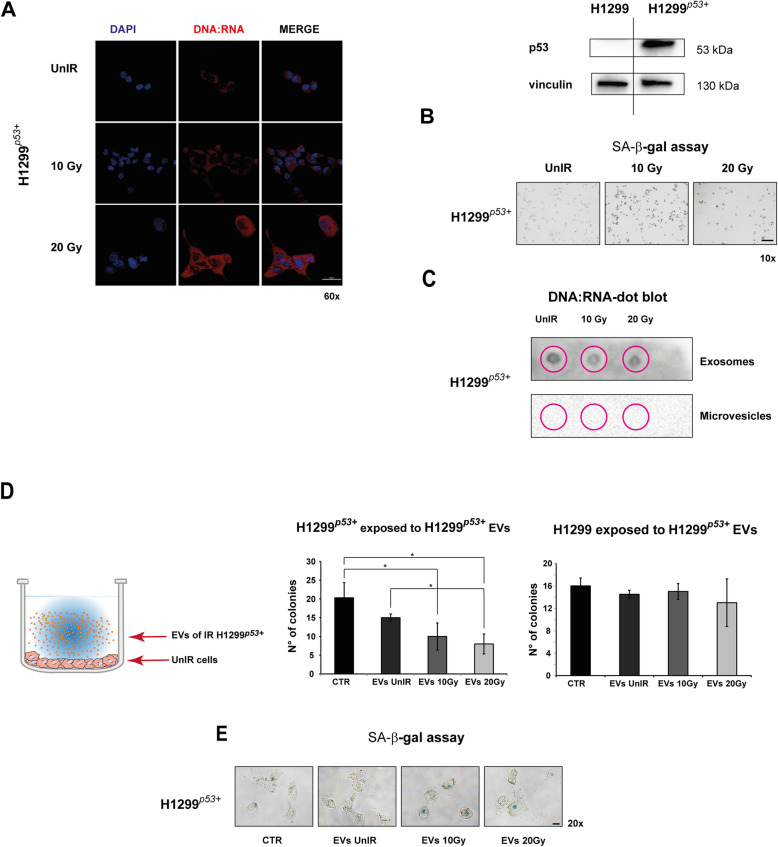
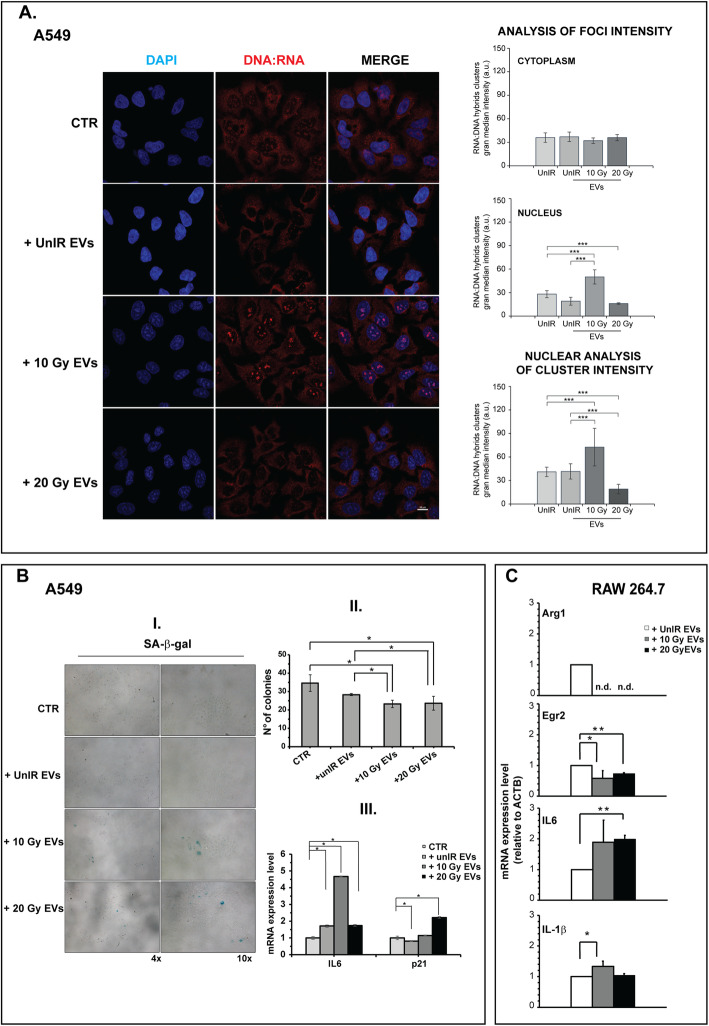
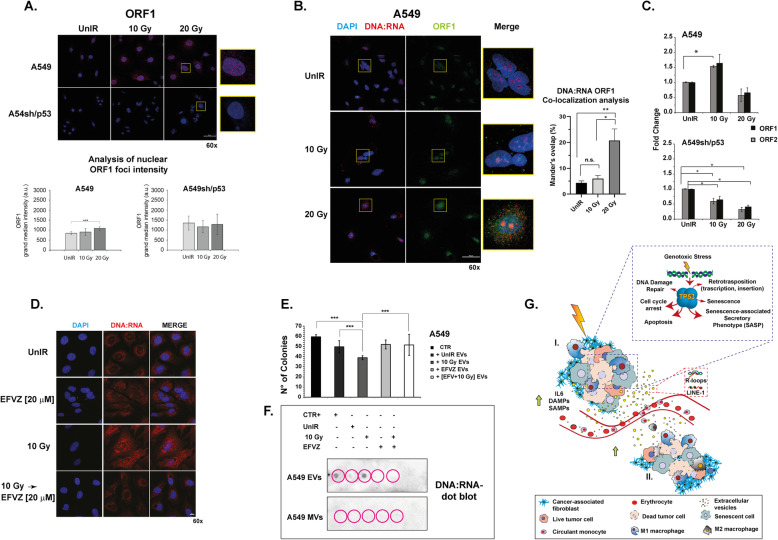
Results: We demonstrated that single high-dose irradiation (20 Gy) induces significant tumor growth inhibition in contralateral non-irradiated (NIR) A549 xenograft tumors but not in NIR p53-null H1299 or p53-silenced A549 (A549sh/p53) xenografts. We further demonstrates that irradiation of A549 cells in vitro induces a senescence-associated secretory phenotype (SASP) producing extracellular vesicles (EVs) expressing CD63 and carrying DNA:RNA hybrids and LINE-1 retrotransposon. IR-A549 EVs also hamper the colony-forming capability of recipient NIR A549 cells, induce senescent phenotype, nuclear expression of DNA:RNA hybrids, and M1 macrophage polarization.

Conclusions: In our models, we demonstrate that high radiation dose in wtp53 tumors induce the onset of SASP and secretion of CD63+ EVs loaded with DNA:RNA hybrids and LINE-1 retrotransposons that convey senescence messages out of the irradiation field triggering abscopal effect in NIR tumors.

Keywords: Abscopal effect; Cellular senescence; DNA:RNA hybrids; Extracellular vesicles; Non-small cell lung cancer; Retrotransposon; TP53.


Conflict of interest statement

There are no potential conflicts of interest to declare.

Figures

Fig. 1
Fig. 1
Wtp53 and high-dose delivery contribute to the Abscopal effect in in vivo NSCLC tumor models. a Experimental design of in vivo experiments aimed at evaluating the tumor-growth of irradiated (IR) and non-irradiated contralateral (NIR) tumors; control (UnIR) non-irradiated mice are also shown. b WTp53 A549 xenografts and (c) p53-null H1299 xenografts. Wtp53-depleted (sh/p53) (d) and control (sh/scr) (e) A549 xenograft tumor growth after RT are reported. Volumetric data were obtained using 8 mice/group and were normalized to the initial volume of tumor-bearing mice at the time of radiation (V0). Data represent the mean (± standard deviation, SD) of two independent experiments. (* p < 0.05; **p < 0.01). f Representative images of the abscopal effect in mice bearing functional p53 (A549 sh/scr). The mice bearing silenced p53 (A549 sh/p53) showed, as expected, tumor growth in the NIR contralateral mass. All the animals were xenografted subcutaneously on both flanks. Black arrows show tumors directly irradiated (20 Gy). g Immunohistochemical staining for F4/80 in mouse A549 xenograft tissue section. Images are representative of control (UnIR), 20 Gy-irradiated (IR) and contralateral non-irradiated (NIR) tumor masses infiltrated by F4/80-positive macrophages (arrow). The number of positive cells in 6 random field profiles was used for statistical analysis. h Lipofuscin staining of A549 xenograft tissue section to detect senescence cells. To quantify lipofuscin positive cells, a homemade Matlab tool was used. The appropriated mask needed to identify the lipofuscin positive cells in the investigated area was obtained using the function imageSegmenter as detailed in supplementary notes. (*** p < 0.0001) (i) IL6 expression through digital qRT-PCR analysis of RNA extracted from A549 xenograft tissue sections. j Different expression levels of IL6 in serum collected from A549 xenograft nude mice irradiated (IR) or not (UnIR) at 20 Gy. (* p < 0.05; ***p < 0.001)
Fig. 2
Fig. 2
P53-dependent SASP induction after irradiation. a P53 and p21 expression in A549, A549sh/p53 and H1299 cells after different radiation doses detected by western blot. The image is representative at least of 2 independent experiments. b Representative images of senescence-associated β-galactosidase (SA-β-gal) staining detected after A549, A549sh/p53, and H1299 cell exposure to 10 or 20 Gy. Scale bar is 100 μm. c mRNA expression of SASP biomarkers using GAPDH and HPRT as housekeeping genes. Data are presented as mean ± SD. d EV quantification using Nanosight nanoparticle tracking analysis. EVs were isolated from the conditioned media of A549, A549sh/p53 and H1299 cells, as described in the Methods section (*p < 0.05)
Fig. 3
Fig. 3
Immunofluorescence staining with CD63 antibody. The images are representative of A549, A549sh/p53 and H1299 cells exposed to different radiation doses. Fluorescent DAPI staining was used to visualize nuclear DNA. The images of the cells were captured by Nikon Eclipse Ti2 confocal microscope with 60x plan apochromatic oil immersion objective lens. Scale bars are 50 μm. Regional foci intensity quantification refers to the evaluation of CD63 expression in A549, A549sh/p53 or H1299 cells exposed to different radiation doses by confocal analysis. The effect of increasing irradiation doses on grand median intensities of nuclear and cytoplasmic foci of DNA:RNA hybrids. Data are presented as grand median ± MAD. (*p < 0.05, **p < 0.01 ***p < 0.001)
Fig. 4
Fig. 4
Cell irradiation induces the expression of DNA:RNA hybrid structures in NSCLC cell lines. a Immunofluorescence staining with S9.6 antibody. The images are representative of A549, A549sh/p53 and H1299 cells exposed to 10 or 20 Gy. Scale bars are 10 μm. b Regional foci intensity quantification. Effect of increasing irradiation doses on grand median intensities of nuclear and cytoplasmic foci of DNA:RNA hybrids. Data are presented as grand median ± MAD. c Dot blot analysis of RNA extracted from exosome or microvesicle fraction 72 h post-irradiation and immunoblotted with S9.6 antibody. (*p < 0.05, **p < 0.01 ***p < 0.001)
Fig. 5
Fig. 5
H1299 with forced wtp53 (H1299p53+) showed irradiation response similar to that observed in A549 cells. a H1299 cells with forced wtp53 showed a high level of DNA:RNA hybrid structures after irradiation. Cell images were captured by Nikon Eclipse Ti2 confocal microscope with 60x plan apochromat oil immersion objective lens. b. Representative images of senescence-associated β-galactosidase (SA-β-gal) staining detected after H1299p53+ cell exposure to 10 Gy or 20 Gy. Scale bar is 100 μm. c Dot blot analysis of RNA extracted from exosome or microvesicle fraction 72 h post-irradiation and immunoblotted with S9.6 antibody. d Colony-forming assay (CFA). Cells were exposed to EVs isolated from UnIR or IR H1299p53+ cells for 14 days. 0.05% crystal violet solution was used to visualize the generated colonies with more than 50 cells, which were quantified under inverted microscope (Olympus IX51 microscope, Olympus Corporation, Tokyo, Japan) by two independent observers. e Representative images of SA-β-gal staining of UnIR H1299p53+ cells after exposure to EVs isolated from culture medium of IR H1299p53+ cells
Fig. 6
Fig. 6
A549 cells grown as 3D models confirm the irradiation-induced SASP characterized by high synthesis of DNA:RNA hybrids structures. a Representative images of SA-β-gal staining performed on FFPE tissue sections of A549 spheroids fixed after exposure to 10 or 20 Gy. For evaluation of cells positive to SA-β-Gal assay, a homemade Matlab tool was used. The appropriated mask needed to identify the cells positive to SA-β-Gal assay in the investigated area was obtained using the function imageSegmenter; (* p < 0.05; *** p < 0.0001) (b) mRNA expression of SASP biomarkers detected in A549 cells grown as 3D spheroids using GAPDH and HPRT as housekeeping genes. Data are presented as mean ± SD. c, d Confocal immunofluorescence images representative of A549 spheroids after different irradiation doses showing cytoplasmic (green) and nuclear (white) localization of DNA:RNA hybrids (scale bar 10 μm). The micrograph shows the co-localization analysis performed through confocal high-resolution analysis. Bar graphs, mean ± error bars of fluorescent signals in the different compartments are also reported (see Methods section) (* p < 0.05)
Fig. 7
Fig. 7
EVs secreted by high-dose irradiated A549 cells induce in vitro abscopal effects. a EVs secreted by irradiated A549 stimulate the synthesis of DNA:RNA hybrid structures. Immunofluorescence staining with S9.6 antibody. The images are representative of unIR A549 cells exposed to EVs isolated from culture medium of A549 cells non irradiated or irradiated at different doses. Cell images were captured by Nikon Eclipse Ti2 confocal microscope with 60x plan apochromat oil immersion objective lens. Data are presented as grand median ± MAD. b EVs secreted by irradiated A549 induce senescent phenotype. (I) Representative images of SA-β-gal staining of UnIR A549 cells after exposure to EVs isolated from culture medium of IR A549 cells. II. Colony-forming assay (CFA). The cells were exposed to EVs isolated from UnIR or IR A549 cells for 14 days. 0.05% crystal violet solution was used to visualize the generated colonies with more than 50 cells, which were quantified under inverted microscope (Olympus IX51 microscope, Olympus Corporation, Tokyo, Japan) by two independent observers. III. Expression levels of senescence markers. p21, IL6 mRNA levels were measured by Real-Time PCR and normalized to GAPDH and HPRT-1. Data are the mean of two independent experiments. (C) EVs secreted by irradiated A549 induce M1 polarization in a murine macrophage cell line. Total RNA from RAW 264.7 M0 cells (see Methods section) exposed to EVs secreted by unirradiated, 10 Gy or 20 Gy-irradiated A549 cells were analyzed by RT-PCR for the expression of representative murine M2 genes (Arg1, Egr2) and M1/pro-inflammatory cytokines (IL-6, IL-1β). Expression data are given as fold increase over the mRNA level expressed by RAW 264.7 M0 exposed to UnIR EVs. Data are represented as mean ± SD of triplicate values of two independent experiments (*p < 0.05, **p < 0 .01 ***p < 0.001)
Fig. 8
Fig. 8
Correlation between DNA:RNA hybrids and retrotransposon ORF1. a Immunofluorescence staining with ORF1 antibody. The images are representative of A549, A549sh/p53 cells exposed to 10 or 20 Gy. Scale bar is 50 μm. Data are presented as grand median ± MAD. b DNA:RNA ORF1 co-localization analysis. Images are representative of A549 cells exposed to 10 Gy or 20 Gy. Scale bar is 50 μm. The average values of Mander’s ovelap (% of pixels that are overlapped, ± SEM) were calculated by software NIS-Element software’s tool (Nikon) and at least 20 cells were evaluated for each condition (*p < 0.05, **p < 0.01). c ORF1 and ORF2 mRNA expression in A549 and A549sh/p53 (see Methods section). Data are represented as mean ± SD of triplicate values of two independent experiments. d Representative confocal micrographs showing the positivity of A549 or A549sh/p53 cells to S9.6 antibody after exposure to Efavirenz (EFVZ) 20 μM, 10 Gy alone or followed by EFVZ 20 μM. Scale bar is 10 μm. (*p < 0.05, **p < 0.01 ***p < 0 .001). e Colony-forming assay (CFA). UnIR A549 cells were exposed to EVs isolated from unirradiated, irradiated, efavirenz-treated, and efavirenz-treated and irradiated A549 cells. 0.05% crystal violet solution was used to visualize the generated colonies with more than 50 cells, which were quantified under inverted microscope (Olympus) by two independent observers. f Dot blot analysis of RNA extracted from exosome or microvesicle fraction 72 h post-irradiation and immunoblotted with S9.6 antibody. The EVs and MVs were isolated from A549 cells exposed to different treatments. g Diagram illustrating the p53-mediated abscopal effect induced by radiotherapy. (I) Radiotherapy induces cell damage that leads to cell cycle arrest, necrosis, programmed cell death and cellular senescence. In particular, the cells bearing functional p53 may acquire SASP and release cytokines, inflammatory- (DAMPs) or senescence- (SAMPs) associated molecules. In addition, radiotherapy in the presence of wtp53 activates retrotransposon elements which, in turn, increase the level of genotoxic stress. SASP cells also release EVs conveying DNA:RNA hybrids and /or retrotransposon which, outside the field of irradiation (II), activate autodestruction mechanisms such as cellular senescence, apoptosis and innate immunity in p53-competent tumor cells

Similar articles

Cited by

References

    1. Orth M, Lauber K, Niyazi M, Friedl AA, Li M, Maihöfer C, et al. Current concepts in clinical radiation oncology. Vol. 53, Radiation and Environmental Biophysics. Springer New York LLC. 2014:1–29. - PMC - PubMed
    1. Khor RC, Bressel M, Tedesco J, Tai KH, Ball DL, Duchesne GM, et al. Tolerability and outcomes of curative radiotherapy in patients aged 85 or more years. Med J Aust. 2015;202(3):153–156. doi: 10.5694/mja14.00441. - DOI - PubMed
    1. Poleszczuk JT, Luddy KA, Prokopiou S, Robertson-Tessi M, Moros EG, Fishman M, et al. Abscopal benefits of localized radiotherapy depend on activated T-cell trafficking and distribution between metastatic lesions. Cancer Res. 2016;76(5):1009–1018. doi: 10.1158/0008-5472.CAN-15-1423. - DOI - PubMed
    1. Abuodeh Y, Venkat P, Kim S. Systematic review of case reports on the abscopal effect. Curr Probl Cancer. 2016;40(1):25–37. doi: 10.1016/j.currproblcancer.2015.10.001. - DOI - PubMed
    1. Reynders K, Illidge T, Siva S, Chang JY, De Ruysscher D. The abscopal effect of local radiotherapy: using immunotherapy to make a rare event clinically relevant. Cancer Treat Rev. 2015;41(6):503–510. doi: 10.1016/j.ctrv.2015.03.011. - DOI - PMC - PubMed

Substances