

Deployment of an Interdisciplinary Predictive Analytics Task Force to Inform Hospital Operational Decision-Making During the COVID-19 Pandemic
- PMID: 33673920
- PMCID: PMC7833949
- DOI: 10.1016/j.mayocp.2020.12.019
Deployment of an Interdisciplinary Predictive Analytics Task Force to Inform Hospital Operational Decision-Making During the COVID-19 Pandemic
Abstract
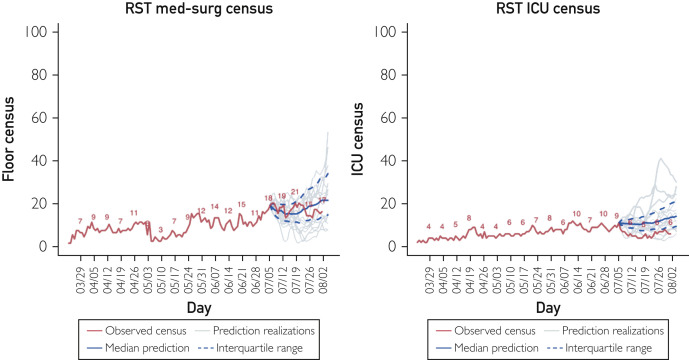
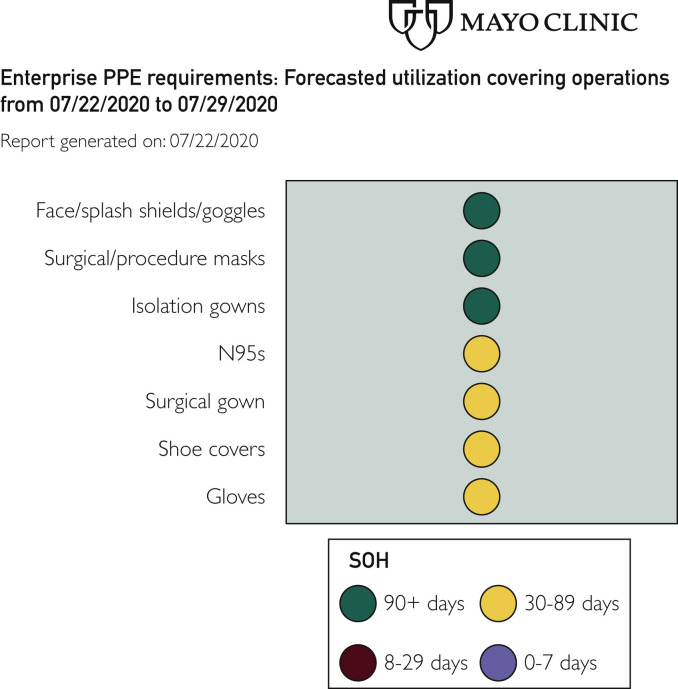
In March 2020, our institution developed an interdisciplinary predictive analytics task force to provide coronavirus disease 2019 (COVID-19) hospital census forecasting to help clinical leaders understand the potential impacts on hospital operations. As the situation unfolded into a pandemic, our task force provided predictive insights through a structured set of visualizations and key messages that have helped the practice to anticipate and react to changing operational needs and opportunities. The framework shared here for the deployment of a COVID-19 predictive analytics task force could be adapted for effective implementation at other institutions to provide evidence-based messaging for operational decision-making. For hospitals without such a structure, immediate consideration may be warranted in light of the devastating COVID-19 third-wave which has arrived for winter 2020-2021.
Copyright © 2021 Mayo Foundation for Medical Education and Research. Published by Elsevier Inc. All rights reserved.
Figures
Similar articles
-
Estimated surge in hospital and intensive care admission because of the coronavirus disease 2019 pandemic in the Greater Toronto Area, Canada: a mathematical modelling study.CMAJ Open. 2020 Sep 22;8(3):E593-E604. doi: 10.9778/cmajo.20200093. Print 2020 Jul-Sep. CMAJ Open. 2020. PMID: 32963024 Free PMC article.
-
Impact of Hospital Strain on Excess Deaths During the COVID-19 Pandemic - United States, July 2020-July 2021.MMWR Morb Mortal Wkly Rep. 2021 Nov 19;70(46):1613-1616. doi: 10.15585/mmwr.mm7046a5. MMWR Morb Mortal Wkly Rep. 2021. PMID: 34793414 Free PMC article.
-
Hospital Pharmacist experience in the Intensive Care Unit: Plan COVID.Farm Hosp. 2020 Jun 12;44(7):32-35. doi: 10.7399/fh.11510. Farm Hosp. 2020. PMID: 32533667 English.
-
A California Hospital's Response to COVID-19: From a Ripple to a Tsunami Warning.Crit Care Nurse. 2020 Dec 1;40(6):e1-e16. doi: 10.4037/ccn2020799. Crit Care Nurse. 2020. PMID: 32803240 Review.
-
[Recommendations for ethical decision making regarding hospital visitation during the COVID-19 pandemic].Med Klin Intensivmed Notfmed. 2021 Jun;116(5):415-420. doi: 10.1007/s00063-021-00805-4. Epub 2021 Apr 9. Med Klin Intensivmed Notfmed. 2021. PMID: 33835192 Free PMC article. Review. German.
Cited by
-
Implementation and use of a national electronic dashboard to guide COVID-19 clinical management in Fiji.Western Pac Surveill Response J. 2023 Feb 22;14(5 Spec Edition):01-7. doi: 10.5365/wpsar.2023.14.5.967. eCollection 2023. Western Pac Surveill Response J. 2023. PMID: 36936727 Free PMC article.
-
Understanding Health Care Administrators' Data and Information Needs for Decision Making during the COVID-19 Pandemic: A Qualitative Study at an Academic Health System.MDM Policy Pract. 2022 Mar 29;7(1):23814683221089844. doi: 10.1177/23814683221089844. eCollection 2022 Jan-Jun. MDM Policy Pract. 2022. PMID: 35368410 Free PMC article.
-
Transition matrices model as a way to better understand and predict intra-hospital pathways of covid-19 patients.Sci Rep. 2022 Oct 20;12(1):17508. doi: 10.1038/s41598-022-22227-8. Sci Rep. 2022. PMID: 36266423 Free PMC article.
-
Impact of the Coronavirus Disease 2019 (COVID-19) Vaccine on Asymptomatic Infection Among Patients Undergoing Preprocedural COVID-19 Molecular Screening.Clin Infect Dis. 2022 Jan 7;74(1):59-65. doi: 10.1093/cid/ciab229. Clin Infect Dis. 2022. PMID: 33704435 Free PMC article.
-
Hospital quality reporting in the pandemic era: to what extent did hospitals' COVID-19 census burdens impact 30-day mortality among non-COVID Medicare beneficiaries?BMJ Open Qual. 2023 Mar;12(1):e002269. doi: 10.1136/bmjoq-2023-002269. BMJ Open Qual. 2023. PMID: 36944449 Free PMC article.
References
-
- American Hospital Association. What Healthcare Leaders Need to Know: Preparing for COVID-19. Coronavirus Update Webinar. February 21, 2020. https://www.aha.org/advisory/2020-02-20-coronavirus-update-register-aha-.... Accessed February 26, 2020.
-
- The COVID tracking project The Atlantic Monthly Group. 2020. https://covidtracking.com/data/us-daily
-
- Nacoti M., Ciocca A., Giupponi A., Brambillasca P. At the Epicenter of the Covid-19 Pandemic and Humanitarian Crises in Italy: Changing Perspectives on Preparation and Mitigation. NEJM Catalyst Innovations in Care Delivery. https://catalyst.nejm.org/doi/full/10.1056/CAT.20.0080 - DOI
-
- Science of Health Care Delivery: Robert D. and Patricia E. Kern Center. 2020. https://www.mayo.edu/research/centers-programs/robert-d-patricia-e-kern-... Accessed August 31, 2020.
-
- IHME COVID-19 health service utilization forecasting team, Christopher JL Murray. Forecasting COVID-19 impact on hospital bed-days, ICU-days, ventilator-days and deaths by US state in the next 4 months. medRxiv. Accessed October 5, 2020. - DOI
Publication types
MeSH terms
LinkOut - more resources
Full Text Sources
Other Literature Sources
Medical
Research Materials
