. 2021 Apr 20;59(5):e01418-20.
doi: 10.1128/JCM.01418-20. Print 2021 Apr 20.

Evaluation of Specimen Types and Saliva Stabilization Solutions for SARS-CoV-2 Testing

Affiliations

Evaluation of Specimen Types and Saliva Stabilization Solutions for SARS-CoV-2 Testing

Sara B Griesemer et al. J Clin Microbiol. .

Abstract

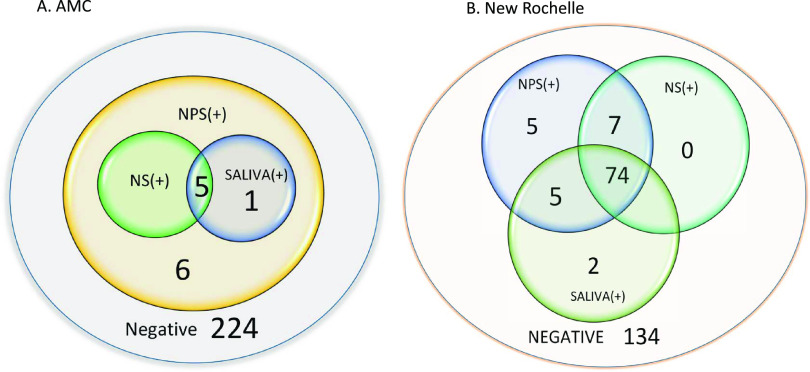
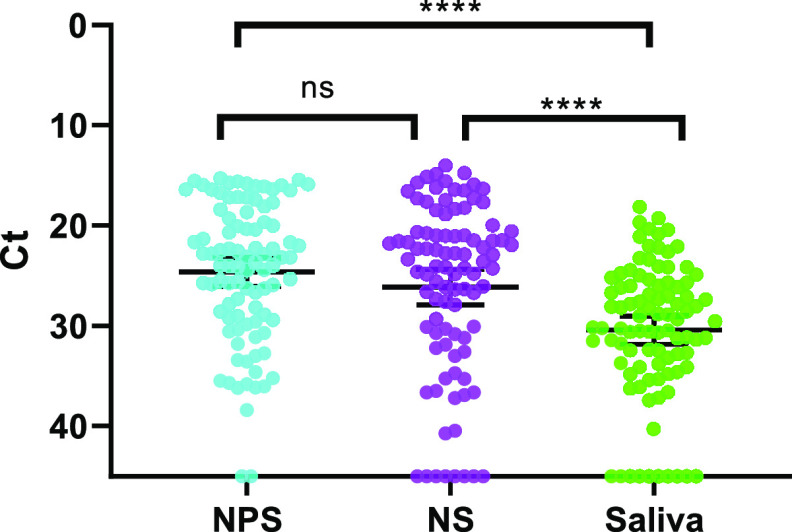
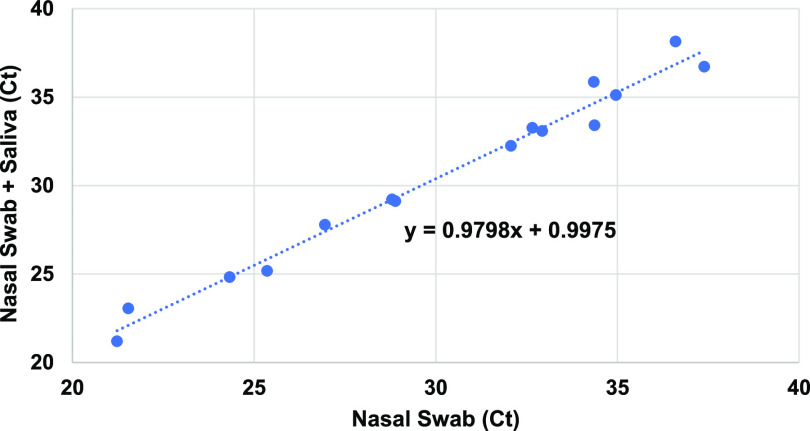
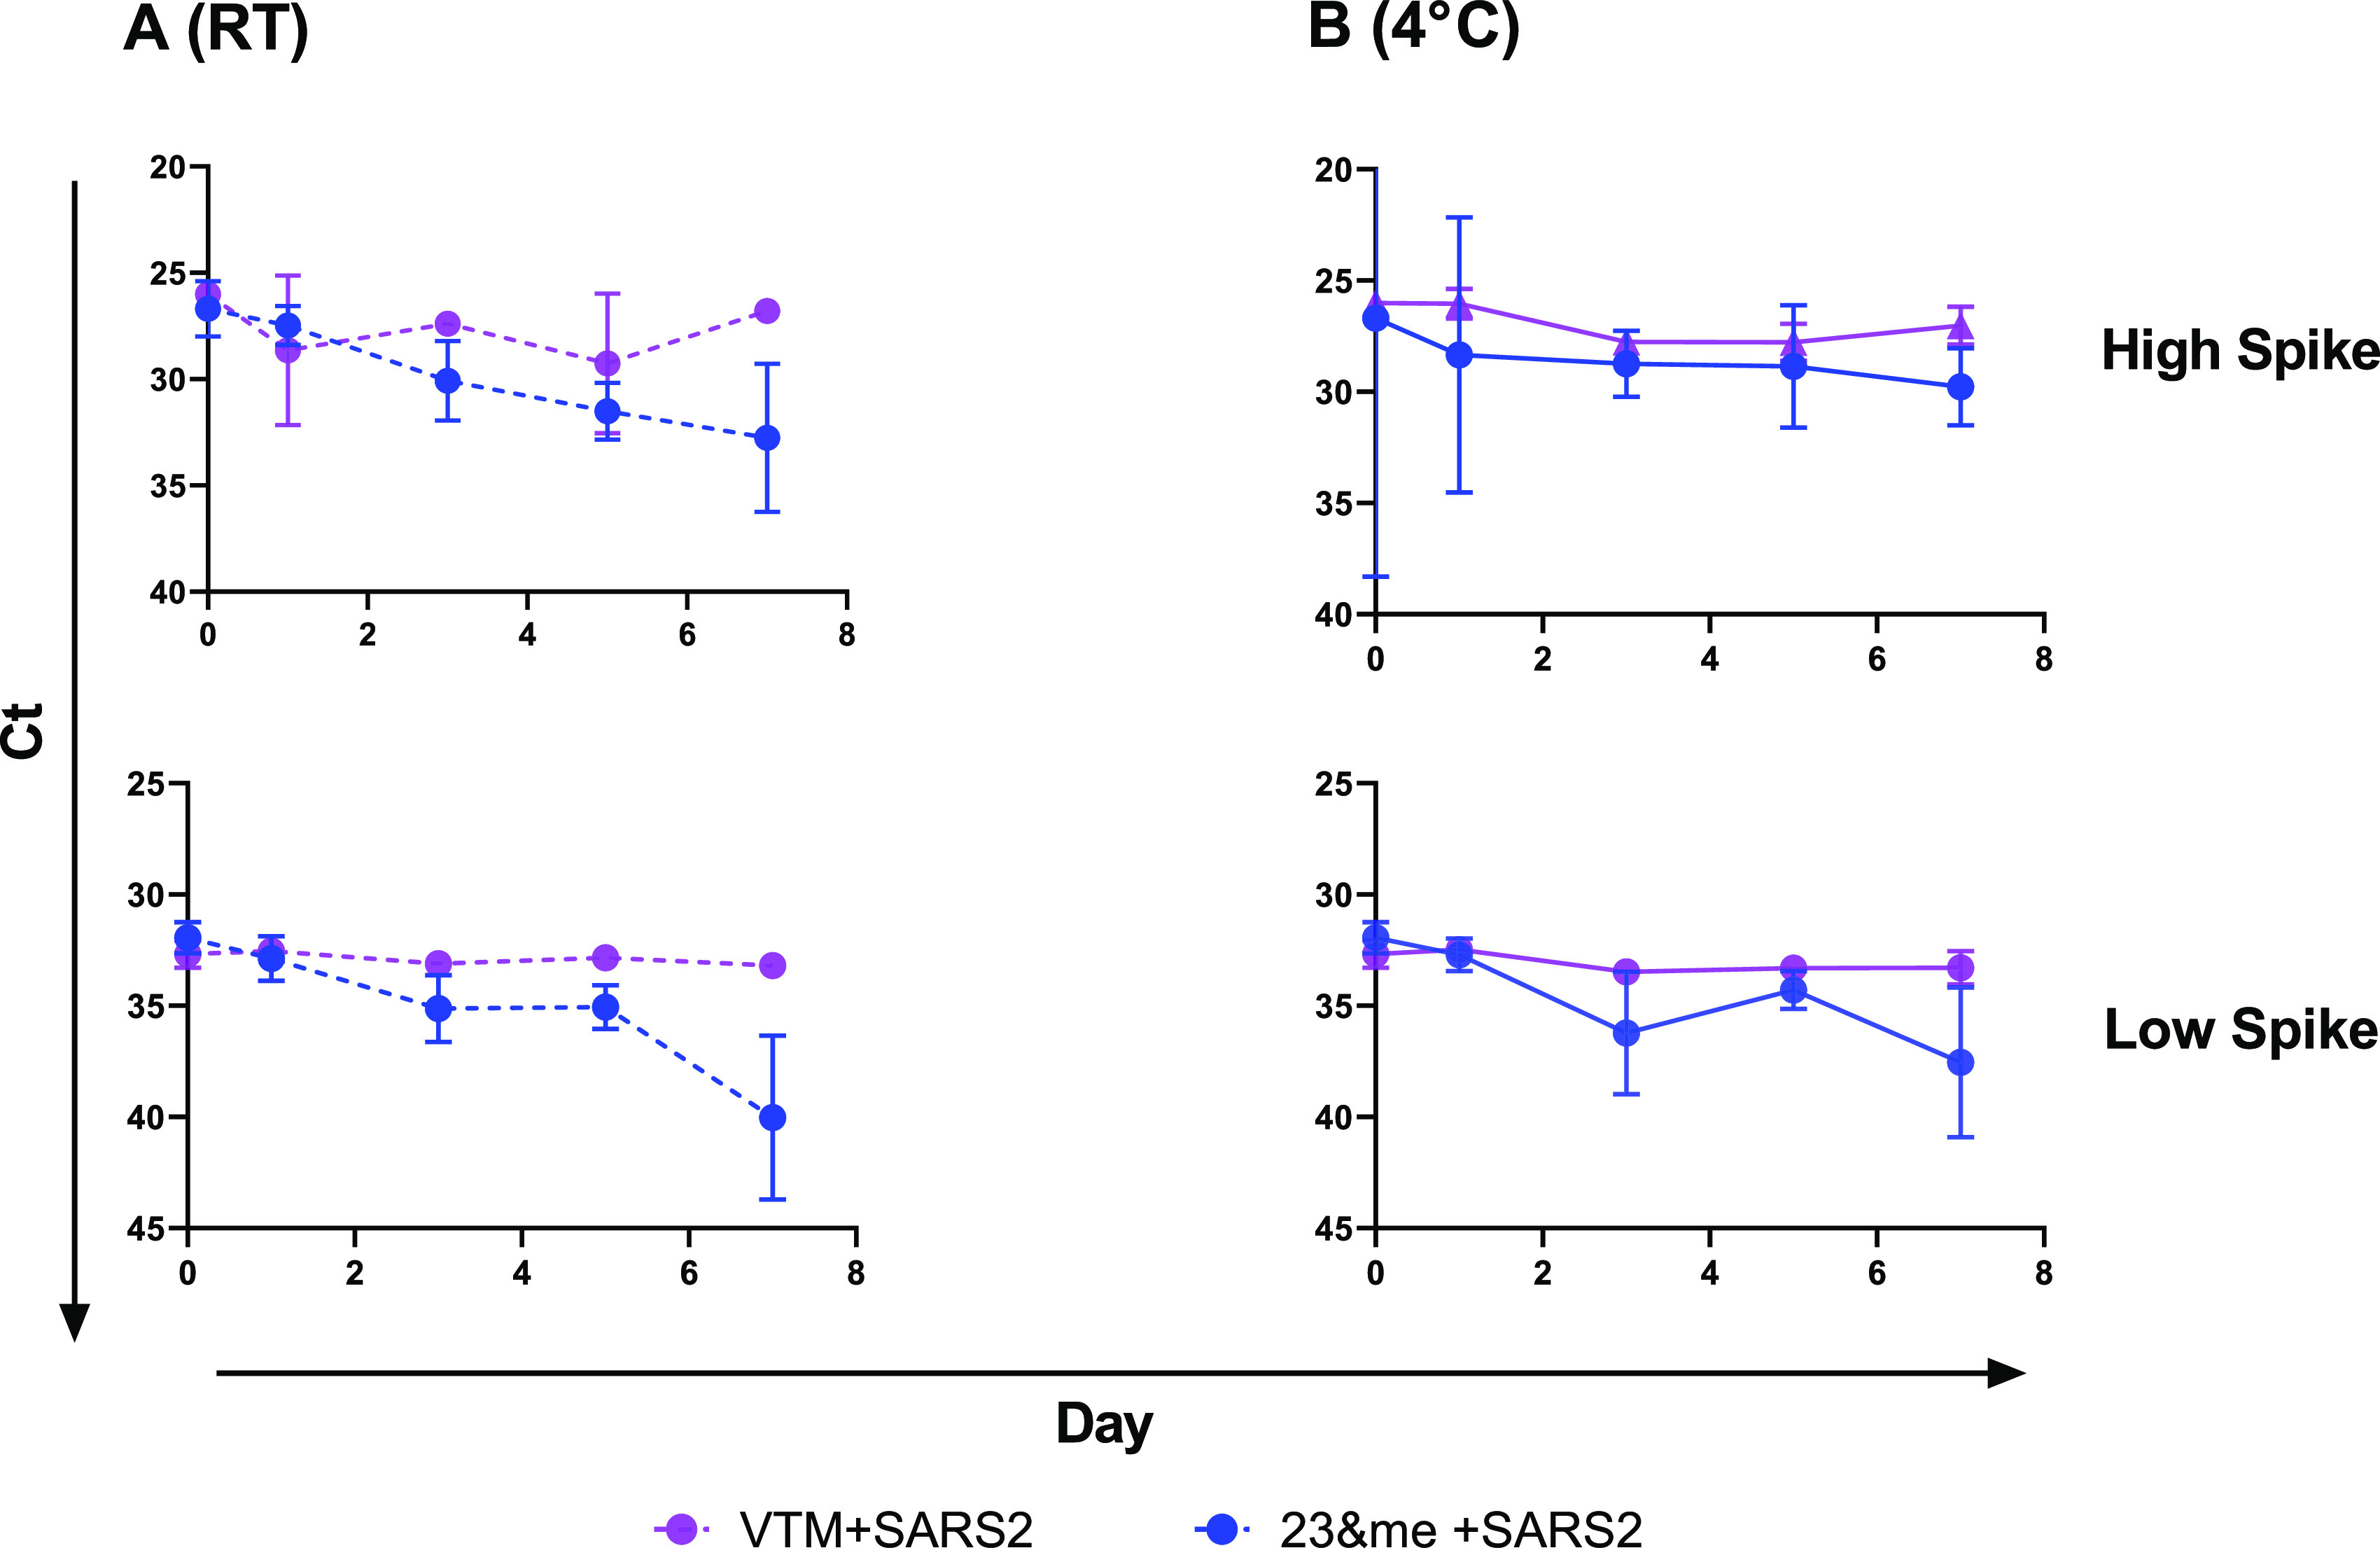
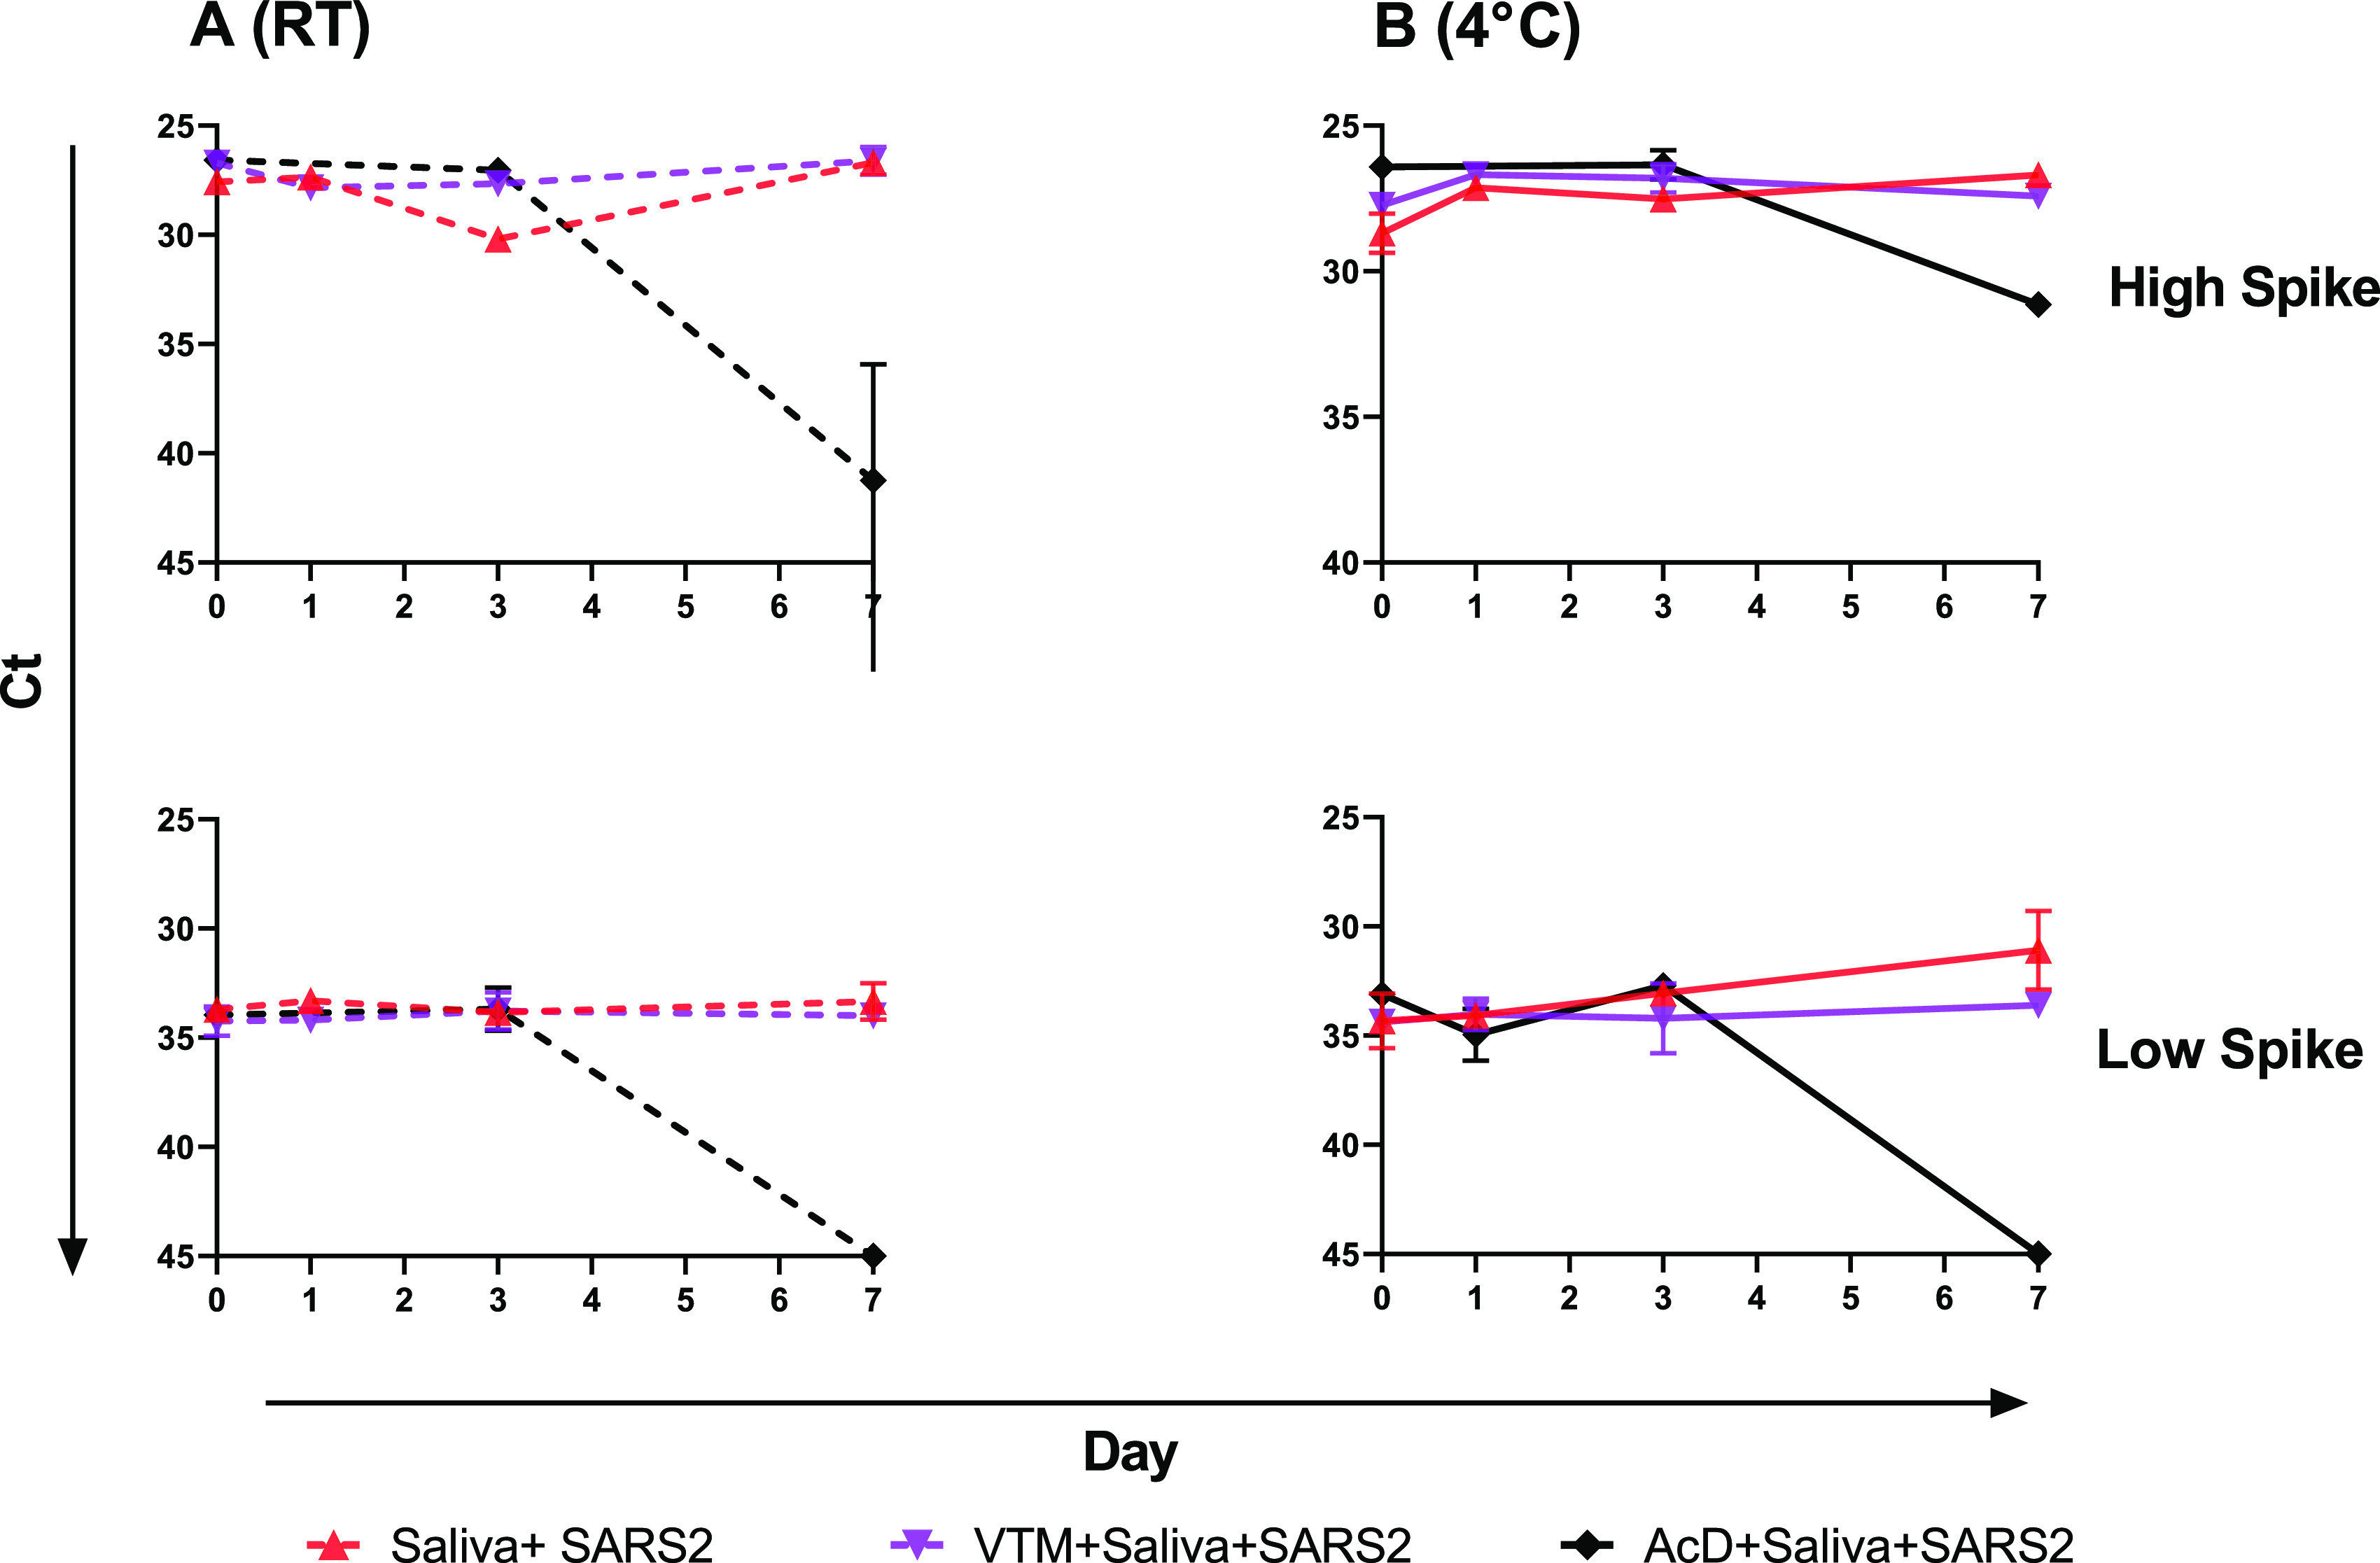
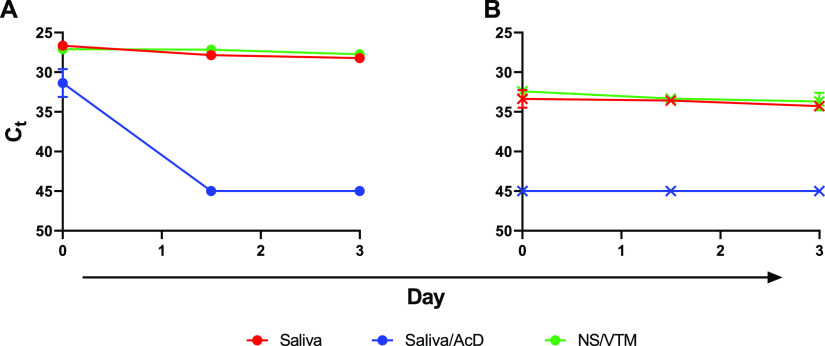
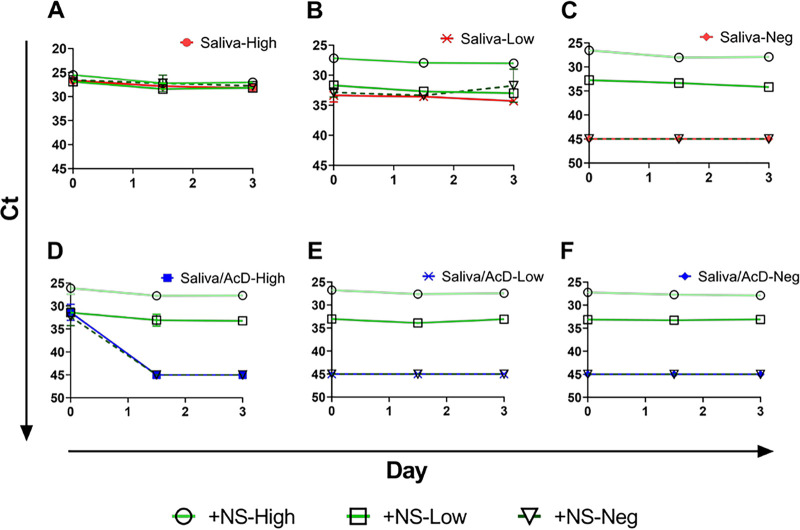
Identifying SARS-CoV-2 infections through aggressive diagnostic testing remains critical to tracking and curbing the spread of the COVID-19 pandemic. Collection of nasopharyngeal swabs (NPS), the preferred sample type for SARS-CoV-2 detection, has become difficult due to the dramatic increase in testing and consequent supply strain. Therefore, alternative specimen types have been investigated that provide similar detection sensitivity with reduced health care exposure and the potential for self-collection. In this study, the detection sensitivity of SARS-CoV-2 in nasal swabs (NS) and saliva was compared to that of NPS using matched specimens from two outpatient cohorts in New York State (total n = 463). The first cohort showed only a 5.4% positivity, but the second cohort (n = 227) had a positivity rate of 41%, with sensitivity in NPS, NS, and saliva of 97.9%, 87.1%, and 87.1%, respectively. Whether the reduced sensitivity of NS or saliva is acceptable must be assessed in the settings where they are used. However, we sought to improve on it by validating a method to mix the two sample types, as the combination of nasal swab and saliva resulted in 94.6% SARS-CoV-2 detection sensitivity. Spiking experiments showed that combining them did not adversely affect the detection sensitivity in either. Virus stability in saliva was also investigated, with and without the addition of commercially available stabilizing solutions. The virus was stable in saliva at both 4°C and room temperature for up to 7 days. The addition of stabilizing solutions did not enhance stability and, in some situations, reduced detectable virus levels.

Keywords: COVID-19; nasal swab; nasopharyngeal swab; saliva; sample type.


Figures

FIG 1
FIG 1
Comparison of positivity in different specimen types from the two collection sites. (A) Albany Medical Center (n = 236). (B) New Rochelle (n = 227).
FIG 2
FIG 2
Distribution of negative, low-positive, and high-positive patients by age. Conditional density plots display the distribution of negative, low-, and high-positive samples by age. High-positive samples (darkest gray) showed CT values of <24, low positives (medium gray) had 24 ≤ CT < 45, and negatives (light gray) had CT values of 45. Results are shown for NPS (A), NS (B), or saliva (C).
FIG 3
FIG 3
Comparison of SARS-CoV-2 detection by sample type and CT value. Matched CT values for NPS, NS, and saliva from all positive individuals collected at the ROC (n = 93) were compared using a Kruskal-Wallis test (P < 0.0001) with Dunn’s multiple comparisons post hoc test, which were used to compare the mean ranks of CT values between sample types. Bars represent means and 95% CI, and a CT value of 45 was assigned to undetected specimens. Asterisks represent P values derived from Dunn’s multiple-comparison test (ns, not significant; *, P ≤ 0.05; **, P ≤ 0.01; ***, P ≤ 0.001; ****, P ≤ 0.0001).
FIG 4
FIG 4
Addition of saliva does not interfere with CT values of nasal swabs. Nasal swab specimens, previously positive for SARS-CoV-2, were retrieved from −80°C storage and retested by real-time RT-PCR. Negative saliva was extracted together with the same nasal swab specimens. Linear regression analysis was performed on both comparisons.
FIG 5
FIG 5
Virus stability in saliva samples mixed with 23andMe stabilization buffer or VTM. Mixtures of saliva plus 23andMe buffer (blue) or VTM (purple) and virus were held at room temperature (A, dashed lines) or 4°C (B, solid lines) and sampled at days 0, 1, 3, 5, and 7 in duplicate. Mean CT values for N1 were plotted, and simple linear regression analysis was performed. The slope of all VTM curves did not deviate significantly from zero; the slope of the 23andMe low spike at 4°C did not deviate significantly from zero, and the slope of all other 23andMe plots significantly deviated from zero (P < 0.02).
FIG 6
FIG 6
Virus stability in saliva alone, saliva with VTM, or saliva combined with AncestryDNA (AcD) stabilization buffer. Saliva alone (red), saliva plus VTM (purple), and saliva plus AcD buffer, all spiked with virus, were held at room temperature (A, dashed lines) or 4°C (B, solid lines) and sampled, in duplicate, at days 0, 1, 3, and 7. Mean CT values were plotted, and simple linear regression analysis was performed. Slopes for neither saliva alone nor saliva plus VTM deviated from zero; all slopes for saliva plus AcD buffer significantly deviated from zero (P < 0.02).
FIG 7
FIG 7
Virus stability over time. Viral RNA detection at both high (A) and low (B) spiked virus concentrations in saliva (red), saliva plus AcD buffer (blue), and NS in VTM (green). Samples were held at room temperature and collected, in duplicate, at 0, 36, and 72 h; mean CT values are plotted.
FIG 8
FIG 8
Effect of mixed saliva and NS specimens with high and low virus concentrations, with and without the addition of stabilization buffer to the saliva. (A, B, and C) High, low, and negative saliva mixed with high, low, and negative NS. (D, E, and F) High, low, and negative saliva with stabilization buffer mixed with high, low, and negative NS.

References

    1. Patel R, Babady E, Theel ES, Storch GA, Pinsky BA, St George K, Smith TC, Bertuzzi S. 2020. Report from the American Society for Microbiology COVID-19 International Summit, 23 March 2020: value of diagnostic testing for SARS-CoV-2/COVID-19. mBio 11:e00722-20. 10.1128/mBio.00722-20. - DOI - PMC - PubMed
    1. Newton PN, Bond KC. 2020. COVID-19 and risks to the supply and quality of tests, drugs, and vaccines. Lancet Glob Health 8:e754–e755. 10.1016/S2214-109X(20)30136-4. - DOI - PMC - PubMed
    1. Pere H, Podglajen I, Wack M, Flamarion E, Mirault T, Goudot G, Hauw-Berlemont C, Le L, Caudron E, Carrabin S, Rodary J, Ribeyre T, Belec L, Veyer D. 2020. Nasal swab sampling for SARS-CoV-2: a convenient alternative in times of nasopharyngeal swab shortage. J Clin Microbiol 58:e00721-20. 10.1128/JCM.00721-20. - DOI - PMC - PubMed
    1. Rowan NJ, Laffey JG. 2020. Challenges and solutions for addressing critical shortage of supply chain for personal and protective equipment (PPE) arising from coronavirus disease (COVID19) pandemic–case study from the Republic of Ireland. Sci Total Environ 725:138532. 10.1016/j.scitotenv.2020.138532. - DOI - PMC - PubMed
    1. Vermeiren C, Marchand-Senecal X, Sheldrake E, Bulir D, Smieja M, Chong S, Forbes JD, Katz K. 2020. Comparison of Copan ESwab and FLOQSwab for COVID-19 diagnosis: working around a supply shortage. J Clin Microbiol 58:e00669-20. 10.1128/JCM.00669-20. - DOI - PMC - PubMed

Publication types