. 2021 Mar 5;7(10):eabc5464.
doi: 10.1126/sciadv.abc5464. Print 2021 Mar.

Single-cell transcriptomic analysis of mIHC images via antigen mapping

Affiliations

Single-cell transcriptomic analysis of mIHC images via antigen mapping

Kiya W Govek et al. Sci Adv. .

Abstract

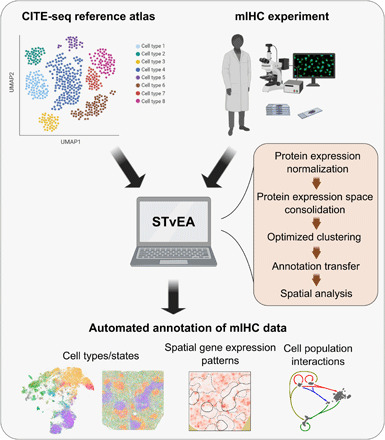
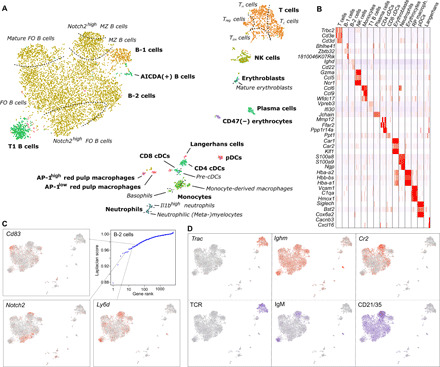
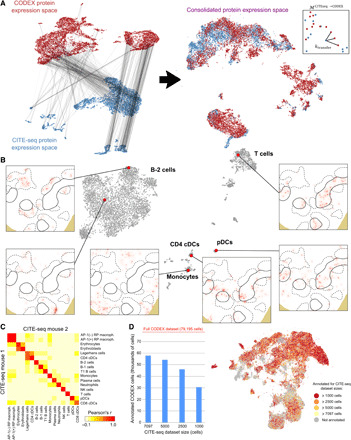
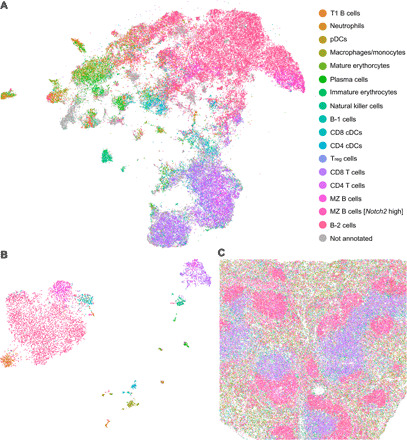
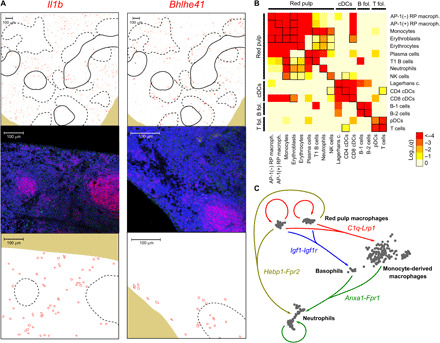
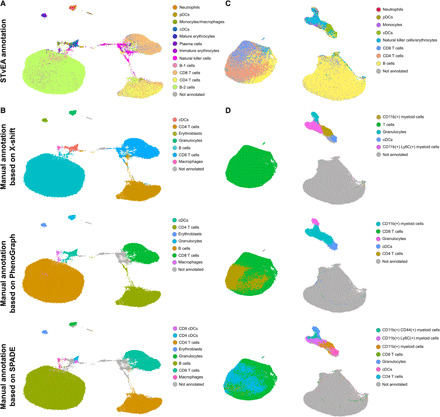
Highly multiplexed immunohistochemistry (mIHC) enables the staining and quantification of dozens of antigens in a tissue section with single-cell resolution. However, annotating cell populations that differ little in the profiled antigens or for which the antibody panel does not include specific markers is challenging. To overcome this obstacle, we have developed an approach for enriching mIHC images with single-cell RNA sequencing data, building upon recent experimental procedures for augmenting single-cell transcriptomes with concurrent antigen measurements. Spatially-resolved Transcriptomics via Epitope Anchoring (STvEA) performs transcriptome-guided annotation of highly multiplexed cytometry datasets. It increases the level of detail in histological analyses by enabling the systematic annotation of nuanced cell populations, spatial patterns of transcription, and interactions between cell types. We demonstrate the utility of STvEA by uncovering the architecture of poorly characterized cell types in the murine spleen using published cytometry and mIHC data of this organ.


Figures

Fig. 1
Fig. 1. Overview of STvEA.
STvEA takes as input an mIHC dataset and a reference CITE-seq atlas and performs automated annotations of the mIHC data based on the reference atlas. It first normalizes and consolidates the protein expression spaces of the mIHC and CITE-seq datasets. Then, it identifies clusters the CITE-seq mRNA data such that the resulting cell populations can be accurately mapped onto the mIHC images. The resulting information is used to annotate cell types and states in the mIHC dataset and predict spatial patterns of gene expression and interactions between cell populations.
Fig. 2
Fig. 2. A high-resolution CITE-seq atlas of the murine spleen.
(A) UMAP representation of the mRNA expression data of 7097 cells from the murine spleen profiled with CITE-seq. Cell populations were identified by clustering (represented in different colors) and annotated by differential expression analysis (bold text) and a spectral graph method [italic text; see also (C)]. Dashed lines represent soft transitions in the transcriptome of cells. (B) Heatmap depicting the expression of some of the top differentially expressed genes in each cluster. (C) Analysis of the cellular heterogeneity within the clusters of B-2 cells using a spectral graph approach. Genes were ranked according to their Laplacian score, and statistical significance was assessed for each gene by randomization. In the figure, the expression levels of some of the significant genes are depicted in the UMAP representation. The complete results are provided for all clusters in table S3. (D) mRNA expression levels of Cr2, Ighm, and Trac (top) and the expression levels of the proteins they code for (bottom).
Fig. 3
Fig. 3. Mapping of the splenic CITE-seq atlas into histology sections profiled with CODEX.
(A) Schematics of the procedure for mapping the CODEX and CITE-seq protein expression spaces. Anchors are identified using mutual nearest neighbors and weighted according to their consistency with the mRNA expression space (left). These anchors are used to consolidate the CODEX and CITE-seq protein expression spaces into a common space (middle). The transfer matrix ℳCITEseq→CODEX is built by looking at the nearest CODEX cells to each CITE-seq cell in this space (right). (B) Mapping of cells from the CITE-seq atlas into a splenic section profiled with CODEX. The figure shows the locations of cells in the section with antigenic profiles similar to those of six cells from the CITE-seq atlas. T and B cell zones are indicated with solid and dashed lines, respectively. (C) Consistency between the annotations of two spleens profiled by CITE-seq and mapped onto the same CODEX dataset. The heatmap shows the correlation between the CODEX cell assignments for each cell population. (D) Number of annotated cells in the CODEX dataset as a function of the number of cells in the CITE-seq atlas. The annotated cells are indicated in a UMAP representation of the CODEX protein expression.
Fig. 4
Fig. 4. Transcriptome-guided annotation of cell populations in histology sections profiled with mIHC.
(A) UMAP representation of the protein expression space of a splenic tissue section profiled with CODEX. The representation is labeled by the cell populations identified by STvEA. In total, 17 phenotypically distinct populations were determined in the mRNA CITE-seq data based on their gene expression profile and their mapping into the CODEX dataset. (B) UMAP representation of the CITE-seq gene expression space labeled by the 17 cell populations annotated by STvEA. (C) Image of the tissue section labeled by the 17 cell populations annotated by STvEA.
Fig. 5
Fig. 5. Identification of spatially resolved gene expression patterns and interactions between cell populations.
(A) mRNA expression levels predicted by STvEA (top) and measured by RNA FISH (middle and bottom) in murine splenic sections for the genes Il1b (left) and Bhlhe41 (right). Red, Cd79a; green, Il1b/Bhlhe41; blue, DAPI (4′,6-diamidino-2-phenylindole). T and B cell zones in the tissue sections are indicated with solid and dashed lines, respectively. We used B cell zones, highlighted by the expression of Cd79a, as a reference for comparisons between RNA FISH and CODEX tissue sections. The relative location of cells expressing Il1b and Bhlhe41 with respect to B cell zones is indicated at the bottom. (B) Identification of interactions between splenic cell populations. Heatmap showing the significance of the spatial colocalization of splenic cell populations, inferred by STvEA. Significant relations (q ≤ 0.05) that cannot be explained by mapping errors (95% confidence level) are indicated with black squares. (C) Some of the significant potential paracrine interactions among red pulp macrophages, basophils, neutrophils, and monocyte-derived macrophages in the red pulp. Interactions were inferred on the basis of the differential expression of the genes encoding for the ligand and receptor and on their spatial colocalization.
Fig. 6
Fig. 6. Transcriptome-guided annotation of mass cytometry data.
(A) UMAP representation of 114,568 mouse splenocytes profiled with CyTOF by Goltsev et al. (2). The representation is labeled with the cell populations identified by STvEA based on a panel of 22 antibodies. (B) The same representation is labeled according to the manually annotated clusters produced by X-shift, PhenoGraph, and SPADE. Automated, transcriptome-guided annotations are consistent with manual analysis but provide an improvement in resolution and reproducibility. (C) UMAP representation of 146,110 splenocytes from a glioma xenograft model profiled with CyTOF by Dusoswa et al. (41). The representation is labeled with the cell populations identified by STvEA based on a panel of 11 antibodies. (D) The same representation is labeled according to the manually annotated clusters produced by X-shift, PhenoGraph, and SPADE. Annotation of this dataset is particularly challenging due to the small size and high redundancy of the antibody panel. In particular, the panel did not include any marker for B cells, which made it difficult to manually annotate this cell population. Although the annotations provided by STvEA are also limited, they represent an improvement with respect to manual annotation procedures.

References

    1. Stack E. C., Wang C., Roman K. A., Hoyt C. C., Multiplexed immunohistochemistry, imaging, and quantitation: A review, with an assessment of Tyramide signal amplification, multispectral imaging and multiplex analysis. Methods 70, 46–58 (2014). - PubMed
    1. Goltsev Y., Samusik N., Kennedy-Darling J., Bhate S., Hale M., Vazquez G., Black S., Nolan G. P., Deep profiling of mouse splenic architecture with CODEX multiplexed imaging. Cell 174, 968–981.e15 (2018). - PMC - PubMed
    1. Jungmann R., Avendano M. S., Woehrstein J. B., Dai M., Shih W. M., Yin P., Multiplexed 3D cellular super-resolution imaging with DNA-PAINT and Exchange-PAINT. Nat. Methods 11, 313–318 (2014). - PMC - PubMed
    1. Cornett D. S., Reyzer M. L., Chaurand P., Caprioli R. M., MALDI imaging mass spectrometry: Molecular snapshots of biochemical systems. Nat. Methods 4, 828–833 (2007). - PubMed
    1. Giesen C., Wang H. A. O., Schapiro D., Zivanovic N., Jacobs A., Hattendorf B., Schüffler P. J., Grolimund D., Buhmann J. M., Brandt S., Varga Z., Wild P. J., Günther D., Bodenmiller B., Highly multiplexed imaging of tumor tissues with subcellular resolution by mass cytometry. Nat. Methods 11, 417–422 (2014). - PubMed

Publication types