. 2021 Mar 5;7(10):eabd6989.
doi: 10.1126/sciadv.abd6989. Print 2021 Mar.

An early warning approach to monitor COVID-19 activity with multiple digital traces in near real time

Affiliations

An early warning approach to monitor COVID-19 activity with multiple digital traces in near real time

Nicole E Kogan et al. Sci Adv. .

Abstract

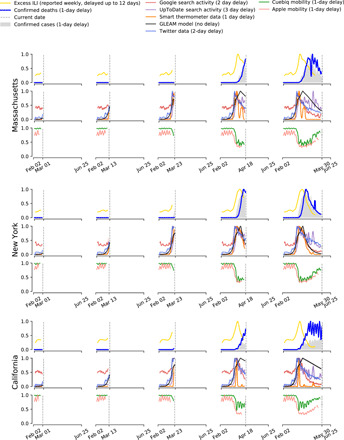
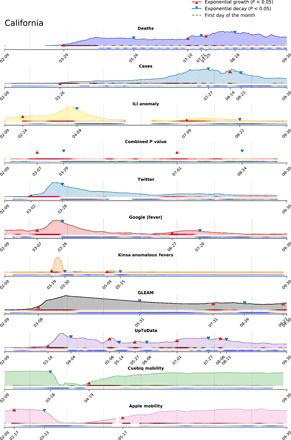
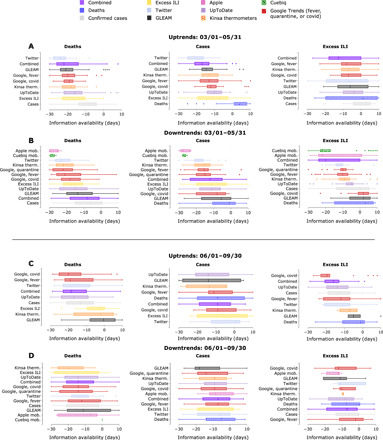
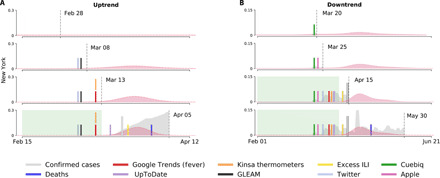
Given still-high levels of coronavirus disease 2019 (COVID-19) susceptibility and inconsistent transmission-containing strategies, outbreaks have continued to emerge across the United States. Until effective vaccines are widely deployed, curbing COVID-19 will require carefully timed nonpharmaceutical interventions (NPIs). A COVID-19 early warning system is vital for this. Here, we evaluate digital data streams as early indicators of state-level COVID-19 activity from 1 March to 30 September 2020. We observe that increases in digital data stream activity anticipate increases in confirmed cases and deaths by 2 to 3 weeks. Confirmed cases and deaths also decrease 2 to 4 weeks after NPI implementation, as measured by anonymized, phone-derived human mobility data. We propose a means of harmonizing these data streams to identify future COVID-19 outbreaks. Our results suggest that combining disparate health and behavioral data may help identify disease activity changes weeks before observation using traditional epidemiological monitoring.


Figures

Fig. 1
Fig. 1. Visualization of the evolution of each COVID-19 proxy in Massachusetts, New York, and California.
Columns depict progressively increasing time periods over which proxies become available (vertical dashed line indicates the latest date in the time period) to illustrate how the availability of different proxies informs upon the evolution of COVID-19. Time series were normalized between 0 and 1 and smoothed using a simple moving average for purposes of visualization. The legend at the top shows each data stream alongside typical delays between measurement and reporting.
Fig. 2
Fig. 2. Visualization of the event detection procedure applied to COVID-19 proxies.
An event is detected by setting a threshold of 0.05 over the P value of the exponential coefficient γ. Under each curve, the P values are shown as colored gradients. Darker red shade signifies increased confidence in the occurrence of an uptrend event, while darker blue shade signifies increased confidence in the occurrence of a downtrend event. Triangular markers are used to signal the date when an uptrend or a downtrend is detected based on the set threshold. The time series are adjusted to account for expected reporting delays in the source of information.
Fig. 3
Fig. 3. Event detection results for pairwise comparisons between COVID-19 proxies and gold standards for U.S. states with available data across two time periods.
(A) and (B) illustrate the timing of proxy-specific uptrends and downtrends, respectively, relative to deaths, confirmed cases, and excess ILI from 1 March 1 to 31 May 2020. (C) and (D) similarly use box plots to illustrate the lag of COVID-19 gold standards relative to COVID-19 proxies from 1 June to 30 September 2020. Multiple events can be detected per state per time period. Proxy data were unavailable for certain states, which reflects their absence in the plots. Box plots show the median (central vertical lines), interquartile range (vertical lines flanking the median), extrema (whiskers), and outliers (dots); differences between input variable (y axis) and response variable (title) exceeding 30 days are omitted. Negative differences indicate that the input variable event activation preceded the response variable event activation. Deaths, confirmed cases, and excess ILI, as well as a combined measure, are included to intercompare gold standards. Box plots are sorted according to median value and shifted to offset delays in real-time availability.
Fig. 4
Fig. 4. Illustration of the evolving probability distribution (in red) for the time-to-event estimation as applied to New York.
The probability distributions are calculated from information up to a specified time horizon (vertical dashed lines). Events that signaled an exponential increase or decrease more than 7 days before the true event (long vertical solid lines) are contained within a green background. (A) The estimated uptrend posterior probability distribution and uptrend events. (B) The estimated downtrend posterior probability distribution and downtrend events.
Fig. 5
Fig. 5. Predictive performance of our time-to-event estimation approach by time horizon on withheld data.
We consider a success to be a high probability corresponding to the date when a confirmed event occurs. Predictive performance is defined as the fraction of confirmed case events our method predicts at a specific time horizon.

Update of

References

    1. Dong E., Du H., Gardner L., An interactive web-based dashboard to track COVID-19 in real time. Lancet Infect. Dis. 20, 533–534 (2020). - PMC - PubMed
    1. Lu F. S., Nguyen A. T., Link N. B., Lipsitch M., Santillana M., Estimating the early outbreak cumulative incidence of COVID-19 in the United States: Three complementary approaches. medRxiv 2020.04.18.20070821 , (2020).
    1. Rosenberg E. S., Tesoriero J. M., Rosenthal E. M., Chung R., Barranco M. A., Styer L. M., Parker M. M., Leung S.-Y. J., Morne J. E., Greene D., Holtgrave D. R., Hoefer D., Kumar J., Udo T., Hutton B., Zucker H. A., Cumulative incidence and diagnosis of SARS-CoV-2 infection in New York. Ann. Epidemiol. 48, 23–29.e4 (2020). - PMC - PubMed
    1. Okell L. C., Verity R., Watson O. J., Mishra S., Walker P., Whittaker C., Katzourakis A., Donnelly C. A., Riley S., Ghani A. C., Gandy A., Flaxman S., Ferguson N. M., Bhatt S., Have deaths from COVID-19 in Europe plateaued due to herd immunity? Lancet 395, e110–e111 (2020). - PMC - PubMed
    1. Corey L., Mascola J. R., Fauci A. S., Collins F. S., A strategic approach to COVID-19 vaccine R&D. Science 368, 948–950 (2020). - PubMed

Publication types