Comparative Study
. 2021 Mar 5;7(10):eabf2467.
doi: 10.1126/sciadv.abf2467. Print 2021 Mar.

Longitudinal antibody repertoire in "mild" versus "severe" COVID-19 patients reveals immune markers associated with disease severity and resolution

Affiliations
Comparative Study

Longitudinal antibody repertoire in "mild" versus "severe" COVID-19 patients reveals immune markers associated with disease severity and resolution

Supriya Ravichandran et al. Sci Adv. .

Abstract

Limited knowledge exists on immune markers associated with disease severity or recovery in patients with coronavirus disease 2019 (COVID-19). Here, we elucidated longitudinal evolution of SARS-CoV-2 antibody repertoire in patients with acute COVID-19. Differential kinetics was observed for immunoglobulin M (IgM)/IgG/IgA epitope diversity, antibody binding, and affinity maturation in "severe" versus "mild" COVID-19 patients. IgG profile demonstrated immunodominant antigenic sequences encompassing fusion peptide and receptor binding domain (RBD) in patients with mild COVID-19 who recovered early compared with "fatal" COVID-19 patients. In patients with severe COVID-19, high-titer IgA were observed, primarily against RBD, especially in patients who succumbed to SARS-CoV-2 infection. The patients with mild COVID-19 showed marked increase in antibody affinity maturation to prefusion SARS-CoV-2 spike that associated with faster recovery from COVID-19. This study revealed antibody markers associated with disease severity and resolution of clinical disease that could inform development and evaluation of effective immune-based countermeasures against COVID-19.


Figures

Fig. 1
Fig. 1. Viral load, serum neutralizing titers, and cytokine analyses of patients with COVID-19 during hospitalization.
(A to K) Viral load in upper respiratory tract of the 11 patients with COVID-19 at various time points as measured by RT–quantitative PCR (qPCR) (blue symbols). SARS-CoV-2–neutralizing antibody titers in serum/plasma for six severe (A to F; red symbols) and five mild (G to K; green symbols) COVID-19 patients at various time points as determined by PRNT50. (L to O) Cytokine levels (L, IL-6; M, IL-8; N, MCP-1; and O, MIP-1β) of fourfold diluted plasma/serum samples at various time points in the 11 patients with COVID-19 as analyzed via a Bio-Plex Pro Human Cytokine Panel 17-Plex assay. (P) AUC for the four cytokine/chemokines of the 11 patients with COVID-19. Limit of detection (LOD) for the assay is shown as dashed line. The statistical significances between the groups were determined using Kruskal-Wallis multiple comparisons test for AUC (AUC values) of severe patients (red) and mild patients (green). The differences were considered statistically significant with a 95% confidence interval when the P value was less than 0.05. *P < 0.05, **P < 0.001.
Fig. 2
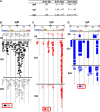
Fig. 2. IgM, IgG, and IgA antibody repertoires elicited in patient with severe COVID-19 who succumbed to SARS-CoV-2 infection.
(A) Distribution of phage clones after affinity selection on post–SARS-CoV-2 infection samples. Number of IgM-, IgG-, and IgA-bound phage clones selected using SARS-CoV-2 spike GFPDL on polyclonal samples from days 6 (D6), 21 (D21), and 42 (D42) following symptom onset in patient with fatal COVID-19 (S-01). (B to D) IgM, IgG, and IgA antibody epitope repertoire recognized in the SARS-CoV-2–infected serum/plasma of deceased patient with COVID-19 (S-01) at different days after onset of symptoms and their alignment to the spike protein of SARS-CoV-2. CD, connector domain; CH, central helix; CT, cytoplasmic tail; FP, fusion peptide; HR, heptad repeat; SP, signal peptide. Graphical distribution of representative clones with a frequency of ≥2, obtained after affinity selection, is shown. The horizontal position and the length of the bars indicate the peptide sequence displayed on the selected phage clone to its homologous sequence in the SARS-CoV-2 spike on alignment. The thickness of each bar represents the frequency of repetitively isolated phage. Scale value for IgM, IgG, and IgA is shown enclosed in a red box beneath the respective alignments. The GFPDL affinity selection data were performed in duplicate (two independent experiments by researcher in the laboratory, who was blinded to sample identity), and similar number of phage clones and epitope repertoire was observed in both phage display analysis.
Fig. 3
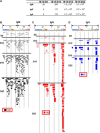
Fig. 3. Evolution of IgM, IgG, and IgA antibody repertoire in patient with mild COVID-19.
(A) Distribution of phage clones after affinity selection in serum following SARS-CoV-2 infection. Number of IgM, IgG, and IgA bound phage clones selected using SARS-CoV-2 spike GFPDL on polyclonal samples from days 5 (D5), 12 (D12), 15 (D15), and 25 (D25) following symptom onset in patient with mild COVID-19 (M-10). (B to D) IgM, IgG, and IgA antibody epitope repertoire recognized in the SARS-CoV-2–infected serum/plasma at different days after onset of symptoms and their alignment to the spike protein of SARS-CoV-2. Graphical distribution of representative clones with a frequency of ≥2, obtained after affinity selection, is shown. The horizontal position and the length of the bars indicate the peptide sequence displayed on the selected phage clone to its homologous sequence in the SARS-CoV-2 spike on alignment. The thickness of each bar represents the frequency of repetitively isolated phage. Scale value for IgM, IgG, and IgA is shown enclosed in a red box beneath the respective alignments. The GFPDL affinity selection data were performed in duplicate (two independent experiments by researcher in the laboratory, who was blinded to sample identity), and similar number of phage clones and epitope repertoire was observed in both phage display analysis.
Fig. 4
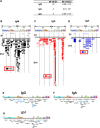
Fig. 4. Elucidation of IgM, IgG, and IgA antibody repertoire following SARS-CoV-2 infection in patient with mild COVID-19.
(A) Distribution of phage clones after affinity selection with COVID-19 serum. Number of IgM, IgG, and IgA bound phage clones with days 1 (D1) and 14 (D14) serum following symptom onset of patient with mild COVID-19 (M-14). (B to D) SARS-CoV-2 IgM, IgG, and IgA epitope repertoire of the patient with mild COVID-19 (M-14). Graphical distribution of affinity-selected clones with frequency of ≥2 is shown. The horizontal position and length of bars indicate the peptide sequence displayed on selected phage clone to its homologous sequence in SARS-CoV-2 spike. Thickness of each bar represents frequency of repetitively isolated phage. Scale value for IgM, IgG, and IgA is shown in a red box beneath the respective alignments. (E to G) Antibody epitope profile following SARS-CoV-2 infection. Antigenic regions/sites within SARS-CoV-2 spike sequence (GenBank: MN908947.3) recognized by serum/plasma antibodies (based on data presented in Figs. 2 to 4). Antigenic sites shown in cyan were uniquely recognized by post–SARS-CoV-2 infection IgG (E), IgA (F), or IgM (G) only in patients with mild but not severe COVID-19. Antigenic sites shown in red were uniquely recognized by post–SARS-CoV-2 infection IgG (E), IgA (F), or IgM (G) antibodies only in patients with severe but not mild COVID-19. Epitopes of each protein are numbered in black.
Fig. 5
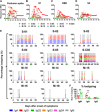
Fig. 5. SPR-based analysis of human antibody response following SARS-CoV-2 infection.
Serial dilutions of each serum/plasma sample collected at different time points from patients with COVID-19 were analyzed for antibody binding to SARS-CoV-2 spike and subdomains (figs. S7 and S8). (A to D) Total antibody binding is represented in SPR RU for six patients with severe COVID-19 (in shades of red) and five mild patients (in shades of green) for binding to prefusion spike (A), S1 domain (B), RBD (C), and S2 domain (D). Total antibody binding shown is observed maximum RU for 10-fold diluted serum/plasma sample. (E) Antibody isotype of SARS-CoV-2 prefusion spike–binding antibodies. The isotype composition of serum/plasma antibodies bound to prefusion spike. The RU for each anti-spike protein antibody isotype was divided by total RU for all antibody isotypes combined to calculate percentage of each antibody isotype for individual serum/plasma sample. (F) Mean percentage of IgM, IgG, and IgA antibody isotype bound to SARS-CoV-2 prefusion spike is shown for patients with severe (red) versus mild (green) COVID-19. The statistical significances between groups were determined using Kruskal-Wallis multiple comparisons test for patients with severe (red) versus mild (green) COVID-19. The differences were considered statistically significant with 95% confidence interval when P value was less than 0.05. **P < 0.01.
Fig. 6
Fig. 6. Antibody affinity maturation of human antibody response following SARS-CoV-2 infection in patients with COVID-19 and association with disease severity.
(A to D) Polyclonal antibody affinity maturation to SARS-CoV-2 spike proteins was determined by SPR. Binding affinity of serially diluted after infection serum/plasma of each of the six patients with severe COVID-19 (in shades of red) and five mild patients (in shades of green) to prefusion spike (A), S1 domain (B), RBD (C), and S2 domain (D). All SPR experiments were performed twice, and data shown are average value of two experimental runs. Off-rate was calculated and shown only for samples that demonstrated antibody binding of 10 to 100 RU in SPR. (E) Antibody affinity (as measured by dissociation off-rate per second) against SARS-CoV-2 prefusion spike, S1, S2, and RBD for the final day samples from each of the severe (red) versus mild (green) COVID-19 patients. The statistical significances between the groups were determined using Kruskal-Wallis multiple comparisons test for severe patients (red) and mild patients (green). The differences were considered statistically significant with 95% confidence interval when P value was less than 0.05. *P < 0.05. (F to P) Relationship of serum antibody affinity against prefusion spike (blue symbols; off-rate per second) and clinical symptom scores for six severe (F to K; red symbols) and five mild (L to P; green symbols) at various days after onset of symptoms in patients with COVID-19.

References

    1. Johns Hopkins University & Medicine Center for Systems Science and Engineering (CSSE) (2020), vol. 2020.
    1. Callaway E., The race for coronavirus vaccines: A graphical guide. Nature 580, 576–577 (2020). - PubMed
    1. Shen C., Wang Z., Zhao F., Yang Y., Li J., Yuan J., Wang F., Li D., Yang M., Xing L., Wei J., Xiao H., Yang Y., Qu J., Qing L., Chen L., Xu Z., Peng L., Li Y., Zheng H., Chen F., Huang K., Jiang Y., Liu D., Zhang Z., Liu Y., Liu L., Treatment of 5 critically ill patients with COVID-19 with convalescent plasma. JAMA 323, 1582–1589 (2020). - PMC - PubMed
    1. Roback J. D., Guarner J., Convalescent plasma to treat COVID-19: Possibilities and challenges. JAMA 323, 1561–1562 (2020). - PubMed
    1. Brouwer P. J. M., Caniels T. G., van der Straten K., Snitselaar J. L., Aldon Y., Bangaru S., Torres J. L., Okba N. M. A., Claireaux M., Kerster G., Bentlage A. E. H., van Haaren M. M., Guerra D., Burger J. A., Schermer E. E., Verheul K. D., van der Velde N., van der Kooi A., van Schooten J., van Breemen M. J., Bijl T. P. L., Sliepen K., Aartse A., Derking R., Bontjer I., Kootstra N. A., Wiersinga W. J., Vidarsson G., Haagmans B. L., Ward A. B., de Bree G. J., Sanders R. W., van Gils M. J., Potent neutralizing antibodies from COVID-19 patients define multiple targets of vulnerability. Science 369, 643–650 (2020). - PMC - PubMed

Publication types

MeSH terms