. 2021 Mar 5;6(57):eabe3218.
doi: 10.1126/sciimmunol.abe3218.

The ChAT-acetylcholine pathway promotes group 2 innate lymphoid cell responses and anti-helminth immunity

Affiliations

The ChAT-acetylcholine pathway promotes group 2 innate lymphoid cell responses and anti-helminth immunity

Coco Chu et al. Sci Immunol. .

Abstract

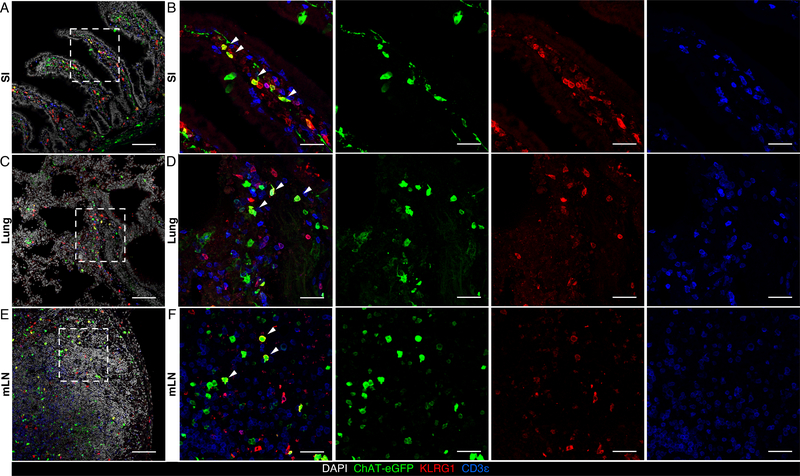
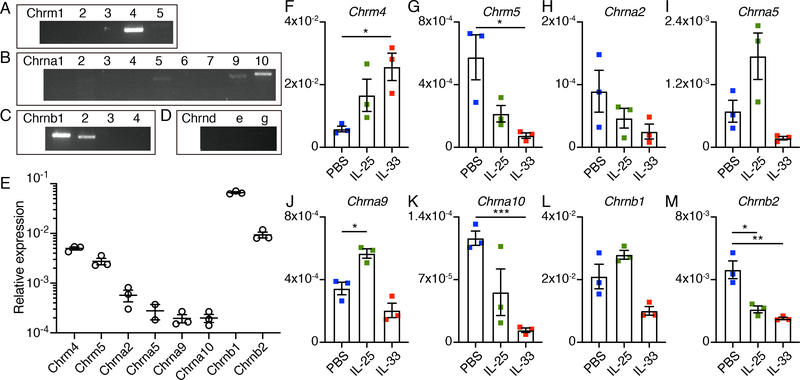
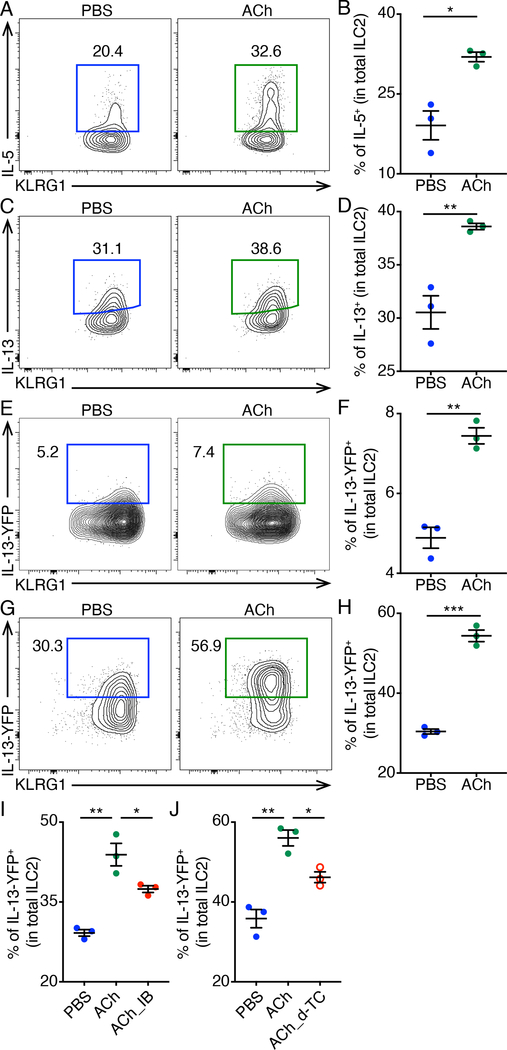
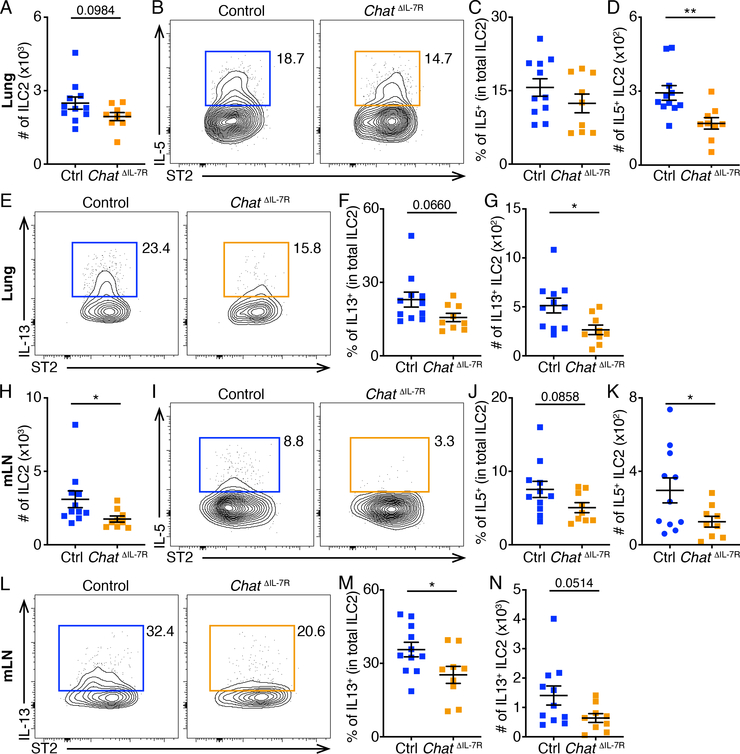
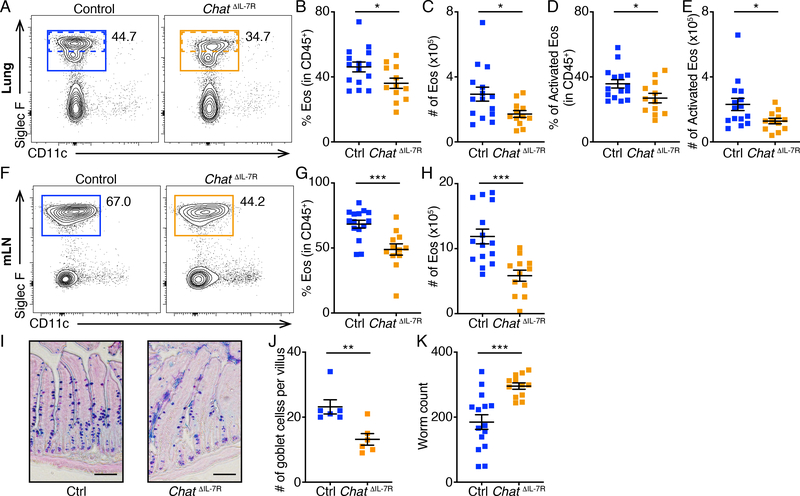
Group 2 innate lymphoid cells (ILC2s) reside in multiple tissues, including lymphoid organs and barrier surfaces, and secrete type 2 cytokines including interleukin-5 (IL-5), IL-9, and IL-13. These cells participate in multiple physiological processes including allergic inflammation, tissue repair, metabolic homeostasis, and host defense against helminth infections. Recent studies indicate that neurotransmitters and neuropeptides can play an important role in regulating ILC2 responses; however, the mechanisms that underlie these processes in vivo remain incompletely defined. Here, we identify that activated ILC2s up-regulate choline acetyltransferase (ChAT)-the enzyme responsible for the biosynthesis of acetylcholine (ACh)-after infection with the helminth parasite Nippostrongylus brasiliensis or treatment with alarmins or cytokines including IL-25, IL-33, and thymic stromal lymphopoietin (TSLP). ILC2s also express acetylcholine receptors (AChRs), and ACh administration promotes ILC2 cytokine production and elicits expulsion of helminth infection. In accordance with this, ChAT deficiency in ILC2s leads to defective ILC2 responses and impaired immunity against helminth infection. Together, these results reveal a previously unrecognized role of the ChAT-ACh pathway in promoting type 2 innate immunity to helminth infection.


Conflict of interest statement

Competing interests: D.A. has contributed to scientific advisory boards at Genentech, Pfizer, Takeda, FARE, and the KRF. The other authors declare no competing interests.

Figures

Fig. 1.
Fig. 1.. Upregulated ChAT-eGFP expression in ILC2s following N. brasiliensis infection.
(A to F) Representative flow cytometry plots (A and D), population frequencies (B and E) and numbers (C and F) of ChAT+ ILC2s in the lung (A to C) and mLNs (D to F) of uninfected (uninf.) or N. brasiliensis-infected (inf.) ChATBAC-eGFP mice analyzed on Day 7 post-infection, gated on total ILC2s. (G and H) Representative flow cytometry plot (G) and population frequencies (H) of inflammatory (ILC2INFLAM, red) and natural (ILC2NAT, blue) ILC2s in the mLNs of N. brasiliensis-infected ChATBAC-eGFP mice analyzed on Day 7 post-infection, gated on total ILC2s (G) or ChAT+ ILC2s (H). Data are representative of two independent experiments. n = 3 mice per group. Data are mean ± SEM. ** P < 0.01, *** P < 0.001.
Fig. 2.
Fig. 2.. ChAT-eGFP+ ILC2s in the small intestine, mLN and lung of N. brasiliensis-infected mice.
(A to F) Representative sections of small intestine (A and B), lung (C and D), and mLN (E and F) from ChAT-eGFP reporter mice analyzed on Day 7 of N. brasiliensis infection, stained for DAPI (white), ChAT-eGFP (green), KLRG1 (red) and CD3ε (blue). Arrows show representative ChAT-eGFP+ ILC2s. Data are representative of two independent experiments. Scale bars = 100 μm in (A), (C) and (E), and 30 μm in (B), (D) and (F).
Fig. 3.
Fig. 3.. Upregulated ChAT-eGFP expression in ILC2s after IL-33 treatment.
(A to C) Representative flow cytometry plots (A), population frequencies (B) and mean fluorescence intensities (C) of ChAT+ ILC2s in sort-purified small intestinal ILC2s in vitro cultured for 3 days in IL-2 and IL-7 with or without IL-33. (D to I) Representative flow cytometry plots (D and G), population frequencies (E and H) and numbers (F and I) of ChAT+ ILC2s in the lung (D to F) and mLNs (G to I) of PBS or IL-33-treated ChATBAC-eGFP mice, gated on total ILC2s. (J to L) Representative population frequencies of ChAT+ ILC2s in the mLNs (J), ceca (K) or lung (L) of TSLP or IL-25-treated (J), T. muris-infected (K), or Alternaria-treated (L) ChATBAC-eGFP mice, gated on total ILC2s. Data are representative of two independent experiments. n = 3 mice per group. Data are mean ± SEM. * P < 0.05, ** P < 0.01, *** P < 0.001, **** P < 0.0001.
Fig. 4.
Fig. 4.. AChR expression in ILC2s.
(A to D) RT-PCR analysis of expression of mAChRs (A), α-nAChR subunits (B), β-nAChR subunits (C) and other nAChR subunits (D) in small intestinal ILC2s cultured for 3 days in the presence of IL-2, IL-7 and IL-33. (E) qPCR analysis of the expression of candidate AChRs in ILC2s sort-purified from the small intestine, presented relative to Hprt1. Each symbol represents data from ILC2s pooled from 10 mice. (F to M) qPCR analysis of the expression of candidate mAChRs (F and G), α-nAChR subunits (H to K) and β-nAChR subunits (L and M) in small intestinal ILC2s cultured for 3 days with IL-2 and IL-7 alone (labeled PBS) or additionally supplemented with IL-25 or IL-33, presented relative to Hprt1. Each symbol represents data from sort-purified small intestinal ILC2s pooled from 10 mice in the PBS group, 3 mice in the IL-25 group, and 2 mice in the IL-33 group. Data are mean ± SEM. * P < 0.05, ** P < 0.01, *** P < 0.001.
Fig. 5.
Fig. 5.. Increased ILC2 cytokine production after ACh treatment.
(A to D) Representative flow cytometry plots (A and C) and population frequencies (B and D) of IL-5+ (A and B) and IL-13+ (C and D) ILC2s after 4 h incubation in medium with or without ACh, in the presence of IL-2, IL-7, IL-25, IL-33, PMA and ionomycin, as determined by intracellular cytokine staining. (E and F) Representative flow cytometry plots (E) and population frequencies (F) of IL-13-YFP+ ILC2s after 4 h incubation in medium with or without ACh. (G and H) Representative flow cytometry plots (G) and population frequencies (H) of IL-13-YFP+ ILC2s after 4 h incubation in medium with or without ACh, in the presence of IL-2, IL-7, IL-25 and IL-33. (I and J) Representative population frequencies of IL-13-YFP+ ILC2s after 4 h incubation in medium with or without ACh and indicated AChR antagonists, in the presence of IL-2, IL-7, IL-25 and IL-33. Data are representative of two independent experiments. n = 3 mice per group. Data are mean ± SEM. * P < 0.05, ** P < 0.01, *** P < 0.001.
Fig. 6.
Fig. 6.. Enhanced ILC2 responses and accelerated expulsion of N. brasiliensis after ACh treatment.
(A to G) Numbers of total ILC2s (A), representative flow cytometry plots (B and E), population frequencies (C and F) and numbers (D and G) of IL-5+ (B to D) and IL-13+ (E to G) ILC2s in the lungs of PBS or ACh-treated mice analyzed on Day 7 of N. brasiliensis infection. (H to L) Representative flow cytometry plots (H), population frequencies (I and K) and numbers (J and L) of eosinophils (I and J) and Siglec Fhigh activated eosinophils (K and L) in the lungs of PBS or ACh-treated mice analyzed on Day 7 of N. brasiliensis infection. Data are pooled from three independent experiments. n = 13 mice per group. (M and N) Representative sections (M) and goblet cell numbers (N) of small intestine from PBS or ACh-treated mice analyzed on Day 7 of N. brasiliensis infection with periodic acid–Schiff (PAS)–Alcian blue staining. Data are pooled from two independent experiments. n = 6 mice per group. (O) Worm counts in the small intestine of PBS or ACh-treated mice analyzed on day 7 of N. brasiliensis infection. Data are pooled from two independent experiments. n = 9 mice per group. Data are mean ± SEM. ** P < 0.01, *** P < 0.001, **** P < 0.0001.
Fig. 7.
Fig. 7.. Defective ILC2 responses in ChatΔIL−7R mice.
(A to N) Numbers of total ILC2s (A and H), representative flow cytometry plots (B, E, I and L), population frequencies (C, F, J and M) and numbers (D, G, K and N) of IL-5+ (B to D and I to K) and IL-13+ (E to G and L to N) ILC2s in the lung (A to G) and mLNs (H to N) of control or ChatΔIL−7R mice analyzed on Day 7 of N. brasiliensis infection. Data are pooled from three independent experiments. Control, n = 11. ChatΔIL−7R, n = 9. Data are mean ± SEM. * P < 0.05, ** P < 0.01.
Fig. 8.
Fig. 8.. Defective eosinophil responses and helminth expulsion in ChatΔIL−7R mice.
(A to H) Representative flow cytometry plots (A and F), population frequencies (B, D and G) and numbers (C, E and H) of eosinophils (B, C, G and H) and Siglec Fhigh activated eosinophils (D and E) in the lungs (A to E) and mLNs (F to H) of control or ChatΔIL−7R mice analyzed on Day 7 of N. brasiliensis infection. (I and J) Representative sections (I) and goblet cell numbers (J) of small intestine from control or ChatΔIL−7R mice analyzed on Day 7 of N. brasiliensis infection with periodic acid–Schiff (PAS)–Alcian blue staining. Data are pooled from two independent experiments. n = 6 mice per group. (K) Worm counts in the small intestine of control or ChatΔIL−7R mice analyzed on day 7 of N. brasiliensis infection. Data are pooled from four independent experiments. Control, n = 15. ChatΔIL−7R, n = 12. Data are mean ± SEM. * P < 0.05, *** P < 0.001.

Similar articles

Cited by

References

    1. Artis D, Spits H, The biology of innate lymphoid cells. Nature 517, 293–301 (2015). - PubMed
    1. Molofsky AB, Savage AK, Locksley RM, Interleukin-33 in Tissue Homeostasis, Injury, and Inflammation. Immunity 42, 1005–1019 (2015). - PMC - PubMed
    1. Eberl G, Colonna M, Di Santo JP, McKenzie AN, Innate lymphoid cells. Innate lymphoid cells: a new paradigm in immunology. Science 348, aaa6566 (2015). - PMC - PubMed
    1. Moro K et al., Innate production of T(H)2 cytokines by adipose tissue-associated c-Kit(+)Sca-1(+) lymphoid cells. Nature 463, 540–544 (2010). - PubMed
    1. Neill DR et al., Nuocytes represent a new innate effector leukocyte that mediates type-2 immunity. Nature 464, 1367–1370 (2010). - PMC - PubMed

Publication types

MeSH terms