Clinical Trial
. 2021 Jun;70(6):1265-1277.
doi: 10.2337/db20-1172. Epub 2021 Mar 4.

Effects of Gastric Bypass Surgery on the Brain: Simultaneous Assessment of Glucose Uptake, Blood Flow, Neural Activity, and Cognitive Function During Normo- and Hypoglycemia

Affiliations
Clinical Trial

Effects of Gastric Bypass Surgery on the Brain: Simultaneous Assessment of Glucose Uptake, Blood Flow, Neural Activity, and Cognitive Function During Normo- and Hypoglycemia

Kristina E Almby et al. Diabetes. 2021 Jun.

Abstract

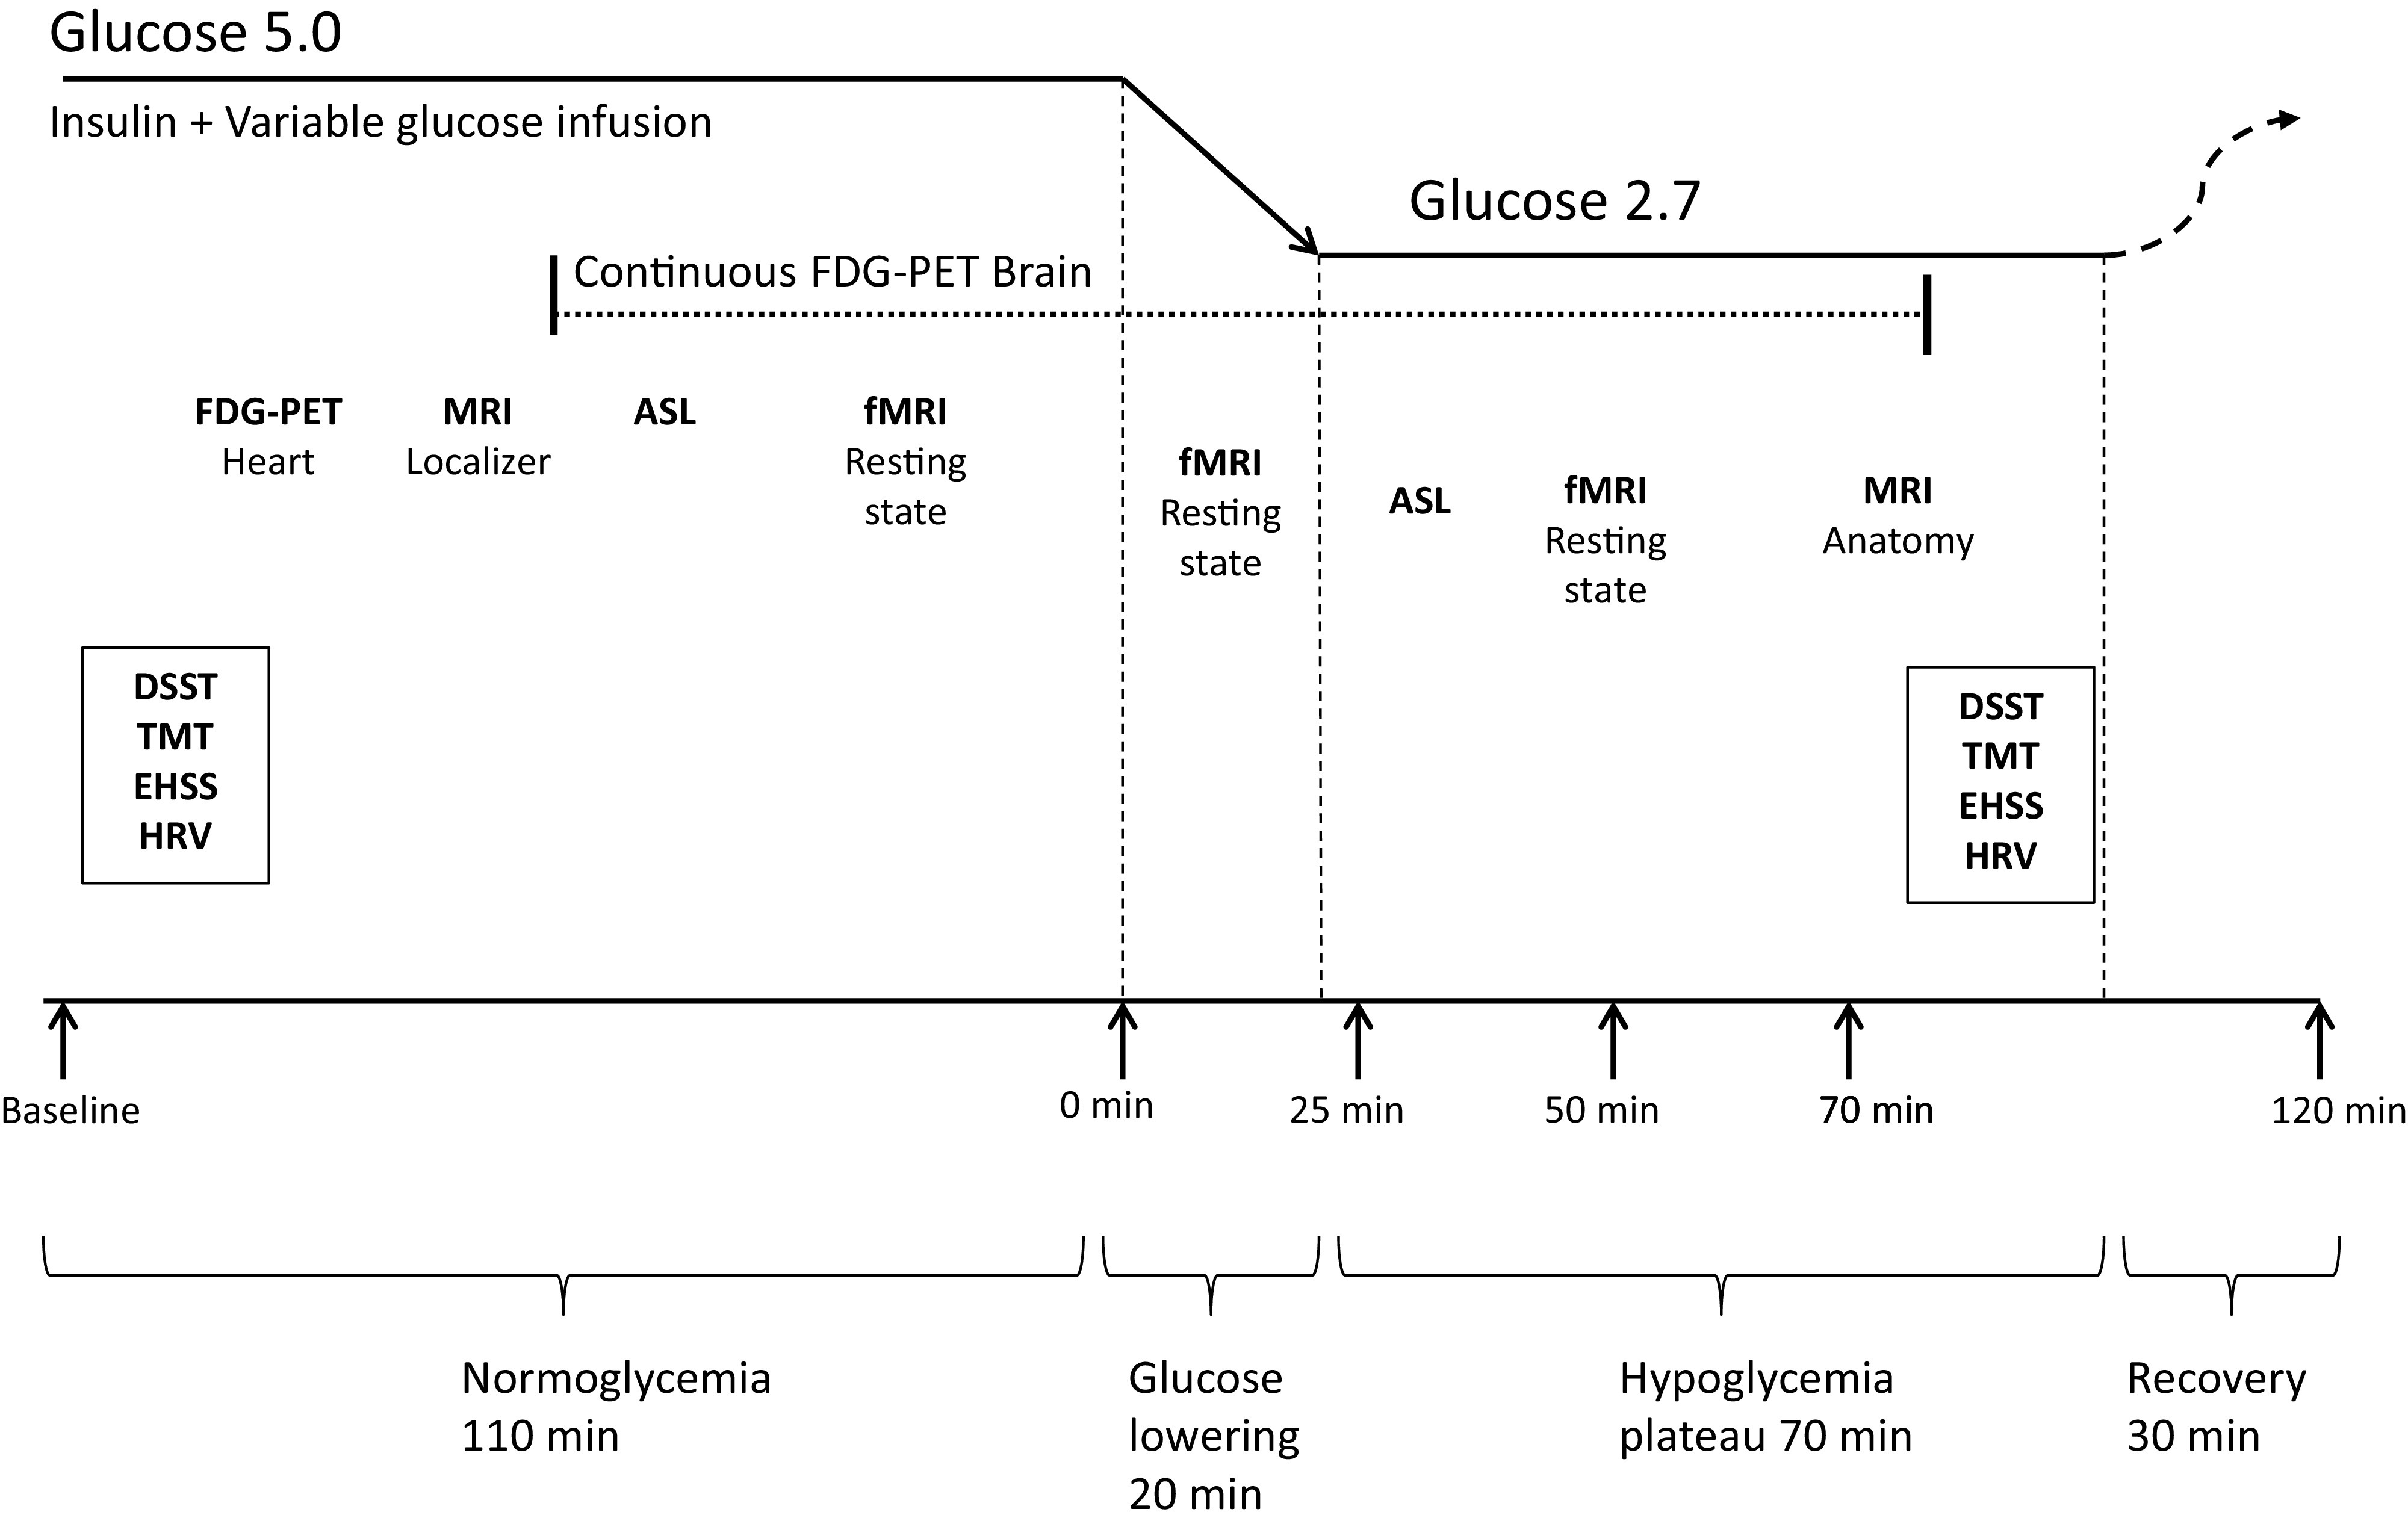
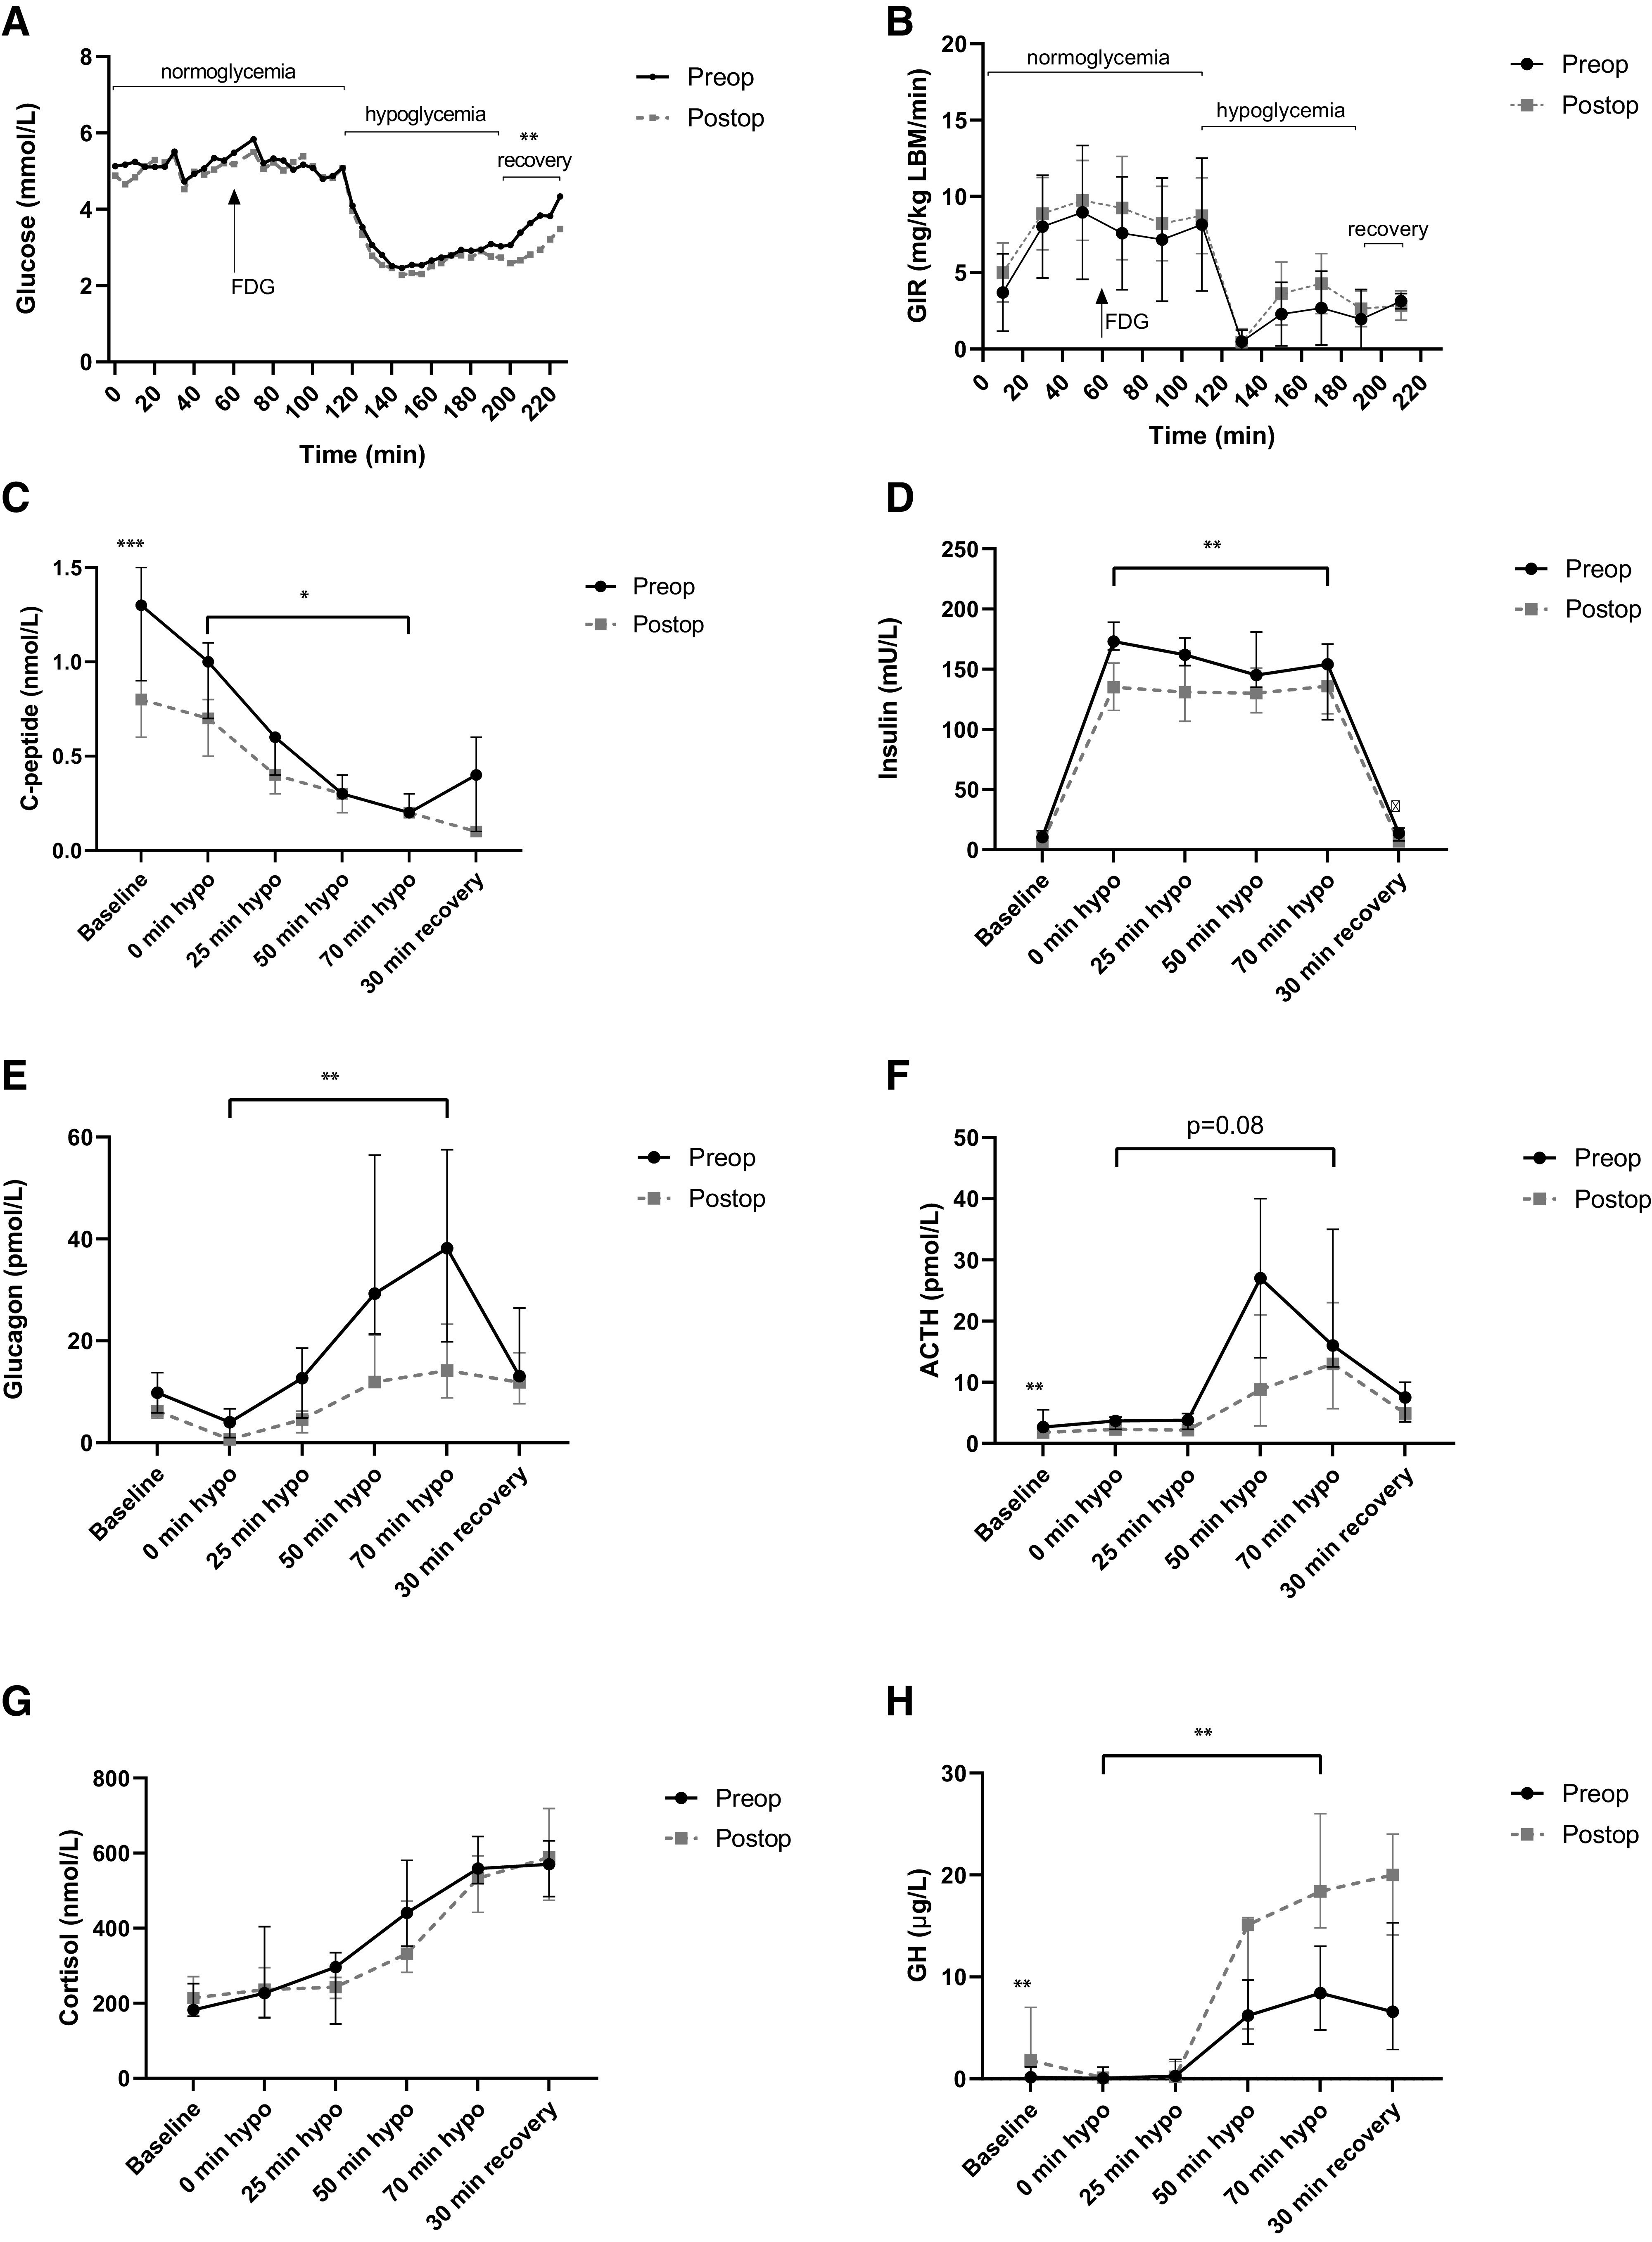
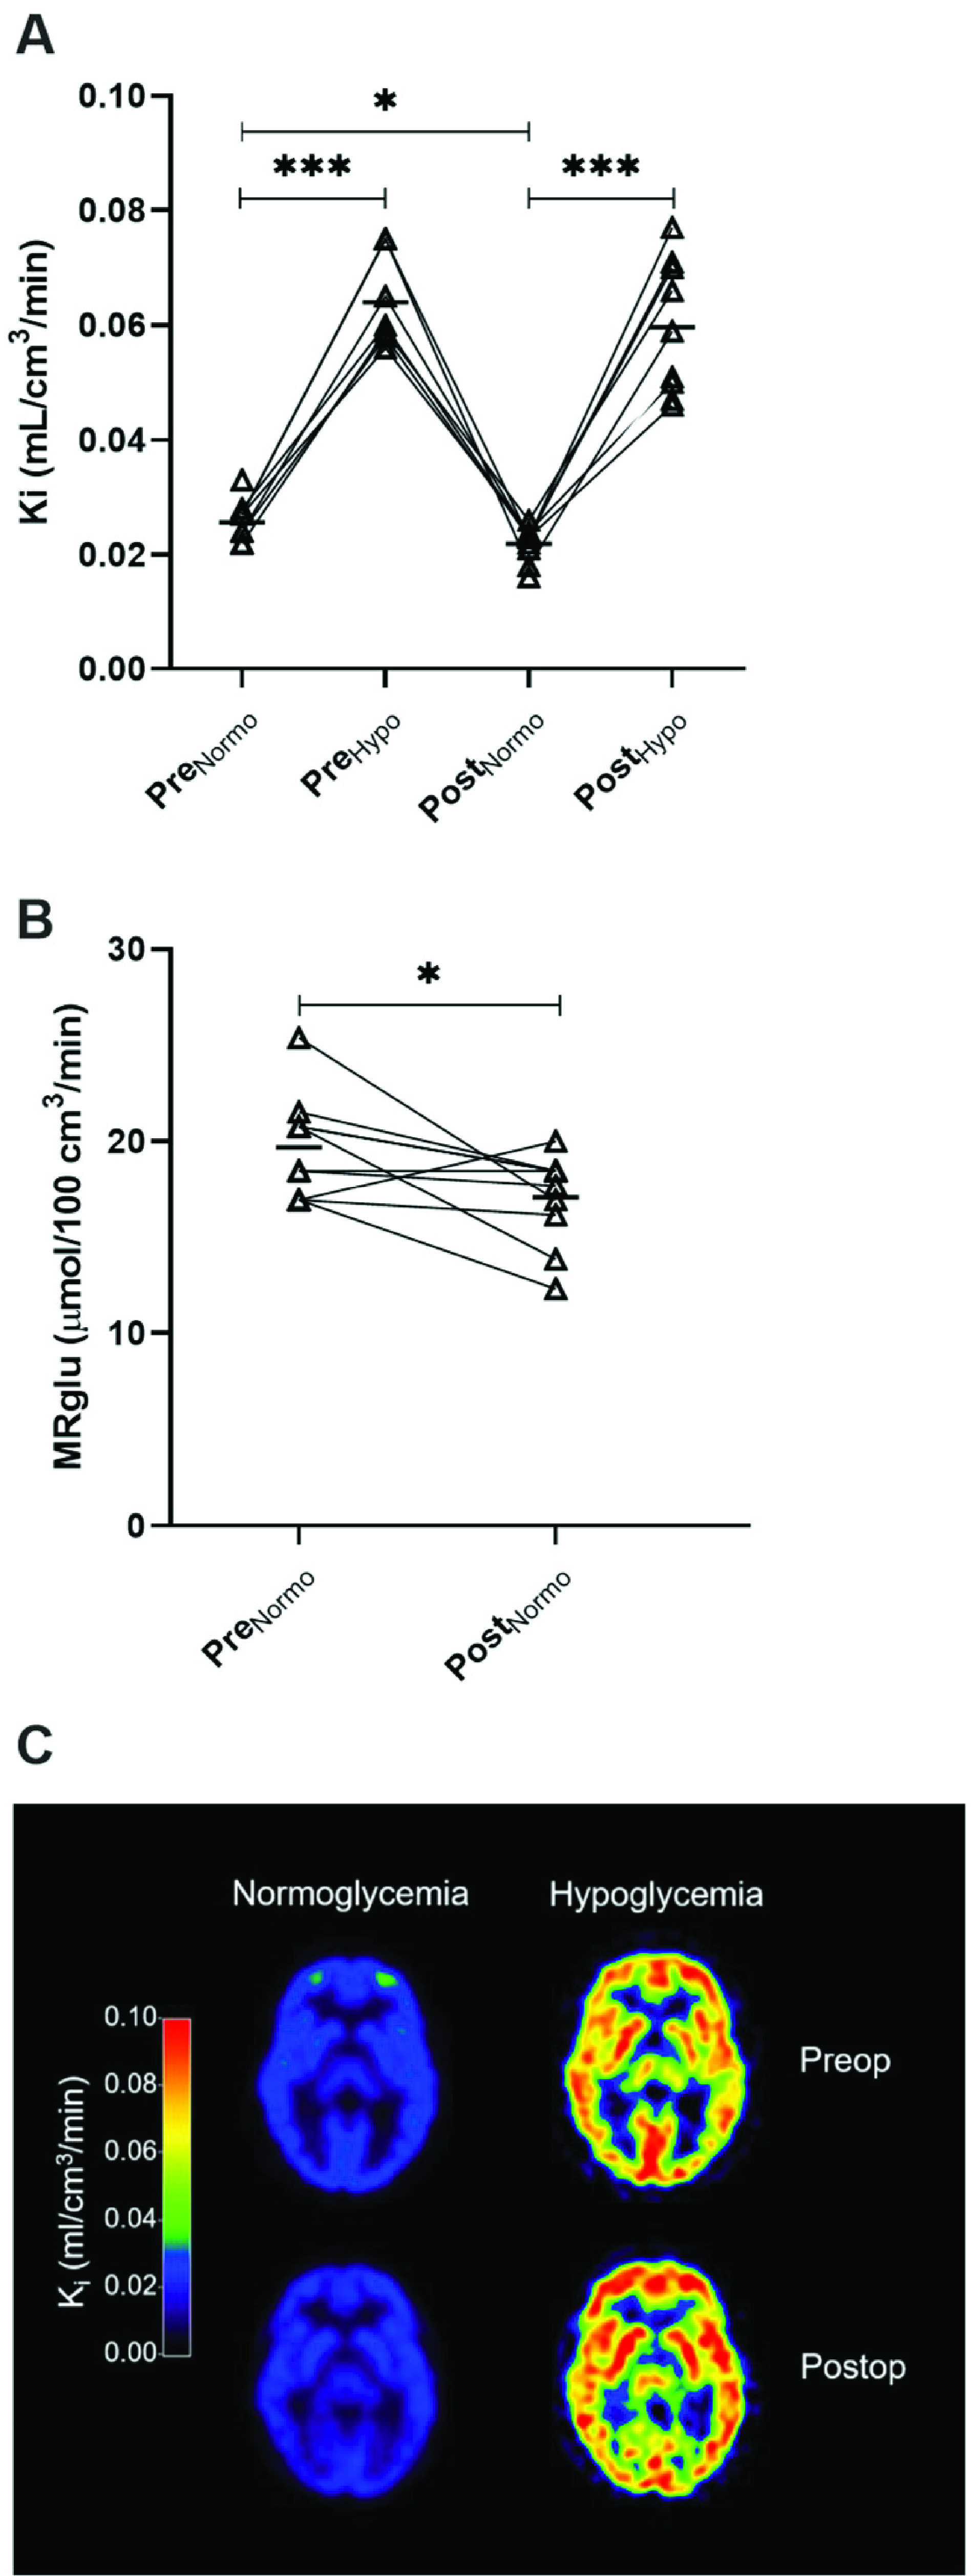
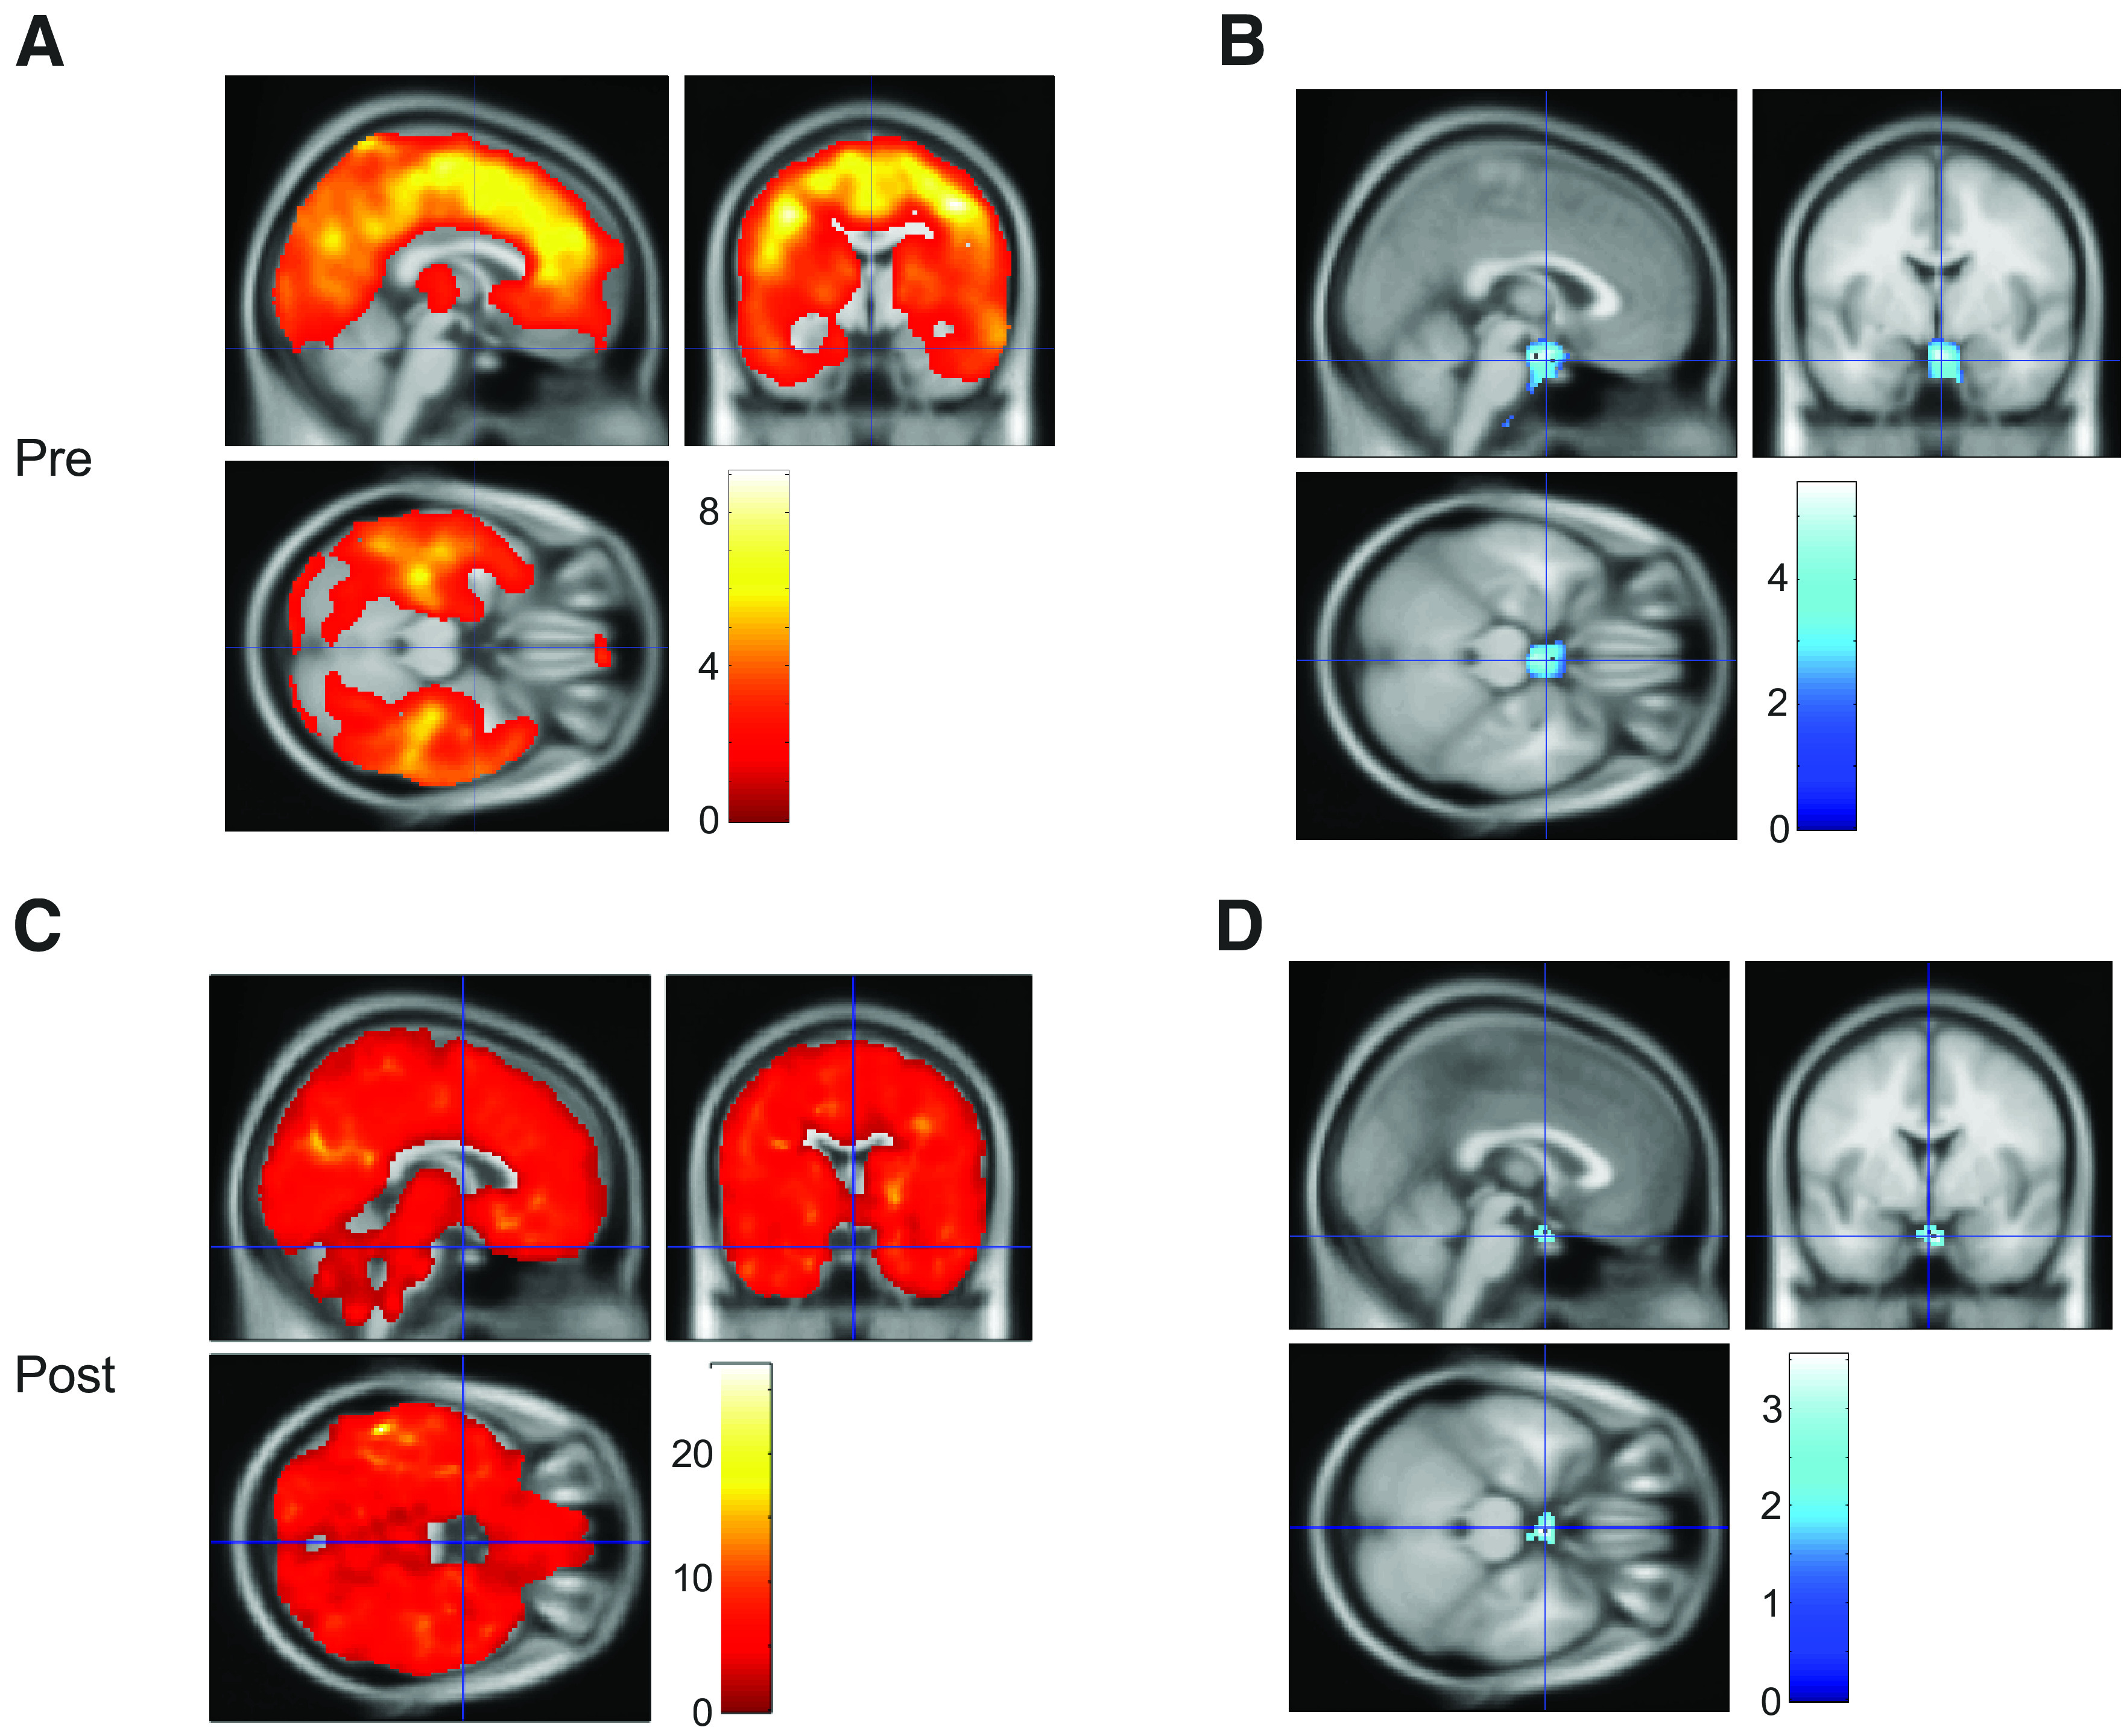
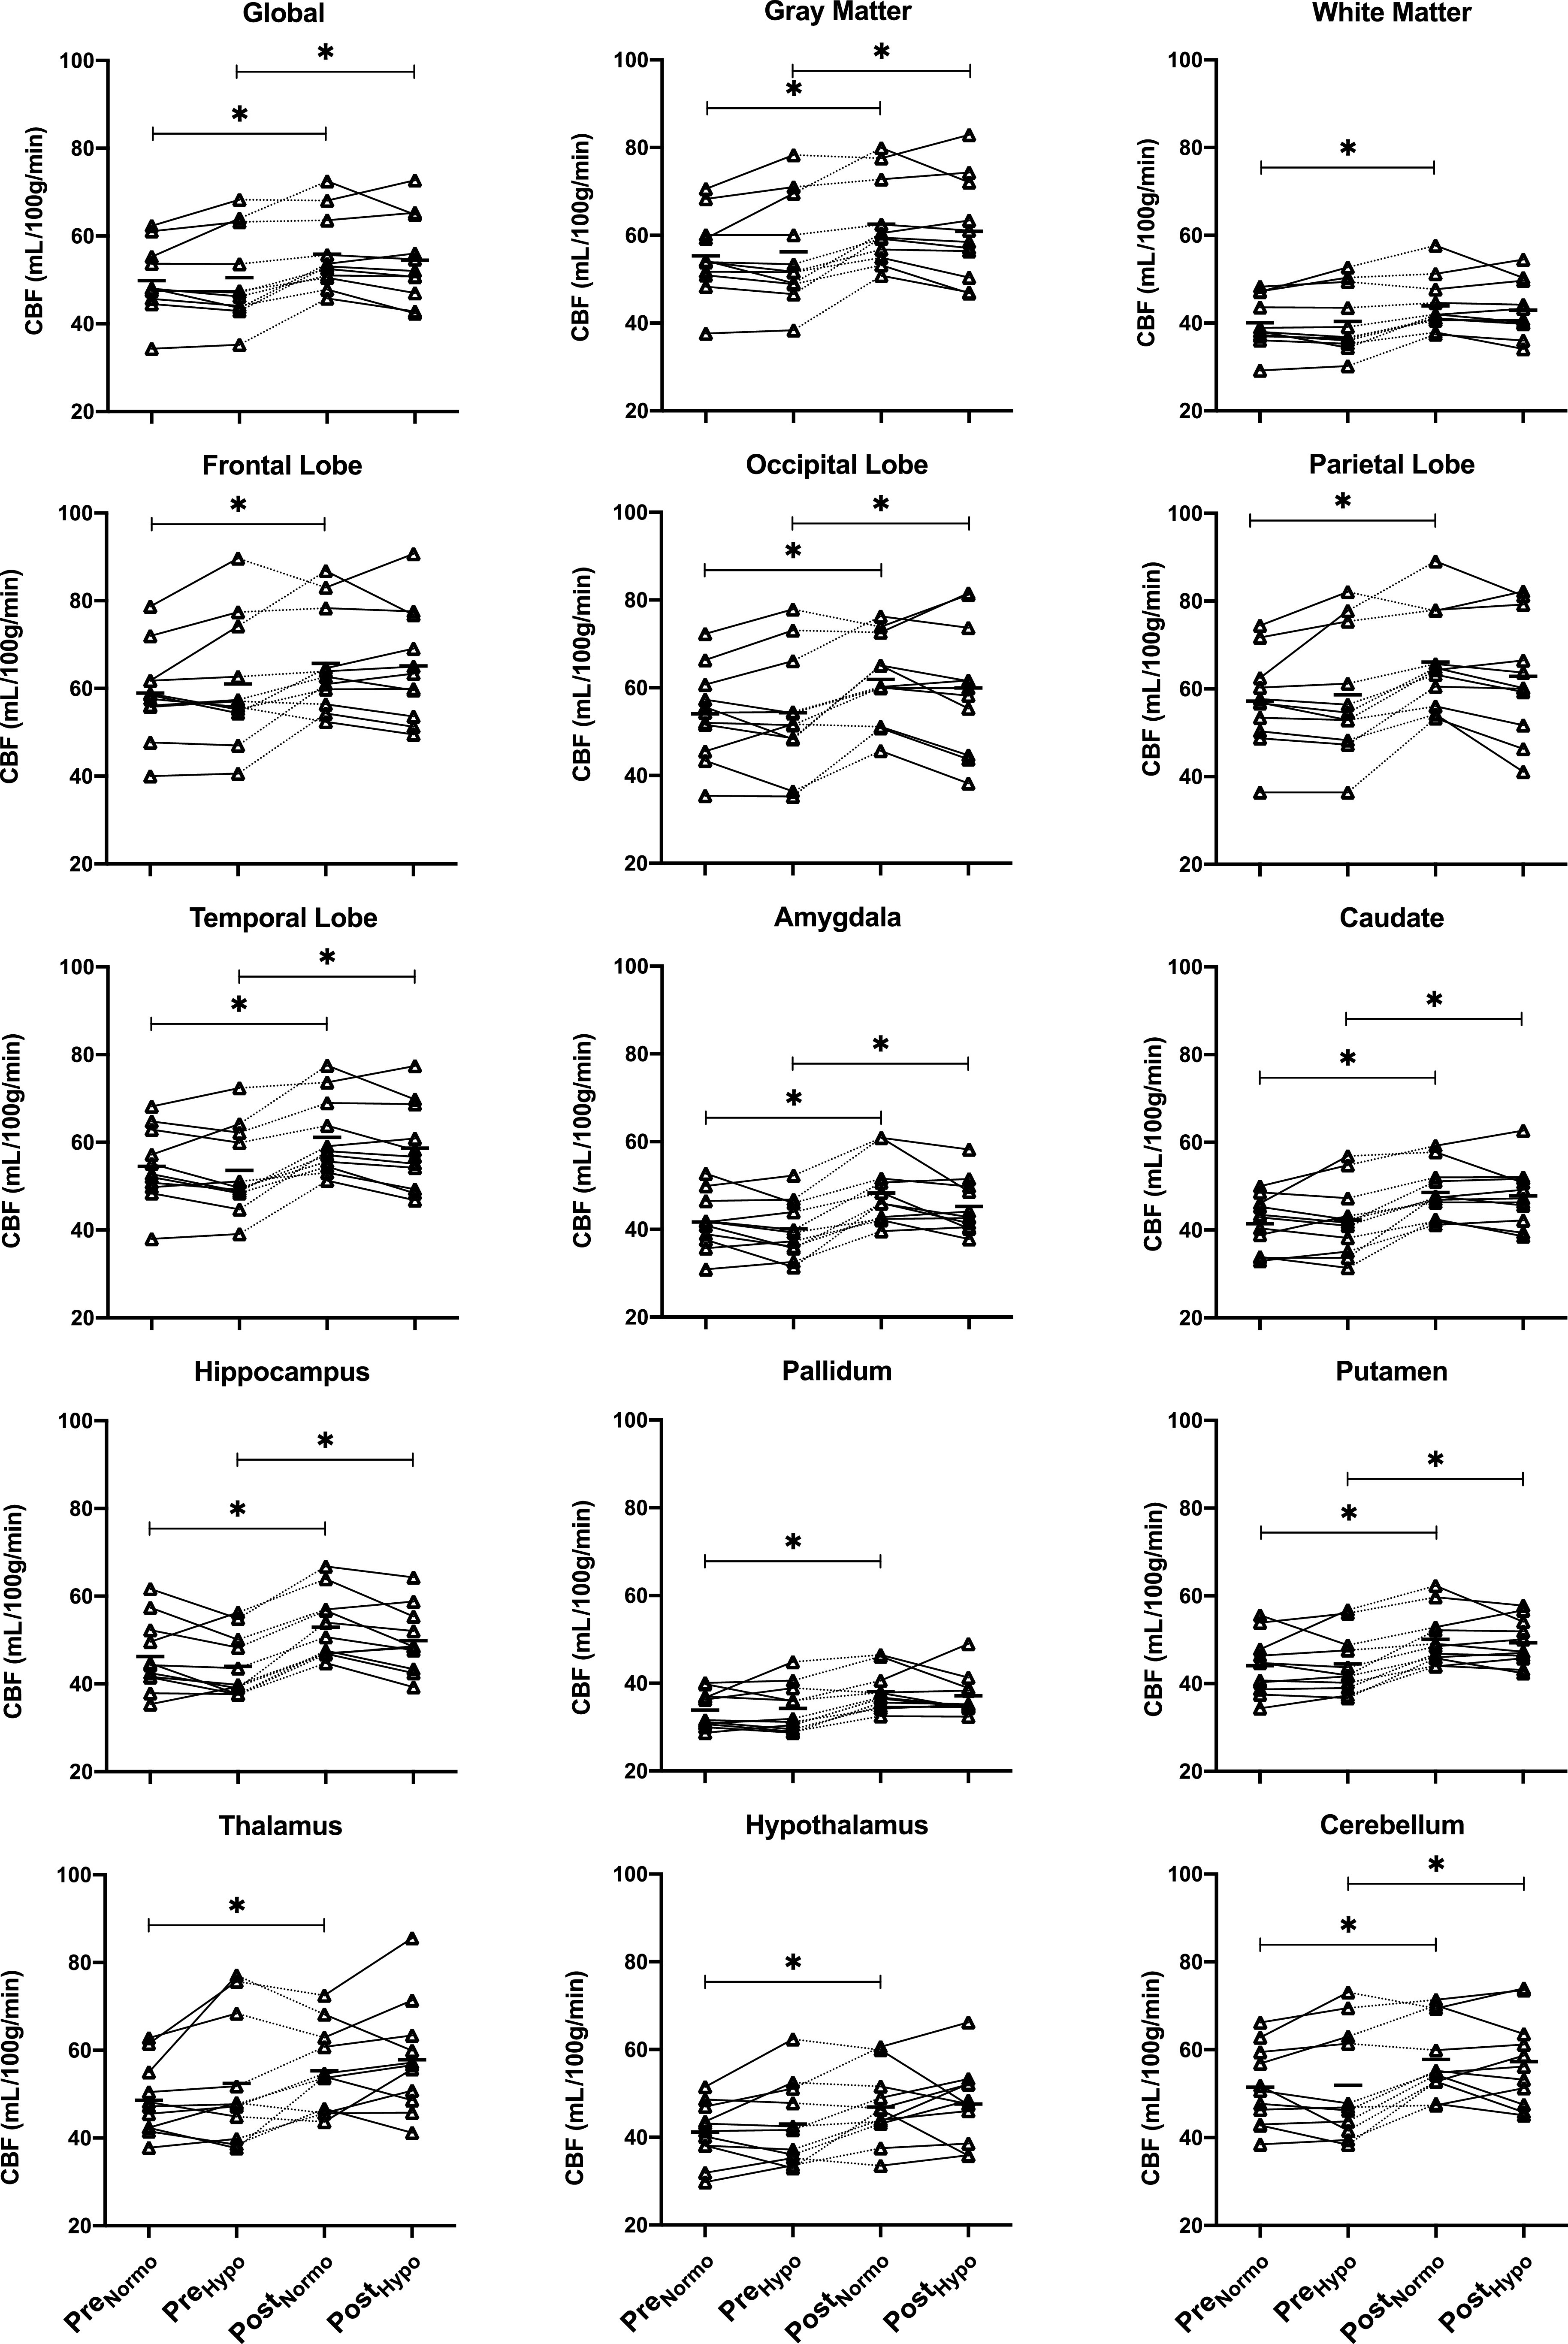
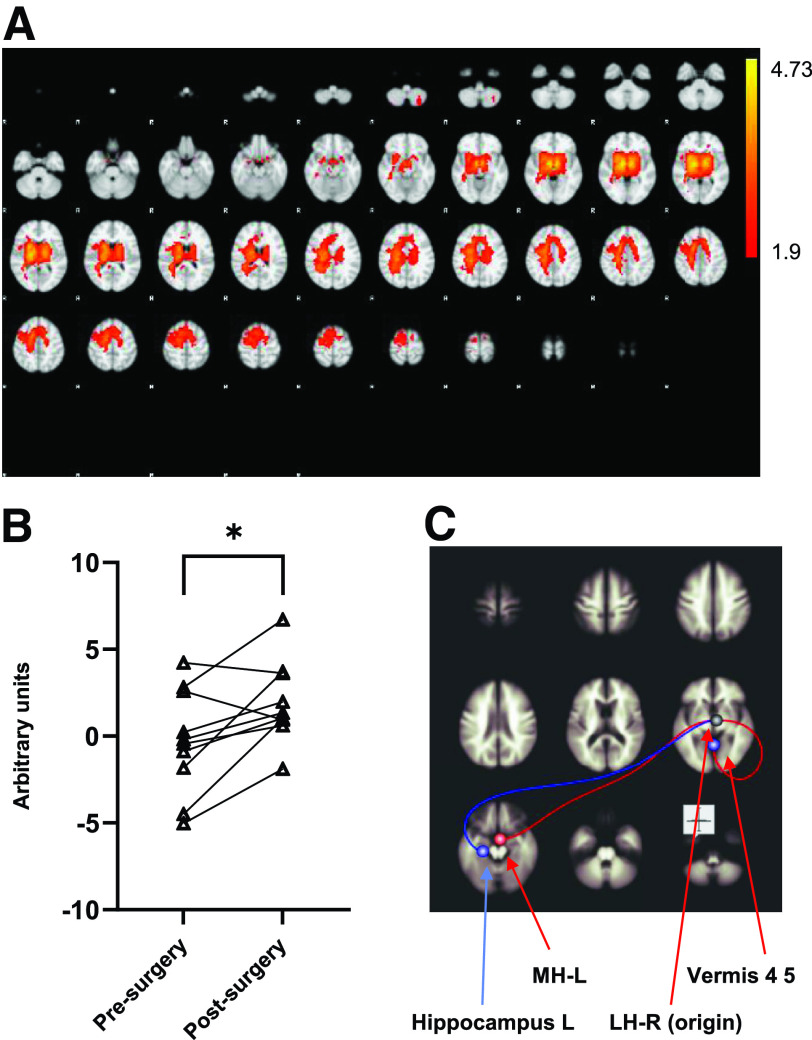
While Roux-en-Y gastric bypass (RYGB) surgery in obese individuals typically improves glycemic control and prevents diabetes, it also frequently causes asymptomatic hypoglycemia. Previous work showed attenuated counterregulatory responses following RYGB. The underlying mechanisms as well as the clinical consequences are unclear. In this study, 11 subjects without diabetes with severe obesity were investigated pre- and post-RYGB during hyperinsulinemic normo-hypoglycemic clamps. Assessments were made of hormones, cognitive function, cerebral blood flow by arterial spin labeling, brain glucose metabolism by 18F-fluorodeoxyglucose (FDG) positron emission tomography, and activation of brain networks by functional MRI. Post- versus presurgery, we found a general increase of cerebral blood flow but a decrease of total brain FDG uptake during normoglycemia. During hypoglycemia, there was a marked increase in total brain FDG uptake, and this was similar for post- and presurgery, whereas hypothalamic FDG uptake was reduced during hypoglycemia. During hypoglycemia, attenuated responses of counterregulatory hormones and improvements in cognitive function were seen postsurgery. In early hypoglycemia, there was increased activation post- versus presurgery of neural networks in brain regions implicated in glucose regulation, such as the thalamus and hypothalamus. The results suggest adaptive responses of the brain that contribute to lowering of glycemia following RYGB, and the underlying mechanisms should be further elucidated.


Figures

Figure 1
Figure 1
Schematic overview of the clamp and imaging investigations performed pre- and post-RYGB. Arrows at the bottom indicate time points for hormone blood samples. ASL, arterial spin labeling; DSST, Digital Symbol Substitution Test; EHSS, Edinburg Hypoglycemia Symptom Scale; HRV, heart rate variability; TMT, Trail Making Test.
Figure 2
Figure 2
AH: Glucose levels, glucose infusion rates, and hormone levels during normoglycemic and hypoglycemic clamp. Data are median ± IQR (all but panel A) or mean ± SD (A). *P < 0.05, **P < 0.01, ***P < 0.001. P values refer to differences between pre- and postsurgery, during the hypoglycemic period (brackets, AUCs) or fasting levels (baseline). P values within brackets refer to Wilcoxon signed rank tests of ΔAUC (for all panels except D, where total AUC is shown). GIR, glucose infusion rate; hypo, hypoglycemic phase of clamp; LBM, lean body mass; Preop, preoperative; Postop, postoperative.
Figure 3
Figure 3
FDG PET of the brain. A: Whole-brain Ki values during normo- and hypoglycemia. B: MRglu during normoglycemia. C: Ki PET images for a typical patient pre- and postsurgery during normo- and hypoglycemia. Data in panels A and B presented as spaghetti plot of individual values with individual connecting lines and mean of all subjects at that time point (horizontal solid lines). n = 11. *P < 0.05, ***P < 0.001 for post- vs. presurgery (paired t tests). PreNormo and PostNormo: missing data for one subject; PreHypo: missing data for four subjects; PostHypo: missing data for two subjects.
Figure 4
Figure 4
Difference in 18F-FDG net influx rates between hypo- and normoglycemic clamp periods. PET statistical parametric mapping (SPM) T-maps show comparisons from the presurgery (A and B) and postsurgery (C and D) investigations, respectively. A and C show clusters with significantly increased 18F-FDG net influx rate for hypo- vs. normoglycemia (red), whereas B and D show clusters with significant reduction (blue). The color maps represent T-values, indicating the number of pooled standard deviations between net influx rate values during hypo- vs. normoglycemia, where T > 1.96 corresponds to P < 0.05. Minimum cluster size for significance was 50 voxels (0.4 cm3). The crosshairs are centered on the hypothalamic cluster in panel B and the peak coordinates (MNI) are 0, −8, −22.
Figure 5
Figure 5
Regional CBF (by ASL) for normo- and hypoglycemia states in subjects pre- and postsurgery. Data are presented as spaghetti plots of individual values with individual connecting lines and mean of all subjects at that time point (horizontal solid lines). *P < 0.05 (paired t tests, n = 11). hypo, hypoglycemic phase of clamp; normo, normoglycemic phase of clamp; Pre, preoperative; Post, postoperative.
Figure 6
Figure 6
fMRI. A: TICA across all six resting fMRI runs revealed one IC, which represents a functional connectivity resting-state network, explaining most variability. This resting-state network was defined purely on the provided data without prior assumption and includes, notably, bilateral thalamus and hypothalamus. The activity of this IC was significantly higher after vs. before surgery (red color; S-mode) during the first 20 min of the hypoglycemic clamp (i.e., rapid glucose lowering) (P < 0.05). The color code represents T-values. B: Individual data of the above IC activity (S-mode) during the initial phase of hypoglycemia. *P < 0.05. C: The ROI functional connectivity analysis using the right LH as seed region as defined on the basis of previous literature (31). During initial hypoglycemia, there was a significantly decreased functional connectivity to left hippocampus and a significantly increased functional connectivity to vermis regions 4 and 5 for the post- vs. presurgery condition. Similar increases in connectivity to corresponding regions were obtained using the left LH as seed region (data not shown). n = 10. L, left; LH, lateral hypothalamus; MH, medial hypothalamus; R, right.

Comment in

  • Is Bariatric Surgery Brain Surgery?
    Sewaybricker LE, Schur EA. Sewaybricker LE, et al. Diabetes. 2021 Jun;70(6):1244-1246. doi: 10.2337/dbi21-0022. Epub 2021 May 20. Diabetes. 2021. PMID: 34016595 Free PMC article. No abstract available.

Similar articles

Cited by

References

    1. Buchwald H, Estok R, Fahrbach K, et al. . Weight and type 2 diabetes after bariatric surgery: systematic review and meta-analysis. Am J Med 2009;122:248–256.e5 - PubMed
    1. Katsogiannos P, Kamble PG, Wiklund U, et al. . Rapid changes in neuroendocrine regulation may contribute to reversal of type 2 diabetes after gastric bypass surgery. Endocrine 2020;67:344–353 - PMC - PubMed
    1. Sjöström L, Lindroos A-K, Peltonen M, et al. .; Swedish Obese Subjects Study Scientific Group . Lifestyle, diabetes, and cardiovascular risk factors 10 years after bariatric surgery. N Engl J Med 2004;351:2683–2693 - PubMed
    1. Morínigo R, Moizé V, Musri M, et al. . Glucagon-like peptide-1, peptide YY, hunger, and satiety after gastric bypass surgery in morbidly obese subjects. J Clin Endocrinol Metab 2006;91:1735–1740 - PubMed
    1. Abrahamsson N, Edén Engström B, Sundbom M, Karlsson FA. Hypoglycemia in everyday life after gastric bypass and duodenal switch. Eur J Endocrinol 2015;173:91–100 - PubMed

Publication types

MeSH terms