. 2021 May;70(5):1098-1116.
doi: 10.2337/db20-0553. Epub 2021 Mar 5.

Unique Human and Mouse β-Cell Senescence-Associated Secretory Phenotype (SASP) Reveal Conserved Signaling Pathways and Heterogeneous Factors

Affiliations

Unique Human and Mouse β-Cell Senescence-Associated Secretory Phenotype (SASP) Reveal Conserved Signaling Pathways and Heterogeneous Factors

Ayush Midha et al. Diabetes. 2021 May.

Abstract

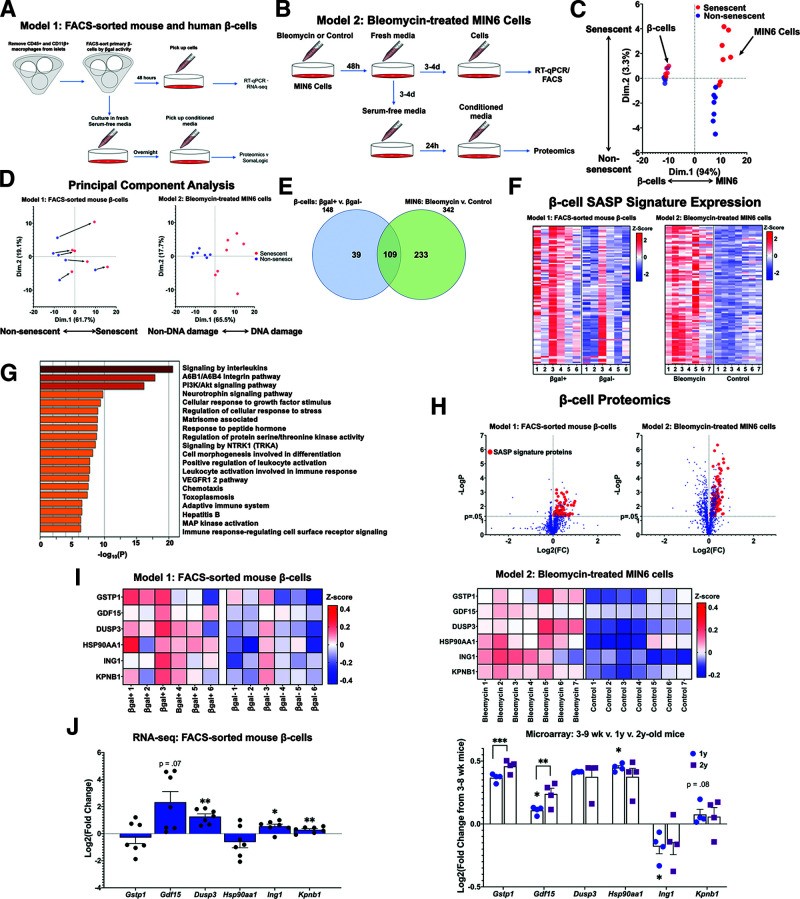
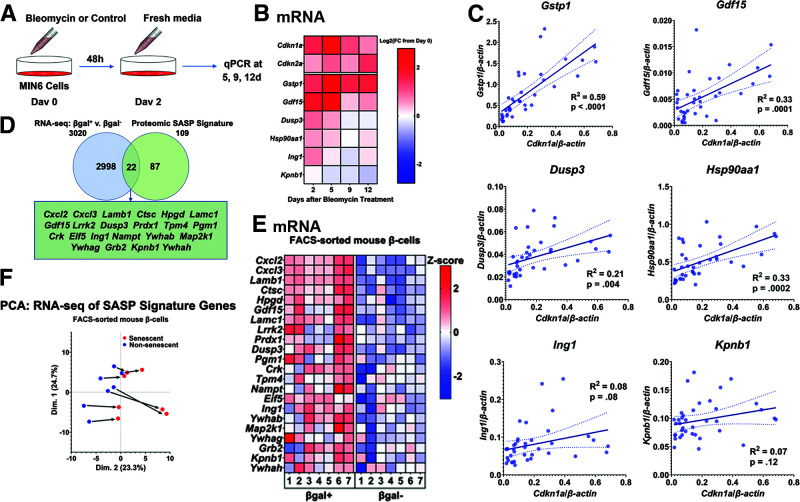
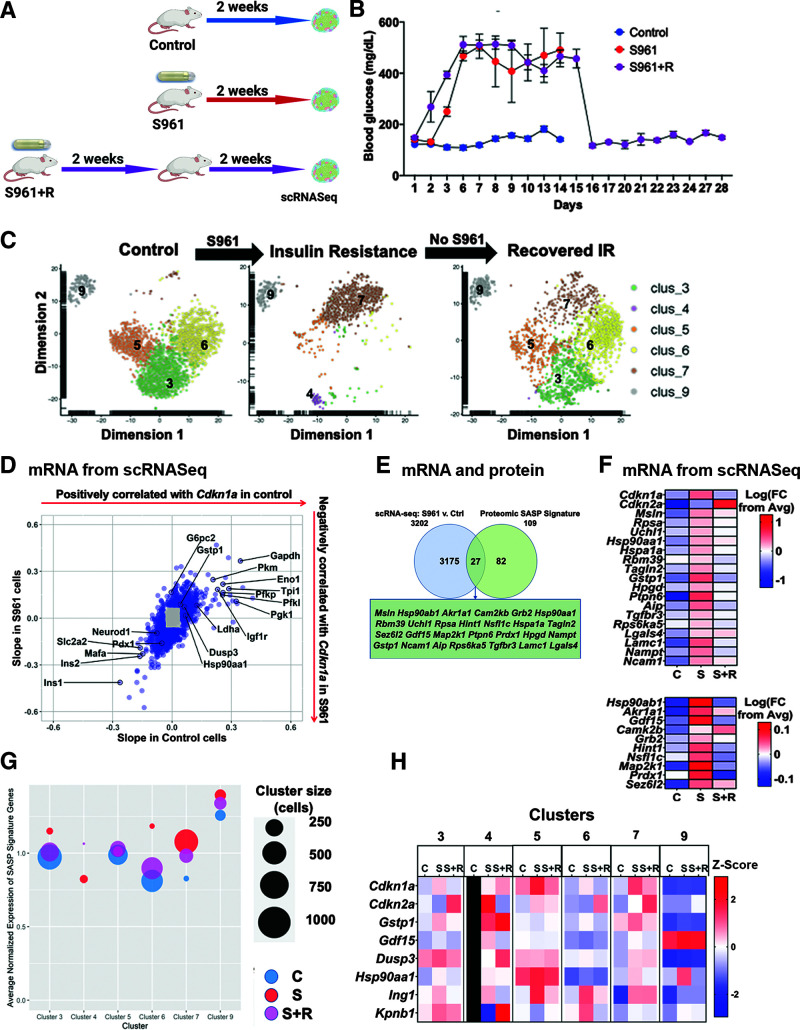
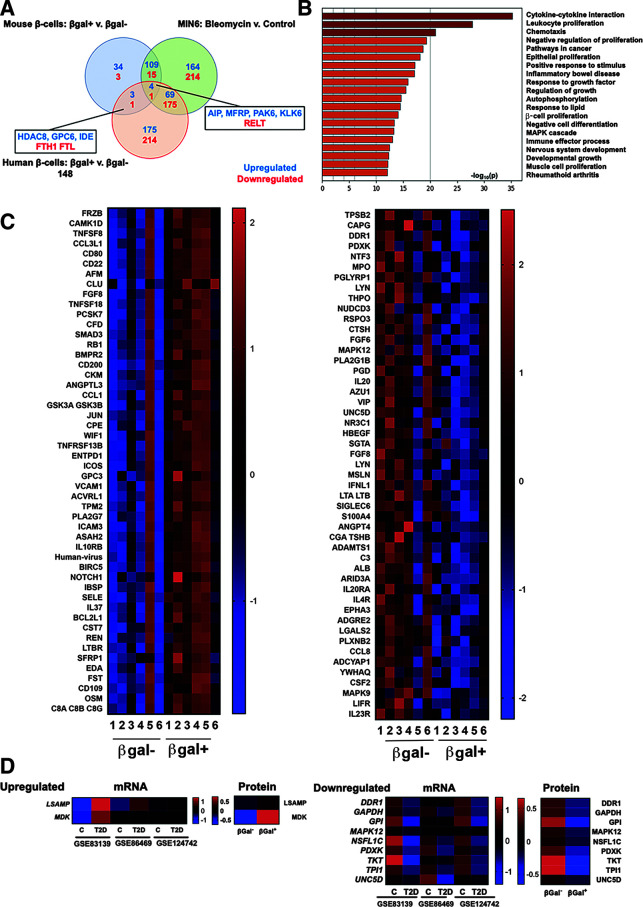
The aging of pancreatic β-cells may undermine their ability to compensate for insulin resistance, leading to the development of type 2 diabetes (T2D). Aging β-cells acquire markers of cellular senescence and develop a senescence-associated secretory phenotype (SASP) that can lead to senescence and dysfunction of neighboring cells through paracrine actions, contributing to β-cell failure. In this study, we defined the β-cell SASP signature based on unbiased proteomic analysis of conditioned media of cells obtained from mouse and human senescent β-cells and a chemically induced mouse model of DNA damage capable of inducing SASP. These experiments revealed that the β-cell SASP is enriched for factors associated with inflammation, cellular stress response, and extracellular matrix remodeling across species. Multiple SASP factors were transcriptionally upregulated in models of β-cell senescence, aging, insulin resistance, and T2D. Single-cell transcriptomic analysis of islets from an in vivo mouse model of reversible insulin resistance indicated unique and partly reversible changes in β-cell subpopulations associated with senescence. Collectively, these results demonstrate the unique secretory profile of senescent β-cells and its potential implication in health and disease.


Figures

Figure 1
Figure 1
The β-cell SASP signature included proinflammatory and stress response proteins. A: Workflow for sorting primary mouse and human β-cells into βgal+ and βgal populations for gene expression and proteomic analysis. CM for proteomic analysis was generated using overnight culture of β-cells in serum-free islet media. B: Workflow for conducting gene expression and proteomic analysis of DNA-damaged MIN6 cells. CM for proteomic analysis was generated using 24-h culture of MIN6 cells in serum-free MIN6 media. C: PCA of proteomic data derived from CM from both models (A and B). Points were divided primarily based on cell type, but senescent cells clustered separately from nonsenescent cells as well. D: PCA of proteomic data divided into the two models of SASP generation. For both models, SASP-secreting cells differed consistently from their non-SASP–secreting counterparts. CM samples drawn from βgal-sorted β-cells (A) were paired, and CM samples from MIN6 cells (B) were unpaired. Bleomycin-treated and control MIN6 samples are referenced in this figure as “DNA damage” and “Non-DNA damage,” respectively. E: Venn diagram showing the number of proteins upregulated in each model of β-cell senescence. A total of 109 proteins were upregulated in both models of senescence, and these proteins were used to define the β-cell SASP signature. F: Heat maps showing relative expression levels of β-cell SASP signature proteins in each sample from both models. Expression levels are shown as z scores, and the midpoint of 0 represents average expression across all samples. G: Pathway analysis of β-cell SASP signature proteins. Inflammatory and stress-response pathways were significantly upregulated in senescent β-cells. H: Volcano plot showing Log2 fold change (FC) and −LogP of all proteins analyzed in SOMAscan analysis. β-Cell SASP signature proteins are shown as red points. I: Heat maps showing protein expression levels of six top SASP targets (GSTP1, GDF15, DUSP3, HSP90AA1, ING1, and KPNB1) in each sample from both models. Expression levels are shown as z scores, and the midpoint of 0 represents average expression across all samples. In model 1, samples were paired, and all six proteins were present at significantly higher concentrations in βgal+ CM. J: mRNA expression levels of top SASP targets in transcriptomic data. Based on RNA-seq data, most of the top SASP targets were transcriptionally upregulated in βgal+ β-cells. Based on microarray data from the β-cells of young, middle-aged, and old mice, most top SASP targets were also transcriptionally upregulated with chronological age. Results shown as mean ± SEM. For RNA-seq data: *0.011 < P < 0.028; ***0.0000054 < P < 0.00082. For microarray data: *0.023 < P < 0.038; **P = 0.0013; ***0.0000514 < P < 0.00017. d, days; wk, weeks; RT-qPCR, quantitative RT-PCR; v., versus.
Figure 2
Figure 2
β-Cell SASP expression levels were heterogeneous, but senescence induced a consistent shift in the β-cell secretome. A: Workflow of MIN6 senescence time-course experiments. Cells were treated with bleomycin for 2 days and then cultured in regular MIN6 media. Cells were collected at days 0, 2, 5, 9, and 12 for RNA isolation and RT-qPCR. B: Heat map showing expression levels at each time point of senescence genes (Cdkn1a and Cdkn2a) and top SASP targets in MIN6 cells. Expression of Cdkn1a, Gstp1, and Gdf15 increased significantly and peaked within 5 days of bleomycin treatment. Dusp3, Hsp90aa1, and Ing1 were transcriptionally upregulated to lower levels within 5 days, and expression of Kpnb1 declined by day 5. Expression levels are shown as the Log2 of the fold change (FC) from day 0 expression, and the midpoint of 0 represents a fold change of 1. Results were drawn from five total replicates across three separate experiments. C: Graphs showing expression levels of top SASP targets from individual samples across time points and their correlations with Cdkn1a expression. Gstp1, Gdf15, Dusp3, and Hsp90aa1 were all significantly associated with Cdkn1a expression. Expression levels of each gene varied considerably across samples. Lines of best fit are shown, along with dotted lines indicating their 95% CIs. P values were calculated using the null hypothesis that the slope of the best fit line equals 0. D: Venn diagram showing the number of genes significantly upregulated at the transcript level in βgal+ β-cells and the number of genes in the β-cell SASP signature. A total of 22 genes were upregulated at both the transcript level and protein level in senescent β-cells. Of the top SASP targets, Gdf15, Ing1, and Kpnb1 were upregulated both at the transcript and protein levels. E: Heat map showing transcriptional expression of the 22 genes upregulated in both the transcriptomic and proteomic analysis of senescent β-cells. βgal+ β-cells expressed these genes at significantly higher levels than βgal β-cells. Expression levels are shown as z scores, and the midpoint of 0 represents average expression across all samples. Samples were paired, and all 22 genes were significantly transcriptionally upregulated in βgal+ cells. F: PCA of the RNA-seq samples using only the data from β-cell SASP signature genes. Samples varied on their starting point along the x-axis, but senescence generated a consistent rightward shift. d, days; qPCR, quantitative PCR; v., versus.
Figure 3
Figure 3
Acute insulin resistance altered the β-cell secretome, upregulating SASP signature genes. A: Workflow for S961 and recovery experiments to induce acute insulin resistance in mice. B: Blood glucose levels showed that mice with pumps delivering S961 experienced persistent hyperglycemia within 6 days of pump insertion. Removing the pumps returned blood glucose to normal levels. C: t-SNE plots of β-cell clusters in each treatment group. Acute insulin resistance (IR) significantly altered the transcriptional landscape of β-cells, creating new subpopulations based on transcriptional changes. Two-week recovery resulted in a transcriptional profile that resembles a mix of the control and S961 treatment groups. D: Scatterplot showing correlations of genes with Cdkn1a expression in the β-cells of control (x-axis) and S961-treated (y-axis) mice. Genes that had correlations corresponding to a z score >2 or < –2 in both mouse groups were colored blue. E: Venn diagram showing the number of genes upregulated in the β-cells of S961 mice and the β-cell SASP signature. Out of 109 β-cell SASP signature factors, 27 genes, including Gdf15, were also significantly upregulated at the transcript level in the β-cells of mice experiencing acute insulin resistance. Significance was calculated using two-sample t tests. F: Upregulated SASP factors in S961 β-cells. Heat map showing average expression levels by scRNA-seq of senescence genes Cdkn1a and Cdkn2a, as well as the 27 β-cell SASP signature genes that were transcriptionally upregulated in the β-cells of S961 mice. For most of the SASP signature genes, expression returned to normal levels in the β-cells of the recovered mice. Expression levels are shown as the log of the fold change (FC) from overall average (Avg), and the midpoint of 0 represents average expression across all samples. The scale differs for the top and bottom segments of the heat map. G: Bubble plot average expression of entire β-cell SASP signature in each cluster and treatment. Cluster size is represented by bubble size. Expression levels of individual genes in each cluster were normalized to average expression across all treatment groups, and total SASP signature expression was calculated as an average of the normalized expression levels of component genes. H: Heat map showing expression of top β-cell SASP targets in each cluster as identified by the t-SNE analysis in C. Expression levels are shown as z scores, and the midpoint of 0 represents average expression across all samples. Cluster 4 did not appear in the control group, so all control cluster 4 squares are marked in black. Ctrl, control; C, control group; S, S961 mice; S+R, S961 plus recovery mice; v., versus.
Figure 4
Figure 4
Human SASP reveals conserved pathways and a subset of factors that coincide with β-cell transcriptional changes in T2D. A: Venn diagram showing the number of proteins upregulated and downregulated in each model of β-cell senescence. Five proteins overlapped in all three models, while four additional ones were shared between the human and mouse secretomes. B: Pathway analysis of human β-cell SASP signature proteins. The list of pathways was similar to that of senescent mouse β-cells. Inflammatory and stress-response pathways were significantly upregulated in human and mouse senescent β-cells; additionally, proliferative inhibition featured high on the human list. C: Heat maps showing protein expression levels of the 50 top upregulated and downregulated human SASP factors. Expression levels are shown as z scores, and the midpoint of 0 represents average expression across all samples. Samples were paired, and all proteins were significantly differentially expressed in βgal+ CM compared with its βgal counterpart. D: Heat map showing expression levels of upregulated and downregulated genes in β-cells from donors with and without T2D that coincided with changes of SASP factors from senescent and nonsenescent human β-cells. Expression levels are shown as z scores. C, control (without diabetes); v., versus.

Similar articles

Cited by

References

    1. Weir GC, Bonner-Weir S.. Five stages of evolving beta-cell dysfunction during progression to diabetes. Diabetes 2004;53(Suppl. 3):S16–S21 - PubMed
    1. Kalyani RR, Golden SH, Cefalu WT.. Diabetes and aging: unique considerations and goals of care. Diabetes Care 2017;40:440–443 - PMC - PubMed
    1. Aguayo-Mazzucato C, Andle J, Lee TB Jr, et al. . Acceleration of β cell aging determines diabetes and senolysis improves disease outcomes. Cell Metab 2019;30:129–142.e4 - PMC - PubMed
    1. López-Otín C, Blasco MA, Partridge L, Serrano M, Kroemer G.. The hallmarks of aging. Cell 2013;153:1194–1217 - PMC - PubMed
    1. McHugh D, Gil J.. Senescence and aging: causes, consequences, and therapeutic avenues. J Cell Biol 2018;217:65–77 - PMC - PubMed

Publication types