. 2021 Mar 5;12(1):1478.
doi: 10.1038/s41467-021-21652-z.

MINFLUX nanometer-scale 3D imaging and microsecond-range tracking on a common fluorescence microscope

Affiliations

MINFLUX nanometer-scale 3D imaging and microsecond-range tracking on a common fluorescence microscope

Roman Schmidt et al. Nat Commun. .

Abstract

The recently introduced minimal photon fluxes (MINFLUX) concept pushed the resolution of fluorescence microscopy to molecular dimensions. Initial demonstrations relied on custom made, specialized microscopes, raising the question of the method's general availability. Here, we show that MINFLUX implemented with a standard microscope stand can attain 1-3 nm resolution in three dimensions, rendering fluorescence microscopy with molecule-scale resolution widely applicable. Advances, such as synchronized electro-optical and galvanometric beam steering and a stabilization that locks the sample position to sub-nanometer precision with respect to the stand, ensure nanometer-precise and accurate real-time localization of individually activated fluorophores. In our MINFLUX imaging of cell- and neurobiological samples, ~800 detected photons suffice to attain a localization precision of 2.2 nm, whereas ~2500 photons yield precisions <1 nm (standard deviation). We further demonstrate 3D imaging with localization precision of ~2.4 nm in the focal plane and ~1.9 nm along the optic axis. Localizing with a precision of <20 nm within ~100 µs, we establish this spatio-temporal resolution in single fluorophore tracking and apply it to the diffusion of single labeled lipids in lipid-bilayer model membranes.


Conflict of interest statement

The authors declare the following competing interests. The Max Planck Society holds patents on MINFLUX. R.S., T.W., C.A.W., and I.J. are employees of Abberior Instruments manufacturing MINFLUX microscopes. C.A.W. and J.R. are employees of Abberior commercializing fluorophores for super resolution. C.A.W. and S.W.H. hold shares of Abberior Instruments, S.W.H. also of Abberior. S.J.S. declares no competing interests.

Figures
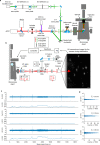
Fig. 1
Fig. 1. MINFLUX fluorescence nanoscope with optical-feedback stabilization on an all-purpose microscope stand: sub-nanometer stability.
a Optical arrangement. An excitation beam (shown in green) is electro-optically deflected in x,y, spatially phase-modulated for conversion into a donut-shape, overlapped with an activation beam (purple) and, after passing a deformable mirror and a galvanometer scanner in a 3D scanning assembly, focused into the sample on top of an all-purpose inverted microscope stand. Fluorescence from the sample (red) is descanned by the scanning assembly and passed to a variable confocal pinhole for detection using two avalanche photodiodes (APD). A stabilization unit based on both near-infrared scattering from fiducial markers and active-feedback correction provides sub-nanometer stability. b Layout of the stabilization unit including an example widefield image of the scattered reflection signal of gold nanorods in the sample. c Sample displacements ∆x,y,z from the target position as measured by the active stabilization over 2.2 h, and their running standard deviations σx,y,z over a 1-min window. While varying vibrational interference from the surroundings is reflected in the stabilization performance, σx,y,z typically stay well below 1 nm. d Histograms of the displacements and their standard deviations over the full 2.2 h interval shown in (c). Source data are provided as a Source Data file. Scale bar: 2 µm (b).
Fig. 2
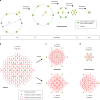
Fig. 2. Targeted coordinate patterns (TCP) in sequential iterations for imaging and fast single-molecule tracking.
a The TCP defines a set of relative coordinates that are used to probe the position of the fluorescent molecule (star) in the sample. In a typical 2D MINFLUX iteration, the central zero of the donut-shaped excitation beam is targeted to these coordinates that are arranged in a hexagon with diameter L plus an optional midpoint (all in green). After each iteration, the TCP is re-centered based on the prior estimate of the molecular position. A MINFLUX sequence defines the parameters of these consecutive localization iterations, starting with a pre-scan, followed by intermediate and final iterations which are processed during individual localization events. Scale bar: 150 nm. bd Typical parameters and estimator performances for imaging and tracking applications. While imaging sequences tend to spend more photons on later iterations to maximize precision, tracking sequences are optimized for speed and thus spend only minimal photons on the final iteration, which tracks the molecule (d). Simulated molecules at positions (crosses) within the FOV and the distributions (red) of their respective estimate represented by their mean (dot) and confidence intervals (ellipsoids). Note the nonvanishing residual bias at the outmost grid locations which marks the edge of the usable field of view. In the tracking parts of (c, d), every second confidence interval is shown for clarity of display. Source data are provided as a Source Data file. Scale bars: 100 nm (b), 50 nm (c, d).
Fig. 3
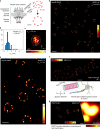
Fig. 3. MINFLUX fluorescence imaging of labeled cellular ultrastructure down to 1 nm (standard deviation) in fluorophore precision.
a Nup96 localizes in two eightfold-symmetric rings within the nuclear pore complex. b Histogram of the standard deviation from sets of sequential localizations based on 2100 photons each taken from the uninterrupted photon emission traces at the final MINFLUX iteration step (Nup96 data shown in (d)). Molecules providing ≥ 4 localizations per trace were considered. c Histogram of the distance of a localization to the mean position of a single fluorophore (data as in (b)). The ellipses are displayed with semi-axes of σ, 2σ, and 3σ in length, with σ the precision obtained from a combined analysis of the statistical localization spread (standard deviation) in x and y. d MINFLUX nanoscopy reconstruction of Nup96-SNAP labeled with Alexa Fluor 647 from raw localization data and e with single-molecule fluorescence events combined into aggregates of ~2100 photons. f BetaII spectrin in the axon of a hippocampal neuron from rat. g PMP70 in peroxisomes in a Vero cell. A confocal scan of adjacently found peroxisomes is included for comparison. Please note that the images shown in (e, f) were derived from samples created by indirect immunofluorescence. Explanatory drawings adapted from ref. (a) and ref. (f). Source data are provided as a Source Data file. Scale bars: 50 nm (a), 2 nm (c), 250 nm (d), 100 nm (e), 200 nm (f, g).
Fig. 4
Fig. 4. MINFLUX single-molecule tracking at ~100 µs temporal sampling.
a Fluorescence intensity over time for a ~3-s excerpt of tracking DPPE-ATTO 647N lipid diffusion (at room temperature) in a supported lipid bilayer. b Histogram of photons per localization for the data shown in (a). c Duration of individual localizations. d Histogram of the standard deviations in the lateral displacements Δx and Δy of consecutive localizations, providing a conservative measure on the precision of individual localizations. e xy trajectory color coded to indicate the passage of time. f Enhanced temporal acquisition, sampling at 8.577 kHz (mean of 117 µs per localization). g, h Data as in (c, d) for the faster single-lipid tracking experiment. Source data are provided as a Source Data file. Scale bars: 200 nm (e, f).
Fig. 5
Fig. 5. 3D MINFLUX imaging.
a Individual TCPs for iterative 3D MINFLUX are constructed from an octahedron-shaped coordinate set. Coordinates that deviate from the nominal focal plane are addressed by defocusing via a deformable mirror. b Lateral and c axial precision of Nup96-SNAP localizations, inferred from single-molecule fluorescence event aggregates of ~1200 photons. d Histogram of the distance between individual localizations of a single fluorophore and its mean position estimate. e Example of raw data and f rendering of a pore compare Supplementary Movie S1 for a large field of view. Panels (bd) display pooled data from these data sets. g Clathrin visualized by SNAP labeling of the clathrin light chain in HeLa cells. The region demarcated by the white lines has an extent of 2.2 × 1.1 µm2. All SNAP-tags were labeled with Alexa Fluor 647. Source data are provided as a Source Data file. Scale bars: 4 nm (d), 100 nm (e, f), 200 nm (g).

References

    1. Hell SW. Far-field optical nanoscopy. Science. 2007;316:1153–1158. doi: 10.1126/science.1137395. - DOI - PubMed
    1. Hell SW, Wichmann J. Breaking the diffraction resolution limit by stimulated emission: stimulated-emission-depletion fluorescence microscopy. Opt. Lett. 1994;19:780–782. doi: 10.1364/OL.19.000780. - DOI - PubMed
    1. Klar TA, Jakobs S, Dyba M, Egner A, Hell SW. Fluorescence microscopy with diffraction resolution barrier broken by stimulated emission. Proc. Natl Acad. Sci. 2000;97:8206–8210. doi: 10.1073/pnas.97.15.8206. - DOI - PMC - PubMed
    1. Göttfert F, et al. Coaligned dual-channel STED nanoscopy and molecular diffusion analysis at 20 nm resolution. Biophys. J. 2013;105:L01–L03. doi: 10.1016/j.bpj.2013.05.029. - DOI - PMC - PubMed
    1. Hell SW. Toward fluorescence nanoscopy. Nat. Biotech. 2003;21:1347–1355. doi: 10.1038/nbt895. - DOI - PubMed

Publication types

MeSH terms

Substances