. 2021 Mar 5;12(1):1460.
doi: 10.1038/s41467-021-21617-2.

Mitochondrial arginase-2 is essential for IL-10 metabolic reprogramming of inflammatory macrophages

Affiliations

Mitochondrial arginase-2 is essential for IL-10 metabolic reprogramming of inflammatory macrophages

Jennifer K Dowling et al. Nat Commun. .

Abstract

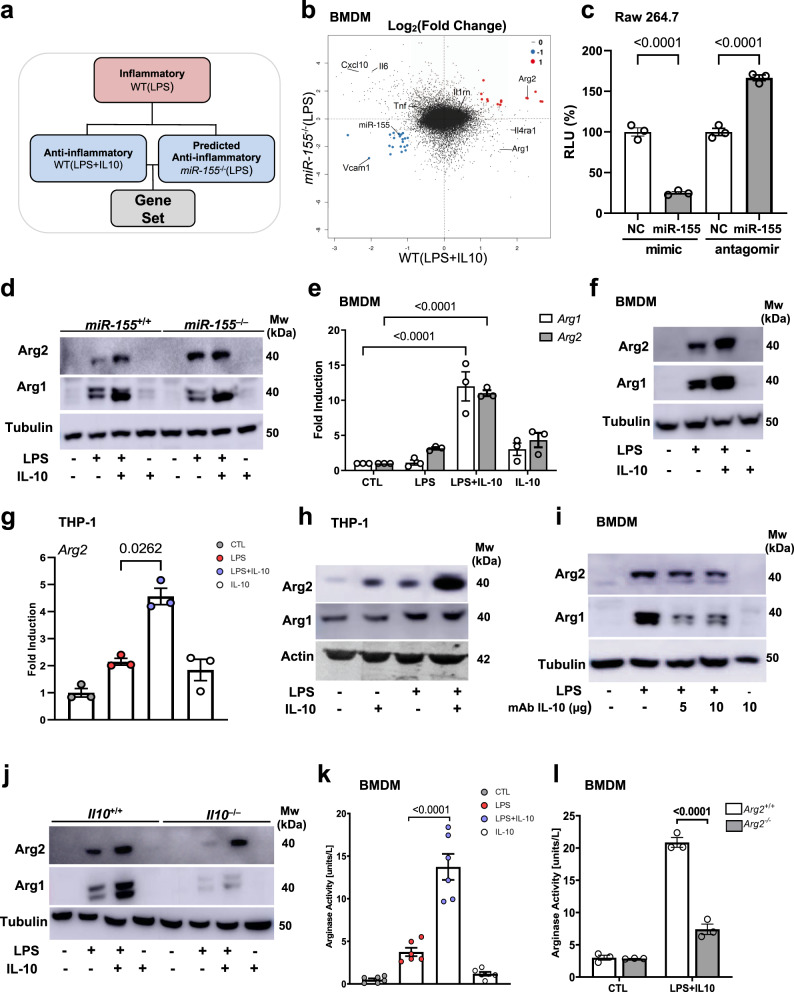
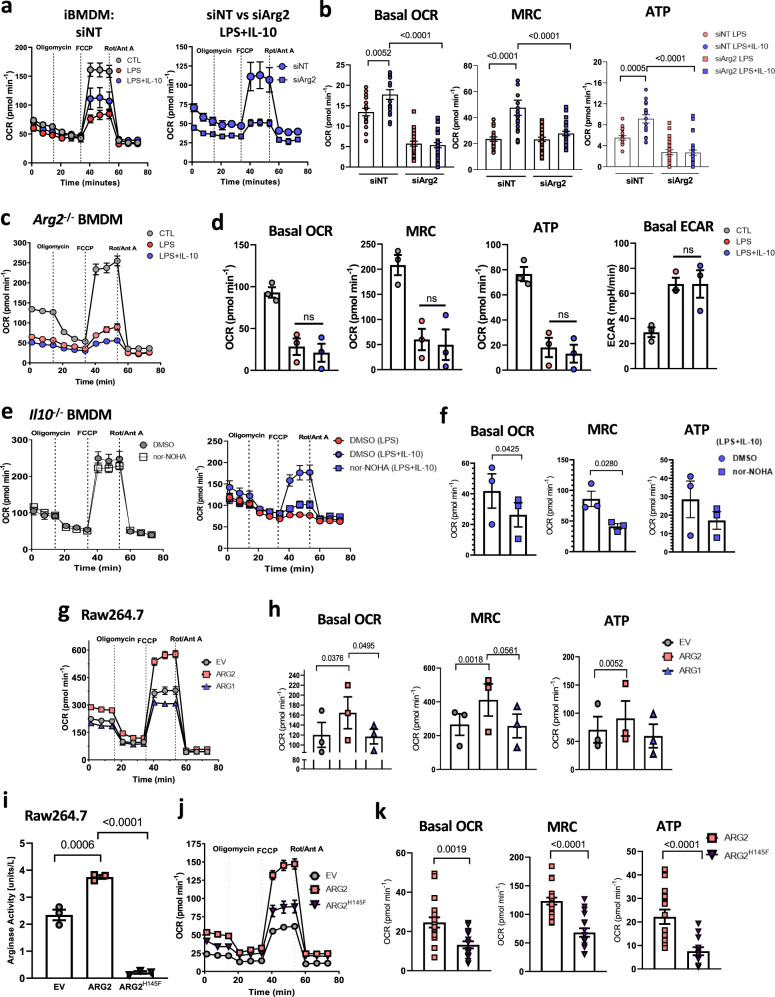
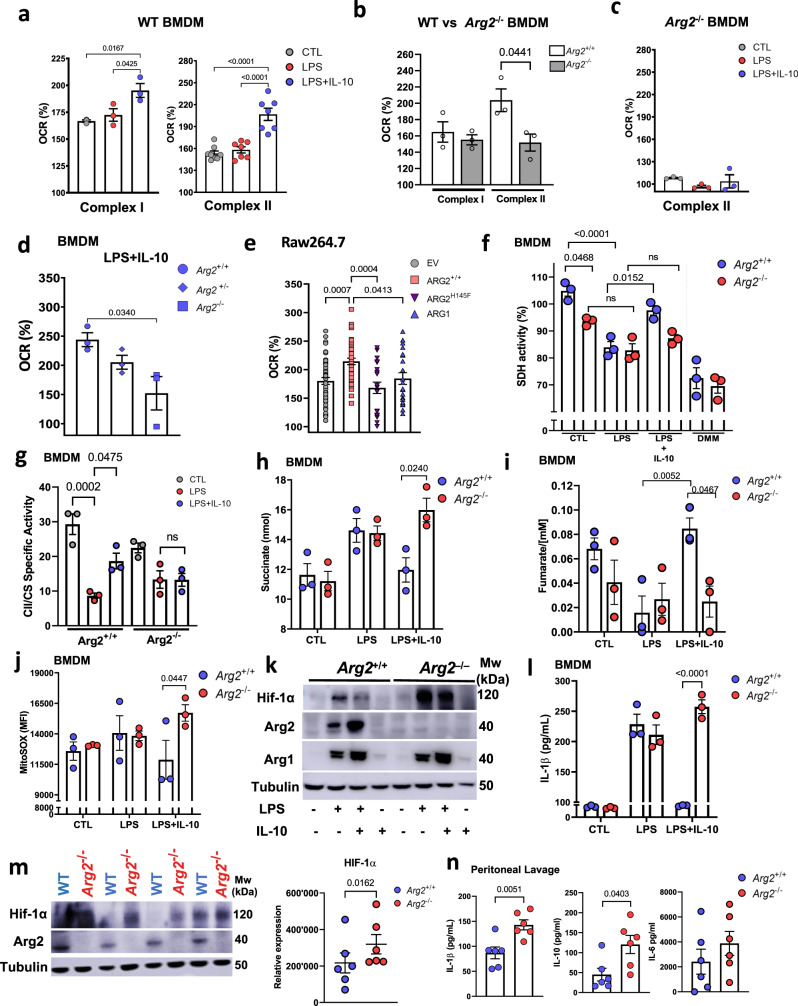
Mitochondria are important regulators of macrophage polarisation. Here, we show that arginase-2 (Arg2) is a microRNA-155 (miR-155) and interleukin-10 (IL-10) regulated protein localized at the mitochondria in inflammatory macrophages, and is critical for IL-10-induced modulation of mitochondrial dynamics and oxidative respiration. Mechanistically, the catalytic activity and presence of Arg2 at the mitochondria is crucial for oxidative phosphorylation. We further show that Arg2 mediates this process by increasing the activity of complex II (succinate dehydrogenase). Moreover, Arg2 is essential for IL-10-mediated downregulation of the inflammatory mediators succinate, hypoxia inducible factor 1α (HIF-1α) and IL-1β in vitro. Accordingly, HIF-1α and IL-1β are highly expressed in an LPS-induced in vivo model of acute inflammation using Arg2-/- mice. These findings shed light on a new arm of IL-10-mediated metabolic regulation, working to resolve the inflammatory status of the cell.


Conflict of interest statement

The authors declare no competing interests.

Figures

Fig. 1
Fig. 1. Arginase-2 is regulated by an IL-10/miR-155 axis in inflammatory macrophages.
Macrophages (BMDM, Raw 264.7, or THP-1) were left untreated or stimulated with either LPS, LPS + IL-10, or IL-10 alone for 24 h. a Schematic of microarray design. Comparison of gene expression changes between WT(LPS) BMDM (inflammatory), WT(LPS + IL-10) BMDM (anti-inflammatory) or miR-155−/−(LPS) BMDM, (predicted anti-inflammatory). b MA plot illustrating log fold-change between miR-155−/−(LPS) and WT(LPS + IL-10) activated macrophages with common upregulated (red) and downregulated (blue) genes. Also shown are common inflammatory and anti-inflammatory genes in macrophages. c Luciferase activity assay of the Arg2 3′UTR reported as relative light units (RLU) in the presence or absence of miR-155 mimic or inhibitor in Raw 264.7 cells (n = 3 independent experiments). Non-targeting control (NC) mimic or inhibitor are reported as reference and set at 100%. d Arg2 and Arg1 protein levels in miR-155+/+ and miR-155−/− BMDM. Representative of n = 3 biological replicates. e RT-PCR analysis of Arg2 and Arg1 mRNA levels in BMDM (n = 3 biological replicates). Data compared by normalizing to m18s and analyzing relative fold change to unstimulated controls. f Arg2 and Arg1 protein levels in BMDM. Representative of (at least) n = 5 biologically independent experiments. g RT-PCR analysis of Arg2 mRNA levels in THP-1 cells (n = 3 independent experiments. Data points represent average of technical triplicates per independent experiment). Data were compared by normalizing to m18s, and analyzing relative fold change compared to unstimulated controls. hj Arg2 and Arg1 protein levels (representative of n = 3 biological independent experiments) in h THP-1 cells, i BMDM in the presence or absence of IL-10Ra (anti-IL-10R) antibody at indicated concentrations, j Il10+/+ and Il10−/− BMDM. k, l Urea as output of arginase activity in: k wild-type BMDM (n = 6 biological replicates), and l Arg2+/+ vs Arg2−/− BMDM (n = 3 biological replicates). c, e, g, k, l Data shown is mean with error bars representing ± SEM. Data were analysed by c Ordinary one-way ANOVA, and e, l two-way ANOVA, followed by c, e Tukey’s and l Sidak’s multiple comparisons post-hoc test. g, k Data for LPS vs LPS + IL-10 compared by paired two-tailed t-test. P-values are indicated on graphs for statistically significant comparisons.
Fig. 2
Fig. 2. Arginase-2 regulates dynamics at mitochondria in response to IL-10 in inflammatory macrophages.
a IVTT assay for mitochondrial import of pCMV-Arg1 and pCMV-Arg2. Gels were exposed to phosphor-scene for detection of imported proteins. 1 μl of complete IVTT protein was loaded as input control (lanes 1 and 6). Time course over 60 min showing bands representing proteins bound to and found inside the mitochondrial membrane. FCCP is used as a depolarising control. Radiograph representative of three experiments ran and processed in parallel. Graph shows densitometry analysis of the pooled experiments by measuring relative expression. b Immunoblot of Arg1 and Arg2 in fractionated Il10–/ BMDM that were unstimulated (CTL), or stimulated with LPS, LPS + IL-10, or IL-10 alone. VDAC and β-tubulin are used as mitochondrial and cytoplasmic controls, respectively. Representative of three independent experiments. c ImageStream showing colocalization levels of Tom20 and Arg2 in BMDM that were unstimulated (CTL), or stimulated with LPS, or LPS + IL-10. (Left) Representative images shown from ~1000 events. Channels shown are bright field (Ch01), Tom20 (green/Ch02), Arg2 (red/Ch11), and a merge. Original magnification, ×60. (Right) Graph showing colocalization index of Tom20 and Arg2 in the different treatments over two independent biological experiments. Each data point represents median index of ~1000 processed images. df BMDM were either left unstimulated (CTL), or stimulated with LPS, LPS + IL-10 or IL-10 alone, and stained with MitoTracker Red-CMXRos. Mitochondrial morphology was observed by confocal microscopy. Lower panels show a higher magnification of the image within the white squares. Arrows show mitochondrial fusion and fission. Graphs show results of mitochondrial morphology analysis as a mean of n = 3 independent biological experiments. Scale bars represent 5 µm. d Wild-type BMDM, e BMDM pre-treated with DMSO or nor-NOHA and f Arg2+/+ and Arg2–/– BMDM. a, df Data shown with error bars represents ± SEM. df Statistical significance was determined using two-way ANOVA with Tukey’s post-hoc test for multiple comparisons. P-values are indicated on graphs where there is significance between elongated mitochondrial fractions.
Fig. 3
Fig. 3. Arginase-2 enhances oxidative phosphorylation in inflammatory macrophages.
ah, j, k Oxygen consumption rates (OCR) were assessed by real-time metabolic flux assay by addition of Oligomycin (1 µM), FCCP (0.9 µM), and Rotenone + Antimycin A (Rot/Ant A) (0.5 µM) sequentially. a (Left) unstimulated siNT and siArg2 immortalized BMDM (iBMDM) cells and (right) LPS and/or LPS + IL-10 treated siNT vs siArg2 iBMDM (representative of n = 2 biological experiments). b, d, f, h, k Quantitative changes for the basal oxygen consumption rate (basal OCR), maximal respiratory capacity (MRC), and Oxphos-induced ATP levels. b LPS and LPS + IL-10 treated iBMDM cells that were either transfected with siNT or siArg2. Data points shown are pooled 15–20 technical replicates of two independent experiments. c Arg2–/– BMDM (trace representative of n = 3 biological repeats). d Quantitative changes in oxidative parameters for unstimulated, or LPS/ LPS + IL-10 stimulated Arg2–/– BMDM (n = 3 biological experiments). e Il10–/– BMDM (left) unstimulated, or (right) LPS/LPS + IL-10 stimulated (n = 3 biological experiments). Cells were either pre-treated with DMSO or with 150 μM nor-NOHA for 1 h before addition of IL-10 and/or LPS stimulations. f Quantitative changes in Il10–/– BMDMs pre-treated with DMSO or nor-NOHA in oxidative parameters for LPS + IL-10 treated cells. Data points are biological replicates (n = 3). g Raw264.7 macrophage expressing pCMV-EV, pCMV-Arg1 or pCMV-Arg2. Trace representative of three independent experiments. h Quantitative oxidative parameters changes in Raw264.7 cells transfected with overexpression plasmids from (g). Data points are three independent experiments (n = 3). ik Raw 264.7 macrophage expressing pCMV-EV, pCMV-Arg2 or catalytic dead mutant pCMV-H145F. i Arginase activity assay. Data points indicate three independent experiments. j Mitochondrial OCR trace representative of two independent experiments. k Arg2 vs H145F OCR parameters. Data points show pooled 15–20 technical replicates from two independent experiments. ak Data is presented for all traces and scatter plots as mean ± SEM. d, f, h Each biological or independent data point shown had 10–20 technical replicates. Data were analysed for statistical significance using a two-tailed Student’s t-test, and b, I, k using ordinary one-way ANOVA with Tukey’s post-hoc test for multiple comparisons. Respective p-values are indicated on graphs for results that were statistically significant.
Fig. 4
Fig. 4. Arginase-2 influences complex-II activity and regulates IL-1β secretion.
ae XFe96 based comparison of complex I and/or complex II specific OCR in untreated (CTL) BMDM or stimulated cells (with LPS or LPS + IL-10 for 24 h). Data plotted as oxygen consumption rate percentage (OCR%) increase after addition of substrate: a wild-type cells. n = 3 (complex I) and n = 7 (complex II) biological replicates. b Quiescent wild-type (Arg2+/+) vs Arg2–/–, c CTL vs stimulated Arg2–/–, d LPS + IL-10 stimulated Arg2+/+, Arg2+/–, and Arg2–/–; bd Data shown are biological n = 3. e Complex II specific OCR in Raw 264.7 overexpressing pCMV-SPORT6 plasmids for EV (empty vector), Arg2, H145F, and Arg1. Data show 20 technical replicates (for H145F and Arg1) and 40 technical replicates (for EV and Arg2) over two independent experiments. f SDH activity as determined by MTT assay in Arg2+/+ and Arg2–/– BMDM. SDH inhibitor dimethylmalonate (DMM) used as a control (n = 3 biological replicates). g Complex II specific activity measured by UV-VIS spectrophotometry in lysates from Arg2+/+ and Arg2–/– BMDM. Activity was normalized to citrate synthase (CS) as control (n = 3 biological triplicates), hl Comparison of wild-type (Arg2+/+) and Arg2–/– BMDM for levels of h succinate, i fumarate, j mitochondrial ROS (mtROS) by staining with mitoSOX, k protein expression for Hif-1α, Arg2, Arg1, and β-tubulin (as loading control); l IL-1β ELISA comparing secretion levels in supernatants. hj, l n = 3 biological replicates, and k representative of n = 3 independent experiments; m, n Arg2+/+ and Arg2–/– C57Bl/6J mice were given i.p injection of LPS at 10 mg/kg for 8 h: m (Left) Hif-1α, Arg2, and β-tubulin in spleen. Blot representative of six mice each from wild-type (WT) and Arg2–/–. (Right) densitometry analysis showing relative expression levels of Hif-1α (n = 6); n IL-1β, IL-10, and IL-6 secretion levels in peritoneal lavage (n = 6 biological replicates). aj, ln Data are presented for scatter plots as mean ± SEM. Data were analysed by ag, l ordinary one-way ANOVA with Tukey’s multiple comparisons, h, j, n two-tailed t-test with Welch’s correction, and I, m two-tailed paired t-test. Wherever significant, exact p-value is given on the figure.

References

    1. Murray PJ, et al. Macrophage activation and polarization: nomenclature and experimental guidelines. Immunity. 2014;41:14–20. doi: 10.1016/j.immuni.2014.06.008. - DOI - PMC - PubMed
    1. Tannahill GM, et al. Succinate is an inflammatory signal that induces IL-1beta through HIF-1alpha. Nature. 2013;496:238–242. doi: 10.1038/nature11986. - DOI - PMC - PubMed
    1. Jha AK, et al. Network integration of parallel metabolic and transcriptional data reveals metabolic modules that regulate macrophage polarization. Immunity. 2015;42:419–430. doi: 10.1016/j.immuni.2015.02.005. - DOI - PubMed
    1. Tan Z, et al. Pyruvate dehydrogenase kinase 1 participates in macrophage polarization via regulating glucose metabolism. J. Immunol. 2015;194:6082–6089. doi: 10.4049/jimmunol.1402469. - DOI - PMC - PubMed
    1. Vats D, et al. Oxidative metabolism and PGC-1beta attenuate macrophage-mediated inflammation. Cell Metab. 2006;4:13–24. doi: 10.1016/j.cmet.2006.05.011. - DOI - PMC - PubMed

Publication types